 🏗️ New Construction
HOMESITE 108 Bolingbroke Way · Charles Town, WV
Flood risk 1/10 · Minimal
- FEMA flood zone
- X (unshaded)
- Chance of flooding over 30 yrs
- 0.0%
- Est. flood insurance / yr
- $507 – $1,088
Fire risk 1/10 · Minimal
- Est. fire insurance / yr
- $787 – $1,461
Heat risk 5/10 · Moderate
- Hot days now (above 102°F)
- 7 days/yr
- Hot days in 30 yrs
- 16 days/yr
Wind risk 3/10 · Minor
- Chance of severe wind over 30 yrs
- 5.0%
Air-quality risk 2/10 · Minimal
- Unhealthy air days now
- 1 days/yr
- Unhealthy air days in 30 yrs
- 2 days/yr
Risk factors via First Street. Map © Google.
Why this score? — see what drove the D- grade
The composite is a weighted blend of 9 inputs, each scored 0–100. Each bar is that input's sub-score; the figure is the points it added to the 100-point composite (weight × sub-score).
- ARV discount +7.5/15.0
- Cash flow +7.0/30.0
- Appreciation +6.3/10.0
- Livability +3.8/5.0
- Rent growth +3.6/5.0
- Schools +3.4/10.0
- Condition / age +2.5/5.0
- 1% rule +2.2/10.0
- DSCR +1.2/10.0
$295,976
🖨 Deal sheet (PDF) 📄 Offer letter ✓ Due diligence
Listing remarks
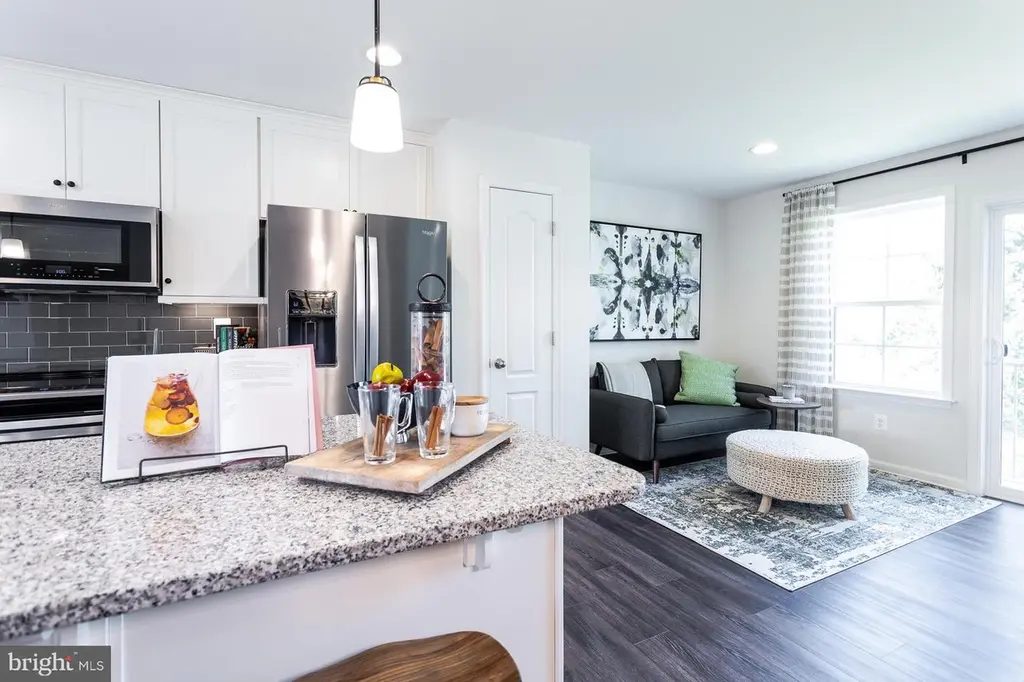
THE BEST VALUE PER SQUARE FOOT IN Charles Town, WV * * * OFFERING UP TO $12,500 IN CLOSING COST ASSISTANCE FOR PRIMARY RESIDENCE WITH USE OF APPROVED LENDER AND TITLE! * * Beautiful York ll TH in a small building of just three units. 3 bedrooms 3.5 bathrooms this home sports lovely quartz countertops, cute pendant lights over the kitchen island, and LVP throughout the whole main level. * Photos may not be of actual home. Photos may be of similar home/floorplan if home is under construction or if this is a base price listing.
Key facts
- $83 HOA
- Garage
- Built 2026
Neighborhood map
What this means for you Summary
Snapshot
- This is a 3-bed/3.5-bath townhouse listed at $296k.
Deal economics
- At list price, monthly cash flow is $-456 ($-5k/yr) — negative.
- To cash-flow at today's rent, offer at most $243k (18.0% below list).
- To meet the 1% rule (rent ≥ 1% of price), the offer needs to be $223k (24.7% below list).
- Recommended offer: $223k (24.7% below list) — sets the bar for 1% rule.
- Cap rate 4.5% vs local median 3.5% in Charles Town — meaningfully above typical; check what's discounted (condition, days-on-market, listing class) to confirm the premium yield is real.
Location & tenants
- Location reads 76/100 on livability (#22 in WV, #3,460 nationally) — a middle-class / working-renter tenant base. Strengths: crime A+, housing A+, health & safety A+; Watch: amenities D+, commute F.
- Jefferson County Schools (rural): math 29% / reading 46% proficiency, ranked #6 of 55 in WV (top 11%) — families likely to look elsewhere, expect single-tenant / working-renter base with shorter leases.
- Zoned schools: Page Jackson Elementary (365 students, 0% FRL); Charles Town Middle School (math 22% / reading 45%, grade F, #40 of 109 statewide, top 37%, 637 students, 0% FRL); Washington High School (math 32% / reading 57%, grade F, #11 of 110 statewide, top 11%, 1,328 students, 0% FRL) — zoned schools average 0% FRL vs 33% district-wide (33 pts lower); this property's tenant base skews higher-income than the district average.
- Market conditions: Rents rising fast (+4.3%/yr); 392 active listings in the ZIP; 14 comparable units currently listed for rent nearby; rentals at typical pace (median 26d on market — plan ~3-4 weeks tenant-placement turnaround); solid renter incomes; 1,162 units permitted in Jefferson County in 2024 (360 in 5+ unit buildings).
Forward outlook
- In year one you build about $10k of equity ($2k loan paydown + $8k appreciation (2.7% local appreciation)).
- Jefferson County population projected at +13% by 2050 — modest demand growth; plan on rents tracking national, not racing it.
- By year 4, paydown + projected appreciation supports a ~$35k cash-out refi (75% LTV) — recoverable capital for the next deal without selling this one.
Negotiation context
- Only 0 days on market — expect competitive offers; lowballing is unlikely to land.
Risks & watch-outs
- Climate carrying-cost: extreme-heat days projected 7→16/yr by 2055 (HVAC capex compounding) — expect insurance premiums to compound above CPI over the hold.
Questions for the listing agent
- What do current leases actually rent for vs. the listed asking? Can we see a recent rent roll and the last 12 months of T-12 income?
- What does the HOA fee cover, when was the last increase, and are there any pending special assessments or reserve-fund shortfalls?
- Is there a deadline driving the sale (1031 exchange, divorce, estate, relocation)? That informs how much negotiation room exists.
- Schools are D-rated, which usually means shorter tenancies and higher turnover. Who's the typical renter profile here, and what's been the actual vacancy rate?
- The area grade is low — what's the realistic commute time and amenity access for the typical tenant pool here? Any planned neighborhood developments (good or bad) we should know about?
- What's the average days-on-market for RENTAL listings here right now (not sales)? A rising rental-DOM trend means longer vacancies and softer asking-rent achievability than the comps imply.
- What's the recent tenant-quality profile in this submarket — average credit score on applications, eviction rate, late-payment / NSF rate, and stable-employment percentage? A property-management company in the area should have these aggregated.
- How much new for-sale + rental construction is in the pipeline within 1–3 miles? Heavy new supply typically softens prices + rents 12–24 months out; constrained supply supports both.
Investment metrics
- 1% rule
- 0.72% ✗
- Cap rate
- 4.52%
- Cash-on-cash
- -6.33%
- DSCR
- 0.72
- GRM
- 11.5
CMA / ARV
- ARV (on-the-fly)
- $308,550
- Comps found
- 12
Show comp detail 12 sales within ~0.75 mi
| Address | Dist | Beds/Ba | Sqft | Sold | Price | $/sf | Match |
|---|---|---|---|---|---|---|---|
| 361 Aragon Dr | 0.04mi | 3/3.5 | 1,674 (+2%) | 0mo | $324,990 | $194 | 95 |
| 369 Aragon Dr | 0.04mi | 3/3.0 | 1,674 (+2%) | 1mo | $303,808 | $181 | 92 |
| 128 Bolingbroke Way | 0.00mi | 3/2.5 | 1,674 (+2%) | 2mo | $311,645 | $186 | 92 |
| 70 Bolingbroke Way | 0.00mi | 3/3.5 | 1,600 (-3%) | 5mo | $299,990 | $187 | 90 |
| 89 Bolingbroke Way | 0.03mi | 3/3.5 | 1,600 (-3%) | 4mo | $287,849 | $180 | 90 |
| 118 Bolingbroke Way | 0.05mi | 3/3.5 | 1,600 (-3%) | 4mo | $302,421 | $189 | 90 |
| 85 Bolingbroke Way | 0.02mi | 3/3.5 | 1,600 (-3%) | 6mo | $293,990 | $184 | 89 |
| 58 Bolingbroke Way | 0.02mi | 3/3.5 | 1,600 (-3%) | 8mo | $305,649 | $191 | 88 |
| 9 Bolingbroke Way | 0.03mi | 3/3.5 | 1,600 (-3%) | 8mo | $298,988 | $187 | 87 |
| 76 Bolingbroke Way | 0.01mi | 4/3.5 (+1) | 1,600 (-3%) | 7mo | $321,819 | $201 | 84 |
| 84 Bolingbroke Way | 0.01mi | 4/3.5 (+1) | 1,600 (-3%) | 7mo | $291,566 | $182 | 84 |
| 97 Bolingbroke Way | 0.03mi | 4/3.5 (+1) | 1,600 (-3%) | 7mo | $304,014 | $190 | 83 |
Match score weights: distance 35% · size 25% · config 20% · recency 20%. Top-matched comps best support the ARV.
Projected returns pro-forma
2.67% appreciation · 4.35% rent growth · sell at horizon
- IRR
- 1.2%
- Equity multiple
- 1.07×
- Total profit
- $6,020
- Equity at exit
- $133,123
- IRR
- 5.7%
- Equity multiple
- 1.85×
- Total profit
- $73,603
- Equity at exit
- $200,895
Cash invested: $86,394 (down + closing). Projections, not guarantees.
Landlord ↔ Tenant lean methodology
- Overall (STATE)
- 83 Strongly Landlord-Friendly
- State West Virginia
- 83 Strongly Landlord-Friendly · R+22
- County
- — inherits STATE
- City
- — inherits STATE
ZIP-level market 25414
- Home prices YoY
- 0.9%
- Rents YoY
- 4.3%
- Active inventory
- 392
- Price-to-rent
- 11.1×
Monthly cashflow live
- Estimated rent
- $2,227 high interval (Pro) →
- Mortgage (P&I)
- −$1,618
- Tax est. 1.5%
- −$386 /mo · $4,628/yr
- Insurance
- −$129
- HOA
- −$83
- Vacancy / Maint / Mgmt
- −$468
- Net cashflow
- $-456
Break-even live
Sensitivity live
| Price | -10% $-242 | -5% $-349 | +0% $-456 | +5% $-562 | +10% $-669 |
|---|---|---|---|---|---|
| Rent | -10% $-632 | -5% $-544 | +0% $-456 | +5% $-368 | +10% $-280 |
| Rate | -1.0pp $-300 | -0.5pp $-377 | base $-456 | +0.5pp $-536 | +1.0pp $-617 |
UW: 25.0% down · 7.5% · 30yr · 1.5% tax · 5.0% vac · 8.0% maint · 8.0% mgmt
Financing live
Cash to close
- Down payment
- $77,138
- Closing costs
- $9,256
- Reserves months
- —
- Total cash needed
- —
Loan-product check · same deal, 3 products live
Conventional
25% down · 7.5% · 30yr
- Down + closing
- —
- Monthly P&I
- —
- Monthly cashflow
- —
- DSCR
- —
- Eligible?
- —
Personal DTI + credit; lowest rate.
DSCR
20% down · 8.5% · 30yr
- Down + closing
- —
- Monthly P&I
- —
- Monthly cashflow
- —
- DSCR
- —
- Eligible?
- —
No personal income docs; deal must DSCR.
Hard money
10% down · 12.0% · 12mo
- Down + closing
- —
- Monthly P&I
- —
- Monthly cashflow
- —
- DSCR
- —
- Eligible?
- —
Short-term bridge; refi at stabilization.
Rent comps 14 comps
| Address | Beds | Baths | Sqft | Rent | $/sqft | DOM | Units | Dist |
|---|---|---|---|---|---|---|---|---|
| 27 Towton PL Charles Town, WV | 3.0 | 2.5 | 1550 | $1,995 | $1.29 | 26d | 1 | 0.36mi |
| 114 Telluride Way Charles Town, WV | 3.0 | 2.5 | 1700 | $2,090 | $1.23 | 26d | 1 | 0.59mi |
| 135 Telluride Way Charles Town, WV | 4.0 | 3.5 | 2097 | $2,400 | $1.14 | 26d | 1 | 0.61mi |
| 509 Seeback Dr Charles Town, WV | 3.0 | 2.5 | 1946 | $2,150 | $1.10 | 26d | 1 | 0.62mi |
| 19 Winterplace Dr Charles Town, WV | 4.0 | 3.5 | 2095 | $2,100 | $1.00 | 14d | 1 | 0.66mi |
| 10 Telluride Way Charles Town, WV | 3.0 | 4.0 | 2097 | $2,300 | $1.10 | 26d | 1 | 0.69mi |
| 458 Seeback Dr Charles Town, WV | 3.0 | 2.5 | 1946 | $2,100 | $1.08 | 26d | 1 | 0.80mi |
| 450 Seeback Dr Charles Town, WV | 3.0 | 2.5 | 1793 | $2,050 | $1.14 | 14d | 1 | 0.80mi |
| 439 Seeback Dr Unit 255 Charles Town, WV | 3.0 | 2.5 | 1920 | $2,100 | $1.09 | 22d | 1 | 0.80mi |
| 470 Seeback Dr Charles Town, WV | 3.0 | 2.5 | 1946 | $2,100 | $1.08 | 26d | 1 | 0.80mi |
| 454 Seeback Dr Charles Town, WV | 3.0 | 4.0 | 1952 | $2,100 | $1.08 | 26d | 1 | 0.80mi |
| 478 Seeback Dr Charles Town, WV | 3.0 | 2.5 | 1946 | $2,200 | $1.13 | 22d | 1 | 0.80mi |
| 115 Bell Tower Ln Charles Town, WV | 4.0 | 2.5 | 2223 | $2,600 | $1.17 | 4d | 1 | 1.38mi |
| 214 Gumspring Dr Charles Town, WV | 4.0 | 2.5 | 2148 | $2,500 | $1.16 | 22d | 1 | 1.41mi |
HOA detail
- Monthly dues
- $83 · $996/yr
Listing history 2 events
-
2026-05-11$295,976
-
2026-05-11historical
ⓘ Source: listings_history table (triggers on properties + properties_extension) + one-shot
backfill from property_details.listing_events for pre-trigger history.
Climate risk First Street
- Flood 1/10 Low FEMA zone X (unshaded) · 0% chance over 30 yrs
- Wildfire 1/10 Low
- Heat 5/10 Major 7 d/yr ≥102°F today · 16 d/yr by 30 yrs out
- Wind 3/10 Moderate 5% chance of damaging wind over 30 yrs
- Air quality 2/10 Low 1 unhealthy d/yr today · 2 by 30 yrs out
Nearby sold comps map
Loading sold comps map…
Walkable amenities ~0.75 mi
Loading nearby amenities…
Taxation est. · year 1
- Rental income
- $26,729
- − Mortgage interest
- −$17,284
- − Property taxes
- −$4,628
- − Insurance
- −$1,543
- − Repairs & maintenance
- −$2,138
- − Management
- −$2,138
- − HOA
- −$996
- − Depreciation
- −$8,976
- Taxable loss
- −$10,975
- Est. tax savings @ 24.0%
- +$2,634
- After-tax cash flow
- $-2,834/yr
For passive investors: Depreciation is non-cash, so a rental often shows a tax loss while cash-flowing — sheltering income. Rental losses are passive: they offset passive income freely, and up to $25,000/yr can offset ordinary (W-2) income if you actively participate and your MAGI is under $100k (phasing out to $0 by $150k); unused losses carry forward. On sale, claimed depreciation is recaptured at up to 25%, and gains may owe capital-gains tax (a 1031 exchange can defer both). Figures are a year-1 estimate at your 24.0% rate — not tax advice; consult a CPA.
Schools (NCES district)
- District
- Jefferson County Schools
- NCES district ID
- 5400570
- Math proficiency
- 29% ▼ -13.00%
- Reading proficiency
- 46% ▼ -7.00%
- Median HH income
- $67,038
- Composite
- 33.98/100
- National rank
- #5322
- State rank
- #6 of 55 in WV
Livability — Charles Town
- Score
- 76/100
- State rank
- #22
- US rank
- #3460
Category grades
Schools grade is shown separately in the Schools card above.
Census & demographics
- County
- Jefferson County · 28,403 people
- City population
- 21,073
- Metro
- Washington-Arlington-Alexandria, DC-VA-MD-WV
- Population (ZIP)
- 21,073
- Household income
- $105,500
- Rent vs Own
- Severe rent burden
- 290.0
Population outlook (Jefferson County) Hauer SSP2
- Today (2025)
- 61,715 people
- By 2030
- 64,052 · +3.8%
- By 2040
- 67,713 · +9.7%
- By 2050
- 69,843 · +13.2%
- By 2075
- 72,679 · +17.8%
- By 2100
- 71,872 · +16.5%
Race, ethnicity, and origin ACS 2023
- Neighborhood character
- Predominantly White (78%)
- Race & ethnicity
- White 78% Two or more races 10% Black 7% Hispanic / Latino 7% Asian 1%
- Hispanic origin (detail)
- Mexican 2% Puerto Rican 1%
- Common ancestry
- Romanian 3% Slovak 2% Lithuanian 2%
- Foreign-born
- 5% · Canada, Jamaica
- Languages at home
- 93% English-only · Spanish 5% Other Indo-European 1%
Political lean MEDSL · Jefferson
- 2024 margin
- R (+15.8) · D 41.0% · R 56.8% · Other 2.1%
- 2008→2024 swing
- -20.6pp toward R · 2008: 4.8pp · 2024: -15.8pp
- All cycles
- 2024: R+15.8 2020: R+10.5 2016: R+15.3 2012: R+4.0 2008: D+4.8
Not yet ingested
- Civics
- —
Market trends
- HPI YoY
- ▲ 2.67%
- Current HPI
- 296.8007
- Rent YoY
- ▲ 4.35%
- Metro
- Washington-Arlington-Alexandria, DC-VA-MD-WV
- State GDP YoY
- —
- F500 in state
- 0
Price history
2 events — show timeline
- 2026-05-11 Listing Removed — BRIGHT MLS
- 2026-05-11 Listed $295,976 BRIGHT MLS
Cash-flow waterfall
monthlySold comps — $/sqft
last 12 mo · ≤1 miLoading sold comps…