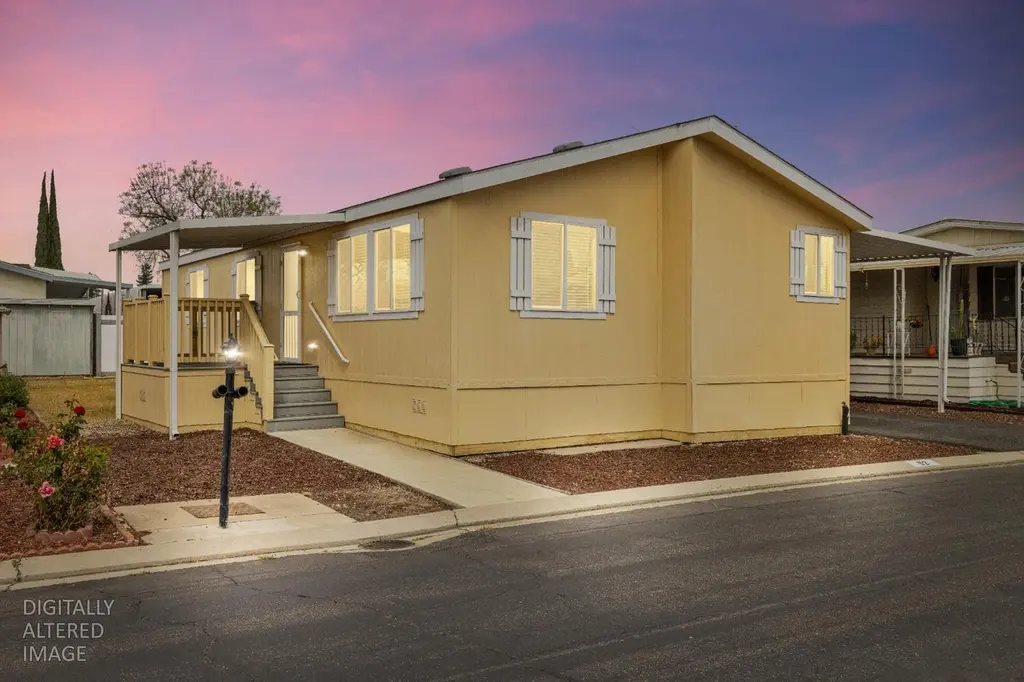
2621 Prescott #92 · Modesto, CA
Flood risk No data
- FEMA flood zone
- —
- Chance of flooding over 30 yrs
- —
- Est. flood insurance / yr
- —
Fire risk No data
- Est. fire insurance / yr
- —
Heat risk No data
- Hot days now (above threshold)
- —
- Hot days in 30 yrs
- —
Wind risk No data
- Chance of severe wind over 30 yrs
- —
Air-quality risk No data
- Unhealthy air days now
- —
- Unhealthy air days in 30 yrs
- —
Risk factors via First Street. Map © Google.
Why this score? — see what drove the C+ grade
The composite is a weighted blend of 9 inputs, each scored 0–100. Each bar is that input's sub-score; the figure is the points it added to the 100-point composite (weight × sub-score).
- Cash flow +30.0/30.0
- 1% rule +10.0/10.0
- DSCR +10.0/10.0
- Condition / age +4.0/5.0
- Livability +3.2/5.0
- Rent growth +3.1/5.0
- Schools +2.6/10.0
- ARV discount +0.0/15.0
- Appreciation +0.0/10.0
$119,000
🖨 Deal sheet (PDF) 📄 Offer letter ✓ Due diligence
Listing remarks
Welcome to easy living in this beautifully updated 3-bedroom, 2-bath modern home located in a desirable senior community designed for comfort, convenience, and lifestyle. Thoughtfully maintained and stylishly refreshed, this spacious residence offers the perfect blend of modern finishes and low-maintenance living.
Key facts
- 2 parking spots
- Built 2017
- Listed 71 days
Property features AI
Finance
- Other: Property is in a park with a listed land lease amount (if applicable to buyer)
- HOA & community: No homeowners association; Located in a senior community; Land lease: No (land lease amount listed separately)
Exterior
- Parking: Assigned parking; Attached parking; Guest parking available
- Utilities: Public sewer; Public water via water district; Internet available; 220-volt outlet in laundry
- Home design: Manufactured home (double wide) located in a park; Original condition; Built in 2017
- Construction: Composition roof; Manufactured construction (HCD)
- Exterior features: Carport awning and porch awning; Storage area and shed(s); Backyard; Close to clubhouse
Interior
- Kitchen: Free-standing gas range; Dishwasher; Microwave; Disposal; Pantry closet; Laminate countertops
- Bedrooms: 3 bedrooms
- Flooring: Carpet; Linoleum; Vinyl
- Bathrooms: 2 full bathrooms; Low-flow showers and toilets; Tub with shower over
- Heating & cooling: Central heating; Central air conditioning; Ceiling fan(s)
- Interior features: Ceiling fans and central air conditioning; Central heating; Dual-pane windows with Low-E glass; Covered deck/porch with railings and porch steps; Open beam ceiling and vaulted/cathedral living area; Pantry closet in kitchen; Laminate countertops; Space for dining in the kitchen; Unfurnished; Pets allowed
- Laundry & utility: Washer and dryer included, located inside
Neighborhood map
What this means for you Summary
Snapshot
- This is a 3-bed/2.0-bath manufactured listed at $119k. Condition is rated good.
Deal economics
- At list price, monthly cash flow is $846 ($10k/yr) — positive.
- The deal already cash-flows at list — no discount required.
- Meets the 1% rule at list price ($2k rent vs $119k).
- Recommended offer: $112k (6.0% below list) — sets the bar for market timing.
- Cap rate 14.8% vs local median 3.2% in Modesto — top-decile yield for the area; either an underpriced asset or a hidden risk that comps aren't pricing in. Stress-test before assuming the spread holds.
Location & tenants
- Location reads 63/100 on livability (#451 in CA) — a middle-class / working-renter tenant base. Strengths: housing A+; Watch: amenities C-, schools D+, health & safety D+.
- Stanislaus Union Elementary (urban): math 24% / reading 35% proficiency, ranked #344 of 517 in CA (top 66%) — low school quality limits family demand, transient renter base, plan for 1-2y turnover.
- Market conditions: Rents rising (+2.2%/yr); 164 active listings in the ZIP; 29 comparable units currently listed for rent nearby; rentals at typical pace (median 15d on market — plan ~3-4 weeks tenant-placement turnaround); solid renter incomes; 923 units permitted in Stanislaus County in 2024 (63 in 5+ unit buildings).
- This rent runs 34% of the median local income ($76k/yr) — at the standard rent-burdened threshold; future hikes will face affordability resistance.
Forward outlook
- Local home prices are declining (-3.0%/yr); year-one equity from $823 of loan paydown is wiped out by about $4k of value loss. Plan a longer hold.
- Stanislaus County population projected at +14% by 2050 — modest demand growth; plan on rents tracking national, not racing it.
- At projected returns (-3.0% appreciation + 2.2% rent growth), your $33k cash investment doubles in ~5 years — after that, you're playing with house money.
Negotiation context
- It's been on market 71 days — a 6% lower offer ($112k) is reasonable based on typical stale-listing flexibility.
Questions for the listing agent
- It's been on market 71 days. Have you received any prior offers? Is the seller open to a 6% concession, seller financing, or rate buy-down credit?
- Why hasn't it sold? Are there any deal-killer items the seller is aware of (foundation, flood, title, zoning, code violations)?
- Is there a deadline driving the sale (1031 exchange, divorce, estate, relocation)? That informs how much negotiation room exists.
- Schools are D-rated, which usually means shorter tenancies and higher turnover. Who's the typical renter profile here, and what's been the actual vacancy rate?
- Crime grade is F in this area — have there been break-ins, vandalism, or insurance claims at this property in the last 3 years? What carrier currently insures it and at what premium?
- What's the average days-on-market for RENTAL listings here right now (not sales)? A rising rental-DOM trend means longer vacancies and softer asking-rent achievability than the comps imply.
- What's the recent tenant-quality profile in this submarket — average credit score on applications, eviction rate, late-payment / NSF rate, and stable-employment percentage? A property-management company in the area should have these aggregated.
- How much new for-sale + rental construction is in the pipeline within 1–3 miles? Heavy new supply typically softens prices + rents 12–24 months out; constrained supply supports both.
Investment metrics
- 1% rule
- 1.77% ✓
- Cap rate
- 14.82%
- Cash-on-cash
- 30.45%
- DSCR
- 2.35
- GRM
- 4.7
CMA / ARV
- ARV (on-the-fly)
- $81,600
- Comps found
- 12
Show comp detail 12 sales within ~0.75 mi
| Address | Dist | Beds/Ba | Sqft | Sold | Price | $/sf | Match |
|---|---|---|---|---|---|---|---|
| 2621 Prescott Rd #37 | 0.10mi | 2/2.0 (-1) | 1,164 (-3%) | 1mo | $70,500 | $61 | 85 |
| 2621 Prescott Rd #187 | 0.10mi | 3/2.0 | 1,248 (+4%) | 7mo | $125,000 | $100 | 83 |
| 2621 Prescott Rd #29 | 0.10mi | 2/2.0 (-1) | 1,152 (-4%) | 8mo | $85,000 | $74 | 77 |
| 2621 Prescott Rd #115 | 0.10mi | 2/2.0 (-1) | 1,248 (+4%) | 10mo | $85,000 | $68 | 76 |
| 2621 Prescott Rd #163 | 0.08mi | 2/2.0 (-1) | 1,120 (-7%) | 10mo | $119,000 | $106 | 72 |
| 2621 Prescott Rd #262 | 0.08mi | 2/2.0 (-1) | 1,344 (+12%) | 2mo | $69,000 | $51 | 70 |
| 2621 Prescott Rd #106 | 0.15mi | 2/2.0 (-1) | 1,344 (+12%) | 1mo | $71,500 | $53 | 68 |
| 2125 Festival Ln | 0.20mi | 3/2.0 | 1,344 (+12%) | 9mo | $285,000 | $212 | 63 |
| 2621 Prescott Rd #128 | 0.14mi | 2/2.0 (-1) | 1,344 (+12%) | 10mo | $60,000 | $45 | 60 |
| 2129 Viking Ln | 0.29mi | 2/2.0 (-1) | 1,344 (+12%) | 2mo | $205,000 | $153 | 60 |
| 2621 Prescott #111 | 0.14mi | 2/2.0 (-1) | 1,368 (+14%) | 6mo | $60,000 | $44 | 60 |
| 2621 Prescott Rd #188 | 0.14mi | 2/1.0 (-1) | 1,056 (-12%) | 7mo | $70,000 | $66 | 58 |
Match score weights: distance 35% · size 25% · config 20% · recency 20%. Top-matched comps best support the ARV.
Projected returns pro-forma
-3.0% appreciation · 2.25% rent growth · sell at horizon
- IRR
- 24.3%
- Equity multiple
- 1.99×
- Total profit
- $33,023
- Equity at exit
- $17,743
- IRR
- 31.6%
- Equity multiple
- 3.76×
- Total profit
- $91,841
- Equity at exit
- $10,289
Cash invested: $33,320 (down + closing). Projections, not guarantees.
Landlord ↔ Tenant lean methodology
- Overall (STATE)
- 18 Strongly Tenant-Friendly
- State California
- 18 Strongly Tenant-Friendly · D+13
- County
- — inherits STATE
- City
- — inherits STATE
ZIP-level market 95350
- Rents YoY
- 2.2%
- Active inventory
- 164
- Price-to-rent
- 4.7×
Monthly cashflow live
- Estimated rent
- $2,111 high interval (Pro) →
- Mortgage (P&I)
- −$624
- Tax est. 1.5%
- −$149 /mo · $1,785/yr
- Insurance
- −$50
- HOA
- −$0
- Vacancy / Maint / Mgmt
- −$443
- Net cashflow
- $846
Break-even live
Sensitivity live
| Price | -10% $928 | -5% $887 | +0% $846 | +5% $804 | +10% $763 |
|---|---|---|---|---|---|
| Rent | -10% $679 | -5% $762 | +0% $846 | +5% $929 | +10% $1,012 |
| Rate | -1.0pp $906 | -0.5pp $876 | base $846 | +0.5pp $815 | +1.0pp $783 |
UW: 25.0% down · 7.5% · 30yr · 1.5% tax · 5.0% vac · 8.0% maint · 8.0% mgmt
Financing live
Cash to close
- Down payment
- $29,750
- Closing costs
- $3,570
- Reserves months
- —
- Total cash needed
- —
Loan-product check · same deal, 3 products live
Conventional
25% down · 7.5% · 30yr
- Down + closing
- —
- Monthly P&I
- —
- Monthly cashflow
- —
- DSCR
- —
- Eligible?
- —
Personal DTI + credit; lowest rate.
DSCR
20% down · 8.5% · 30yr
- Down + closing
- —
- Monthly P&I
- —
- Monthly cashflow
- —
- DSCR
- —
- Eligible?
- —
No personal income docs; deal must DSCR.
Hard money
10% down · 12.0% · 12mo
- Down + closing
- —
- Monthly P&I
- —
- Monthly cashflow
- —
- DSCR
- —
- Eligible?
- —
Short-term bridge; refi at stabilization.
Rent comps 29 comps
| Address | Beds | Baths | Sqft | Rent | $/sqft | DOM | Units | Dist |
|---|---|---|---|---|---|---|---|---|
| 2120 Chrysler Dr Modesto, CA | 2.0 | 1.0 | 850 | $1,695 | $1.99 | 14d | 1 | 0.22mi |
| 2140 Palisade Ave #4 Modesto, CA | 2.0 | 1.0 | 924 | $1,850 | $2.00 | 14d | 1 | 0.30mi |
| 2112 Eicher Ave Modesto, CA | 2.0 | 1.0 | 1100 | $1,995 | $1.81 | 14d | 1 | 0.38mi |
| 1808 W Rumble Rd Modesto, CA | 2.0 | 2.0 | 1000 | $1,800 | $1.80 | 14d | 1 | 0.40mi |
| 1712 Applegate Dr Modesto, CA | 3.0 | 2.0 | 1120 | $2,595 | $2.32 | 14d | 1 | 0.47mi |
| 2531 W Rumble Rd Unit 16 Modesto, CA | 2.0 | 2.0 | 891 | $1,795 | $2.01 | 14d | 1 | 0.53mi |
| 2531 W Rumble Rd Unit 13 Modesto, CA | 2.0 | 2.0 | 887 | $1,825 | $2.06 | 14d | 1 | 0.53mi |
| 3500 Shawnee Dr Modesto, CA | 2.0 | 2.0 | 1100 | $2,100 | $1.91 | 14d | 1 | 0.68mi |
| 3601 Prescott Rd Modesto, CA | 1.0–2.0 | 1.0–2.0 | 798 | $2,075 | $2.60 | 12d | 1 | 0.71mi |
| 2404 Strivens Ave Modesto, CA | 3.0 | 1.0 | 1200 | $2,498 | $2.08 | 14d | 1 | 0.72mi |
| 1809 La Corunna Pl Modesto, CA | 2.0 | 3.0 | 1300 | $2,100 | $1.62 | 14d | 1 | 0.73mi |
| 2020 Cheyenne Way Modesto, CA | 1.0–2.0 | 1.0–2.0 | 783 | $1,825 | $2.33 | 4d | 2 | 0.77mi |
| 2821 Lou Ann Dr Modesto, CA | 2.0 | 1.5–2.0 | 1035 | $2,150 | $2.08 | 12d | 3 | 0.78mi |
| 2213 Camborne Dr Unit 1 Modesto, CA | 2.0 | 2.0 | 1220 | $2,395 | $1.96 | 24d | 1 | 0.78mi |
| 1713 Randazzo Ave Unit 1713 Modesto, CA | 2.0 | 2.0 | 960 | $1,895 | $1.97 | 14d | 1 | 0.80mi |
| 3200 Hahn Dr Modesto, CA | 2.0–3.0 | 2.0–2.5 | 1262 | $2,631 | $2.08 | 4d | 5 | 0.81mi |
| 2900 W Rumble Rd Modesto, CA | 2.0 | 2.0 | 936 | $1,795 | $1.92 | 11d | 1 | 0.89mi |
| 2800 Braden Ave Modesto, CA | 1.0–2.0 | 1.0–2.0 | 779 | $1,960 | $2.52 | 3d | 9 | 0.90mi |
| 1712 Carver Rd Modesto, CA | 1.0–2.0 | 1.0 | 704 | $1,825 | $2.59 | 14d | 4 | 0.98mi |
| 3401 Tully Rd Modesto, CA | 2.0 | 2.0 | 1024 | $2,095 | $2.05 | 14d | 2 | 1.14mi |
| 3600 Dale Rd Unit 1 Modesto, CA | 2.0 | 1.5 | 935 | $2,100 | $2.25 | 4d | 1 | 1.16mi |
| 3600 Dale Rd Modesto, CA | 2.0 | 1.0 | 935 | $2,100 | $2.25 | 12d | 1 | 1.16mi |
| 1701 Linwood Dr Modesto, CA | 3.0 | 2.0 | 1499 | $2,050 | $1.37 | 14d | 1 | 1.17mi |
| 3445 Colonial Dr Modesto, CA | 1.0–2.0 | 1.0 | 918 | $2,295 | $2.50 | 14d | 10 | 1.33mi |
| 3820 Gareth Ln Apt C Modesto, CA | 2.0 | 2.0 | 1100 | $1,895 | $1.72 | 14d | 1 | 1.35mi |
| 3701 Colonial Dr #154 Modesto, CA | 2.0 | 1.5 | 978 | $1,950 | $1.99 | 14d | 1 | 1.43mi |
| 1506 W Orangeburg Ave Unit 1506 Modesto, CA | 2.0 | 1.0 | 780 | $1,600 | $2.05 | 14d | 1 | 1.44mi |
| 3905 Dale Rd Unit B Modesto, CA | 2.0 | 2.0 | 1020 | $1,750 | $1.72 | 4d | 1 | 1.47mi |
| 1010 Bowen Ave Modesto, CA | 2.0 | 1.0 | 940 | $1,750 | $1.86 | 14d | 1 | 1.47mi |
Listing history 14 events
-
2026-06-17status $119,000 Pending 71 DOM
-
2026-06-16days on market $119,000 Active 71 DOM
-
2026-06-15days on market $119,000 Active 70 DOM
-
2026-06-14days on market $119,000 Active 68 DOM
-
2026-06-13days on market $119,000 Active 67 DOM
-
2026-06-10days on market $119,000 Active 65 DOM
-
2026-06-09days on market $119,000 Active 64 DOM
-
2026-06-08days on market $119,000 Active 63 DOM
-
2026-06-07days on market $119,000 Active 62 DOM
-
2026-06-03days on market $119,000 Active 58 DOM
-
2026-06-02days on market $119,000 Active 57 DOM
-
2026-06-01days on market $119,000 Active 56 DOM
-
2026-05-31days on market $119,000 Active 55 DOM
-
2026-05-30pricedays on market $119,000 Active 54 DOM
ⓘ Source: listings_history table (triggers on properties + properties_extension) + one-shot
backfill from property_details.listing_events for pre-trigger history.
Nearby sold comps map
Loading sold comps map…
Walkable amenities ~0.75 mi
Loading nearby amenities…
Taxation est. · year 1
- Rental income
- $25,336
- − Mortgage interest
- −$6,666
- − Property taxes
- −$1,785
- − Insurance
- −$595
- − Repairs & maintenance
- −$2,027
- − Management
- −$2,027
- − Depreciation
- −$3,462
- Taxable income
- $8,775
- Est. tax owed @ 24.0%
- −$2,106
- After-tax cash flow
- $8,041/yr
For passive investors: Depreciation is non-cash, so a rental often shows a tax loss while cash-flowing — sheltering income. Rental losses are passive: they offset passive income freely, and up to $25,000/yr can offset ordinary (W-2) income if you actively participate and your MAGI is under $100k (phasing out to $0 by $150k); unused losses carry forward. On sale, claimed depreciation is recaptured at up to 25%, and gains may owe capital-gains tax (a 1031 exchange can defer both). Figures are a year-1 estimate at your 24.0% rate — not tax advice; consult a CPA.
Condition & rehab AI · 13 photos
This well-maintained mobile home is in good condition with fresh updates, making it a great investment for both resale and rental.
Value-add opportunities
- Both Paint exterior — Fresh paint enhances curb appeal and value
- Both Replace carpet — New carpet would improve comfort and appearance
- Both Update flooring in kitchen and bathrooms — Modern flooring would enhance the home's aesthetic and value
Renovation cost estimate screening
Value-add ROI direction
- Both Paint exterior — Fresh paint enhances curb appeal and value ↑
- Both Replace carpet — New carpet would improve comfort and appearance ↑
- Both Update flooring in kitchen and bathrooms — Modern flooring would enhance the home's aesthetic and value ↑
ⓘ Cost ranges are severity-bucket heuristics (US national rule-of-thumb). Get contractor quotes + a written scope before underwriting a rehab budget.
Schools (NCES district)
- District
- Stanislaus Union Elementary
- NCES district ID
- 0637950
- Math proficiency
- 24% ▼ -14.00%
- Reading proficiency
- 35% ▼ -12.00%
- Median HH income
- $53,731
- Composite
- 26.11/100
- National rank
- #7286
- State rank
- #344 of 517 in CA
Livability — Modesto
- Score
- 63/100
- State rank
- #451
- US rank
- #15229
Category grades
Schools grade is shown separately in the Schools card above.
Census & demographics
- Census place
- Modesto, CA
- County
- Stanislaus County · 445,786 people
- City population
- 225,261
- Metro
- Modesto, CA
- Population (ZIP)
- 57,136
- Household income
- $75,621
- Rent vs Own
- Severe rent burden
- 2163.0
Population outlook (Stanislaus County) Hauer SSP2
- Today (2025)
- 579,493 people
- By 2030
- 598,000 · +3.2%
- By 2040
- 630,930 · +8.9%
- By 2050
- 658,300 · +13.6%
- By 2075
- 712,363 · +22.9%
- By 2100
- 719,805 · +24.2%
Race, ethnicity, and origin ACS 2023
- Neighborhood character
- Diverse neighborhood (Simpson 0.64)
- Race & ethnicity
- White 45% Hispanic / Latino 39% Two or more races 19% Asian 6% Black 5% Native American 2%
- Hispanic origin (detail)
- Mexican 35%
- Common ancestry
- Russian 3% Slovak 2% Portuguese 1%
- Foreign-born
- 14% · Canada, Vietnam
- Languages at home
- 70% English-only · Spanish 23% Other Indo-European 3% Other Asian/Pacific 1%
Political lean MEDSL · Stanislaus
- 2024 margin
- R (+11.0) · D 43.2% · R 54.2% · Other 2.6%
- 2008→2024 swing
- -12.7pp toward R · 2008: 1.7pp · 2024: -11.0pp
- All cycles
- 2024: R+11.0 2020: D+0.8 2016: D+0.6 2012: D+0.7 2008: D+1.7
Not yet ingested
- Civics
- —
Market trends
- HPI YoY
- ▼ -555.05%
- Current HPI
- 307.9532
- Rent YoY
- ▲ 2.25%
- Metro
- Modesto, CA
- State GDP YoY
- ▲ 3.21%
- F500 in state
- 116
Industry mix (Fortune 500 HQ in CA)
| Industry | F500 HQs | Revenue |
|---|---|---|
| Technology | 27 | $1,492B |
|
||
| Financial Services | 3 | $174B |
|
||
| Retail | 3 | $44B |
|
||
| Insurance | 3 | $26B |
|
||
| Media / Entertainment | 2 | $115B |
|
||
| Pharmaceuticals / Biotech | 2 | $62B |
|
||
Cash-flow waterfall
monthlySold comps — $/sqft
last 12 mo · ≤1 miLoading sold comps…