156 Navajo Trl · Gumlog, GA
Flood risk 1/10 · Minimal
- FEMA flood zone
- X (unshaded)
- Chance of flooding over 30 yrs
- 0.0%
- Est. flood insurance / yr
- $507 – $1,088
Fire risk 4/10 · Minor
- Est. fire insurance / yr
- $963 – $1,789
Heat risk 5/10 · Moderate
- Hot days now (above 105°F)
- 7 days/yr
- Hot days in 30 yrs
- 17 days/yr
Wind risk 2/10 · Minimal
- Chance of severe wind over 30 yrs
- 3.0%
Air-quality risk 4/10 · Minor
- Unhealthy air days now
- 4 days/yr
- Unhealthy air days in 30 yrs
- 5 days/yr
Risk factors via First Street. Map © Google.
Why this score? — see what drove the B+ grade
The composite is a weighted blend of 9 inputs, each scored 0–100. Each bar is that input's sub-score; the figure is the points it added to the 100-point composite (weight × sub-score).
- Cash flow +26.3/30.0
- ARV discount +15.0/15.0
- Appreciation +10.0/10.0
- DSCR +8.9/10.0
- 1% rule +7.1/10.0
- Livability +3.3/5.0
- Schools +2.8/10.0
- Rent growth +2.5/5.0
- Condition / age +2.5/5.0
$110,000
🖨 Deal sheet (PDF) 📄 Offer letter ✓ Due diligence
Listing remarks MLS
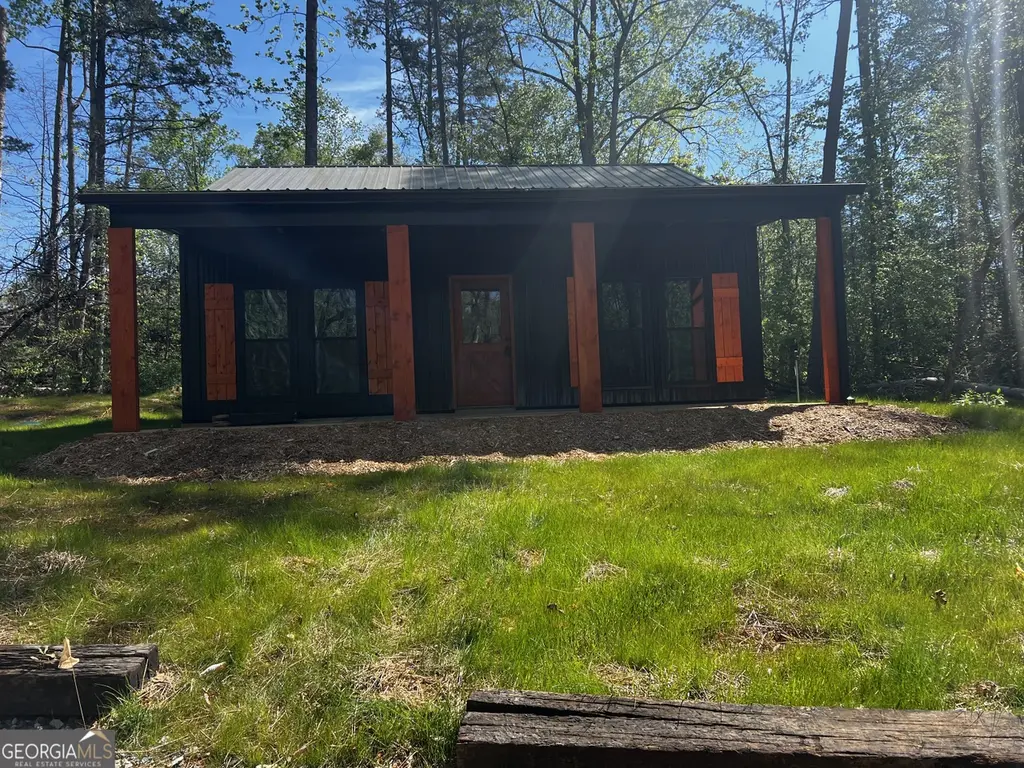
Investors/DIY, 2BR 2BA Barndo that has been completed on the outside. Septic and water has been installed. Rough-in plumbing has been done. Lake community with access to Pavillion, Dock and Boat Ramp! This one is a blank canvas for your vision!
Key facts
- 0.29 acre lot
- Built 2026
- Listed 234 days
Neighborhood map
What this means for you Summary
Snapshot
- This is a 2-bed/2.0-bath other listed at $110k.
Deal economics
- At list price, monthly cash flow is $284 ($3k/yr) — positive.
- The deal already cash-flows at list — no discount required.
- Meets the 1% rule at list price ($1k rent vs $110k).
- Recommended offer: $97k (12.0% below list) — sets the bar for market timing.
- Cap rate 9.4% vs local median 2.7% in Gumlog — top-decile yield for the area; either an underpriced asset or a hidden risk that comps aren't pricing in. Stress-test before assuming the spread holds.
Location & tenants
- Location reads 66/100 on livability (#185 in GA) — a middle-class / working-renter tenant base. Strengths: crime A+, cost of living A+, housing A+; Watch: amenities F, commute F, health & safety F.
- Stephens County (rural): math 34% / reading 34% proficiency, ranked #74 of 174 in GA (top 42%) — families likely to look elsewhere, expect single-tenant / working-renter base with shorter leases.
- Zoned schools: Liberty Elementary School (567 students, 75% FRL); Stephens County Middle School (math 29% / reading 31%, grade F, #243 of 470 statewide, top 53%, 860 students, 75% FRL); Stephens County High School (math 18% / reading 34%, grade F, #175 of 424 statewide, top 42%, 1,142 students, 46% FRL).
- Market conditions: 125 active listings in the ZIP; 52 units permitted in Stephens County in 2024 (0 in 5+ unit buildings).
Forward outlook
- In year one you build about $12k of equity ($761 loan paydown + $11k appreciation (10.0% local appreciation)).
- Stephens County population projected at -21% by 2050 — secular population decline; favor cash flow + early exit over multi-decade hold.
- At projected returns (10.0% appreciation + 3.0% rent growth), your $31k cash investment doubles in ~2 years — after that, you're playing with house money.
- By year 4, paydown + projected appreciation supports a ~$42k cash-out refi (75% LTV) — recoverable capital for the next deal without selling this one.
Negotiation context
- It's been on market 235 days — a 12% lower offer ($97k) is reasonable based on typical stale-listing flexibility.
- 4 sale attempts since 5y ago; this cycle's ask has dropped $15k (12%) from the opening price — seller is motivated, your offer sets the floor, not the list.
- Current owner paid $8k; list at $110k implies a 1367% gain — meaningful room to come down on a strong offer.
Risks & watch-outs
- Climate carrying-cost: extreme-heat days projected 7→17/yr by 2055 (HVAC capex compounding) — expect insurance premiums to compound above CPI over the hold.
Questions for the listing agent
- It's been on market 235 days. Have you received any prior offers? Is the seller open to a 12% concession, seller financing, or rate buy-down credit?
- What does the HOA fee cover, when was the last increase, and are there any pending special assessments or reserve-fund shortfalls?
- Why hasn't it sold? Are there any deal-killer items the seller is aware of (foundation, flood, title, zoning, code violations)?
- Is there a deadline driving the sale (1031 exchange, divorce, estate, relocation)? That informs how much negotiation room exists.
- Schools are F-rated, which usually means shorter tenancies and higher turnover. Who's the typical renter profile here, and what's been the actual vacancy rate?
- What's the average days-on-market for RENTAL listings here right now (not sales)? A rising rental-DOM trend means longer vacancies and softer asking-rent achievability than the comps imply.
- What's the recent tenant-quality profile in this submarket — average credit score on applications, eviction rate, late-payment / NSF rate, and stable-employment percentage? A property-management company in the area should have these aggregated.
- How much new for-sale + rental construction is in the pipeline within 1–3 miles? Heavy new supply typically softens prices + rents 12–24 months out; constrained supply supports both.
Investment metrics
- 1% rule
- 1.21% ✓
- Cap rate
- 9.39%
- Cash-on-cash
- 11.07%
- DSCR
- 1.49
- GRM
- 6.9
CMA / ARV
- ARV (median comp)
- $187,066
- List price
- $110,000
- Delta
- -41.20%
- Verdict
- UNDERPRICED
- Comps
- 19 within 1.0 mi
Projected returns pro-forma
10.0% appreciation · 3.0% rent growth · sell at horizon
- IRR
- 32.4%
- Equity multiple
- 3.53×
- Total profit
- $78,027
- Equity at exit
- $99,097
- IRR
- 28.0%
- Equity multiple
- 8.00×
- Total profit
- $215,590
- Equity at exit
- $213,706
Cash invested: $30,800 (down + closing). Projections, not guarantees.
Landlord ↔ Tenant lean methodology
- Overall (STATE)
- 90 Strongly Landlord-Friendly
- State Georgia
- 90 Strongly Landlord-Friendly · R+3
- County
- — inherits STATE
- City
- — inherits STATE
ZIP-level market 30557
- Home prices YoY
- 5.6%
- Active inventory
- 125
- Price-to-rent
- 6.9×
Monthly cashflow live
- Estimated rent
- $1,327 medium interval (Pro) →
- Mortgage (P&I)
- −$577
- Tax est. 1.5%
- −$138 /mo · $1,650/yr
- Insurance
- −$46
- HOA
- −$4
- Vacancy / Maint / Mgmt
- −$279
- Net cashflow
- $284
Break-even live
Sensitivity live
| Price | -10% $360 | -5% $322 | +0% $284 | +5% $246 | +10% $208 |
|---|---|---|---|---|---|
| Rent | -10% $179 | -5% $232 | +0% $284 | +5% $337 | +10% $389 |
| Rate | -1.0pp $340 | -0.5pp $312 | base $284 | +0.5pp $256 | +1.0pp $227 |
UW: 25.0% down · 7.5% · 30yr · 1.5% tax · 5.0% vac · 8.0% maint · 8.0% mgmt
Financing live
Cash to close
- Down payment
- $27,500
- Closing costs
- $3,300
- Reserves months
- —
- Total cash needed
- —
Loan-product check · same deal, 3 products live
Conventional
25% down · 7.5% · 30yr
- Down + closing
- —
- Monthly P&I
- —
- Monthly cashflow
- —
- DSCR
- —
- Eligible?
- —
Personal DTI + credit; lowest rate.
DSCR
20% down · 8.5% · 30yr
- Down + closing
- —
- Monthly P&I
- —
- Monthly cashflow
- —
- DSCR
- —
- Eligible?
- —
No personal income docs; deal must DSCR.
Hard money
10% down · 12.0% · 12mo
- Down + closing
- —
- Monthly P&I
- —
- Monthly cashflow
- —
- DSCR
- —
- Eligible?
- —
Short-term bridge; refi at stabilization.
HOA detail
- Monthly dues
- $4 · $48/yr
- Likely covers
- water
Listing history 28 events
-
2026-06-21days on market $110,000 Active 235 DOM
-
2026-06-19days on market $110,000 Active 233 DOM
-
2026-06-18days on market $110,000 Active 232 DOM
-
2026-06-17days on market $110,000 Active 231 DOM
-
2026-06-16days on market $110,000 Active 230 DOM
-
2026-06-15days on market $110,000 Active 229 DOM
-
2026-06-14days on market $110,000 Active 227 DOM
-
2026-06-12days on market $110,000 Active 226 DOM
-
2026-06-09days on market $110,000 Active 223 DOM
-
2026-06-08days on market $110,000 Active 222 DOM
-
2026-06-07days on market $110,000 Active 221 DOM
-
2026-06-07days on market $110,000 Active 220 DOM
-
2026-06-03days on market $110,000 Active 217 DOM
-
2026-06-02days on market $110,000 Active 216 DOM
-
2026-06-01days on market $110,000 Active 215 DOM
-
2026-05-31days on market $110,000 Active 214 DOM
-
2026-05-31days on market $110,000 Active 213 DOM
-
2026-04-21price $110,000 244-char remark
Show marketing remark (244 chars)
Investors/DIY, 2BR 2BA Barndo that has been completed on the outside. Septic and water has been installed. Rough-in plumbing has been done. Lake community with access to Pavillion, Dock and Boat Ramp! This one is a blank canvas for your vision!
-
2025-10-29historical
-
2025-10-02price $115,000
-
2025-08-25$115,000 New 244-char remark
Show marketing remark (244 chars)
Investors/DIY, 2BR 2BA Barndo that has been completed on the outside. Septic and water has been installed. Rough-in plumbing has been done. Lake community with access to Pavillion, Dock and Boat Ramp! This one is a blank canvas for your vision!
-
2025-08-25$125,000 New
Show marketing remark (244 chars)
Investors/DIY, 2BR 2BA Barndo that has been completed on the outside. Septic and water has been installed. Rough-in plumbing has been done. Lake community with access to Pavillion, Dock and Boat Ramp! This one is a blank canvas for your vision!
-
2023-06-30soldstatus $7,500 Sold
-
2023-06-05status Under Contract
-
2022-08-30status Price Change
-
2022-08-30price $8,000
-
2022-08-20historical
-
2021-08-20$10,500 New
ⓘ Source: listings_history table (triggers on properties + properties_extension) + one-shot
backfill from property_details.listing_events for pre-trigger history.
Climate risk First Street
- Flood 1/10 Low FEMA zone X (unshaded) · 0% chance over 30 yrs
- Wildfire 4/10 Moderate
- Heat 5/10 Major 7 d/yr ≥105°F today · 17 d/yr by 30 yrs out
- Wind 2/10 Low 3% chance of damaging wind over 30 yrs
- Air quality 4/10 Moderate 4 unhealthy d/yr today · 5 by 30 yrs out
Nearby sold comps map
Loading sold comps map…
Walkable amenities ~0.75 mi
Loading nearby amenities…
Taxation est. · year 1
- Rental income
- $15,924
- − Mortgage interest
- −$6,162
- − Property taxes
- −$1,650
- − Insurance
- −$550
- − Repairs & maintenance
- −$1,274
- − Management
- −$1,274
- − HOA
- −$48
- − Depreciation
- −$3,200
- Taxable income
- $1,766
- Est. tax owed @ 24.0%
- −$424
- After-tax cash flow
- $2,986/yr
For passive investors: Depreciation is non-cash, so a rental often shows a tax loss while cash-flowing — sheltering income. Rental losses are passive: they offset passive income freely, and up to $25,000/yr can offset ordinary (W-2) income if you actively participate and your MAGI is under $100k (phasing out to $0 by $150k); unused losses carry forward. On sale, claimed depreciation is recaptured at up to 25%, and gains may owe capital-gains tax (a 1031 exchange can defer both). Figures are a year-1 estimate at your 24.0% rate — not tax advice; consult a CPA.
Schools (NCES district)
- District
- Stephens County
- NCES district ID
- 1304560
- Math proficiency
- 34% ▼ -6.00%
- Reading proficiency
- 34% ▼ -4.00%
- Median HH income
- $38,416
- Composite
- 28.42/100
- National rank
- #6759
- State rank
- #74 of 174 in GA
Livability — Gumlog
- Score
- 66/100
- State rank
- #185
- US rank
- #11633
Category grades
Schools grade is shown separately in the Schools card above.
Census & demographics
- Population (ZIP)
- 4,905
Population outlook (Stephens County) Hauer SSP2
- Today (2025)
- 23,797 people
- By 2030
- 22,785 · -4.3%
- By 2040
- 20,653 · -13.2%
- By 2050
- 18,745 · -21.2%
- By 2075
- 14,780 · -37.9%
- By 2100
- 11,079 · -53.4%
Race, ethnicity, and origin ACS 2023
- Neighborhood character
- Predominantly White (87%)
- Race & ethnicity
- White 87% Black 8% Two or more races 4%
- Common ancestry
- Italian 5% Serbian 2% Iranian 1%
- Foreign-born
- 0%
- Languages at home
- 99% English-only · French/Haitian/Cajun 1%
Political lean MEDSL · Stephens
- 2024 margin
- Solid R (+62.8) · D 18.4% · R 81.2%
- 2008→2024 swing
- -15.4pp toward R · 2008: -47.4pp · 2024: -62.8pp
- All cycles
- 2024: R+62.8 2020: R+58.7 2016: R+59.9 2012: R+53.7 2008: R+47.4
Not yet ingested
- Civics
- —
Market trends
- HPI YoY
- ▲ 18.48%
- Current HPI
- 350.6536
- Rent YoY
- —
- Metro
- —
- State GDP YoY
- ▲ 2.66%
- F500 in state
- 28
Industry mix (Fortune 500 HQ in GA)
| Industry | F500 HQs | Revenue |
|---|---|---|
| Paper / Packaging | 2 | $29B |
|
||
| Retail | 1 | $160B |
|
||
| Transportation / Logistics | 1 | $91B |
|
||
| Airlines | 1 | $62B |
|
||
| Consumer Goods | 1 | $47B |
|
||
| Utilities | 1 | $25B |
|
||
Price history
+947.6% since first listed11 events — show timeline
- 2026-04-21 Price Changed $110,000 GAMLS
- 2025-10-29 Listing Removed — GAMLS
- 2025-10-02 Price Changed $115,000 GAMLS
- 2025-08-25 Listed $125,000 GAMLS
- 2025-08-25 Listed $115,000 GAMLS
- 2023-06-30 Sold (MLS) $7,500 GAMLS
- 2023-06-05 Pending — GAMLS
- 2022-08-30 Relisted — GAMLS
- 2022-08-30 Price Changed $8,000 GAMLS
- 2022-08-20 Listing Removed — GAMLS
- 2021-08-20 Listed $10,500 GAMLS
Property tax history
-1.7%/yrLatest (2025): $20 · -5.7% YoY. Source: county tax records.
Cash-flow waterfall
monthlySold comps — $/sqft
last 12 mo · ≤1 miLoading sold comps…