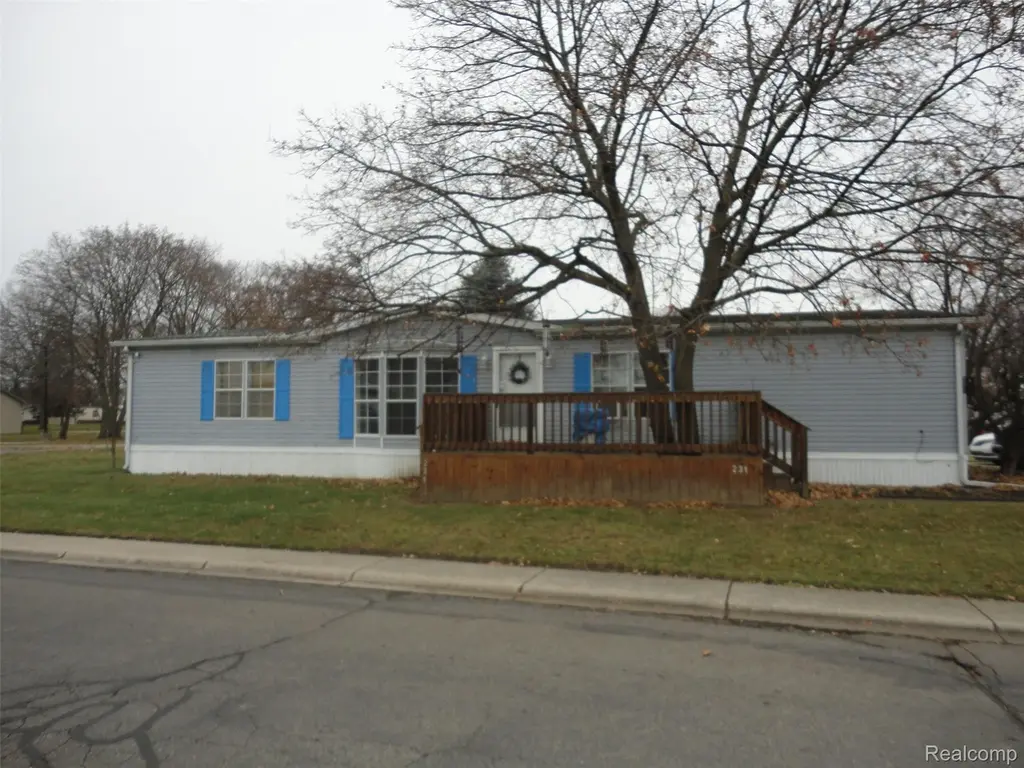
231 Briarwood Trl · Monroe, MI
Flood risk No data
- FEMA flood zone
- —
- Chance of flooding over 30 yrs
- —
- Est. flood insurance / yr
- —
Fire risk No data
- Est. fire insurance / yr
- —
Heat risk No data
- Hot days now (above threshold)
- —
- Hot days in 30 yrs
- —
Wind risk No data
- Chance of severe wind over 30 yrs
- —
Air-quality risk No data
- Unhealthy air days now
- —
- Unhealthy air days in 30 yrs
- —
Risk factors via First Street. Map © Google.
Why this score? — see what drove the C+ grade
The composite is a weighted blend of 9 inputs, each scored 0–100. Each bar is that input's sub-score; the figure is the points it added to the 100-point composite (weight × sub-score).
- Cash flow +26.5/30.0
- 1% rule +10.0/10.0
- DSCR +9.0/10.0
- ARV discount +7.2/15.0
- Livability +4.2/5.0
- Schools +3.0/10.0
- Rent growth +2.5/5.0
- Condition / age +2.2/5.0
- Appreciation +0.0/10.0
$49,990
🖨 Deal sheet (PDF) 📄 Offer letter ✓ Due diligence
Listing remarks MLS
1,680 sq. ft. manufactured home with 3 bedrooms, 2 full baths, large deck, appliances included with sale of home. This is a manufactured home on a rented lot in Oakridge Estates, current lot rent is $635 a month.
Key facts
- Large deck
- Oakridge estates
- Appliances included
Tags
Neighborhood map
What this means for you Summary
Snapshot
- This is a 3-bed/2.0-bath single-family listed at $50k. Condition is rated fair.
Deal economics
- At list price, monthly cash flow is $132 ($2k/yr) — positive.
- The deal already cash-flows at list — no discount required.
- Meets the 1% rule at list price ($1k rent vs $50k).
- Recommended offer: $44k (12.0% below list) — sets the bar for market timing.
- Cap rate 9.5% vs local median 4.0% in Monroe — top-decile yield for the area; either an underpriced asset or a hidden risk that comps aren't pricing in. Stress-test before assuming the spread holds.
Location & tenants
- Location reads 83/100 on livability (#51 in MI, #1,034 nationally) — a professional / high-income tenant draw. Strengths: commute A+, cost of living A+, housing A+; Watch: employment C-, crime D+, amenities D+.
- Monroe Public Schools (suburban): math 24% / reading 47% proficiency, ranked #278 of 540 in MI (top 52%) — families likely to look elsewhere, expect single-tenant / working-renter base with shorter leases.
- Zoned schools: Custer Elementary School (math 10% / reading 30%, grade F, #1,083 of 1,397 statewide, top 78%, 741 students, 69% FRL); Monroe Middle School (math 34% / reading 64%, grade C, #127 of 493 statewide, top 26%, 653 students, 66% FRL); Monroe High School (math 25% / reading 48%, grade F, #364 of 713 statewide, top 51%, 1,304 students, 52% FRL).
- Market conditions: 154 active listings in the ZIP; 1 comparable units currently listed for rent nearby; 264 units permitted in Monroe County in 2024 (40 in 5+ unit buildings).
Forward outlook
- Local home prices are declining (-3.0%/yr); year-one equity from $346 of loan paydown is wiped out by about $2k of value loss. Plan a longer hold.
- Monroe County population projected at -20% by 2050 — secular population decline; favor cash flow + early exit over multi-decade hold.
- At projected returns (-3.0% appreciation + 3.0% rent growth), your $14k cash investment doubles in ~10 years — after that, you're playing with house money.
Negotiation context
- It's been on market 204 days — a 12% lower offer ($44k) is reasonable based on typical stale-listing flexibility.
- 2 sale attempts; this cycle's ask has dropped $10k (17%) from the opening price — seller is motivated, your offer sets the floor, not the list.
Risks & watch-outs
- Watch-outs: HOA is 45% of rent.
Questions for the listing agent
- It's been on market 204 days. Have you received any prior offers? Is the seller open to a 12% concession, seller financing, or rate buy-down credit?
- Have any recent inspections been done? Can we get a copy of the seller's disclosures and any deferred-maintenance estimates?
- What does the HOA fee cover, when was the last increase, and are there any pending special assessments or reserve-fund shortfalls?
- Why hasn't it sold? Are there any deal-killer items the seller is aware of (foundation, flood, title, zoning, code violations)?
- Is there a deadline driving the sale (1031 exchange, divorce, estate, relocation)? That informs how much negotiation room exists.
- Schools are D-rated, which usually means shorter tenancies and higher turnover. Who's the typical renter profile here, and what's been the actual vacancy rate?
- Crime grade is D in this area — have there been break-ins, vandalism, or insurance claims at this property in the last 3 years? What carrier currently insures it and at what premium?
- What's the average days-on-market for RENTAL listings here right now (not sales)? A rising rental-DOM trend means longer vacancies and softer asking-rent achievability than the comps imply.
- What's the recent tenant-quality profile in this submarket — average credit score on applications, eviction rate, late-payment / NSF rate, and stable-employment percentage? A property-management company in the area should have these aggregated.
- How much new for-sale + rental construction is in the pipeline within 1–3 miles? Heavy new supply typically softens prices + rents 12–24 months out; constrained supply supports both.
Investment metrics
- 1% rule
- 2.82% ✓
- Cap rate
- 9.47%
- Cash-on-cash
- 11.34%
- DSCR
- 1.50
- GRM
- 3.0
CMA / ARV
- ARV (median comp)
- $49,651
- List price
- $49,990
- Delta
- 0.68%
- Verdict
- FAIR
- Comps
- 20 within 1.0 mi
Show comp detail 4 sales within ~0.75 mi
| Address | Dist | Beds/Ba | Sqft | Sold | Price | $/sf | Match |
|---|---|---|---|---|---|---|---|
| 324 Sandalwood Trl | 0.16mi | 3/2.0 | 1,680 (0%) | 13mo | $47,900 | $29 | 82 |
| 85 Oak Rdg | 0.30mi | 4/2.0 (+1) | 1,904 (+13%) | 3mo | $33,000 | $17 | 56 |
| 5530 Forest Dr | 0.69mi | 3/1.0 | 1,635 (-3%) | 20mo | $125,000 | $76 | 43 |
| 5563 Central Dr | 0.74mi | 4/2.0 (+1) | 1,898 (+13%) | 13mo | $300,000 | $158 | 28 |
Match score weights: distance 35% · size 25% · config 20% · recency 20%. Top-matched comps best support the ARV.
Projected returns pro-forma
-3.0% appreciation · 3.0% rent growth · sell at horizon
- IRR
- 1.4%
- Equity multiple
- 1.05×
- Total profit
- $736
- Equity at exit
- $7,454
- IRR
- 11.6%
- Equity multiple
- 1.94×
- Total profit
- $13,162
- Equity at exit
- $4,322
Cash invested: $13,997 (down + closing). Projections, not guarantees.
Landlord ↔ Tenant lean methodology
- Overall (STATE)
- 62 Landlord-Friendly
- State Michigan
- 62 Landlord-Friendly · EVEN
- County
- — inherits STATE
- City
- — inherits STATE
ZIP-level market 48161
- Active inventory
- 154
- Price-to-rent
- 3.0×
Monthly cashflow live
- Estimated rent
- $1,409 medium interval (Pro) →
- Mortgage (P&I)
- −$262
- Tax est. 1.5%
- −$62 /mo · $750/yr
- Insurance
- −$21
- HOA
- −$635
- Lot rent
- −$0
- Vacancy / Maint / Mgmt
- −$296
- Net cashflow
- $132
Break-even live
Sensitivity live
| Price | -10% $167 | -5% $150 | +0% $132 | +5% $115 | +10% $98 |
|---|---|---|---|---|---|
| Rent | -10% $21 | -5% $77 | +0% $132 | +5% $188 | +10% $244 |
| Rate | -1.0pp $157 | -0.5pp $145 | base $132 | +0.5pp $119 | +1.0pp $106 |
UW: 25.0% down · 7.5% · 30yr · 1.5% tax · 5.0% vac · 8.0% maint · 8.0% mgmt
Financing live
Cash to close
- Down payment
- $12,498
- Closing costs
- $1,500
- Reserves months
- —
- Total cash needed
- —
Loan-product check · same deal, 3 products live
Conventional
25% down · 7.5% · 30yr
- Down + closing
- —
- Monthly P&I
- —
- Monthly cashflow
- —
- DSCR
- —
- Eligible?
- —
Personal DTI + credit; lowest rate.
DSCR
20% down · 8.5% · 30yr
- Down + closing
- —
- Monthly P&I
- —
- Monthly cashflow
- —
- DSCR
- —
- Eligible?
- —
No personal income docs; deal must DSCR.
Hard money
10% down · 12.0% · 12mo
- Down + closing
- —
- Monthly P&I
- —
- Monthly cashflow
- —
- DSCR
- —
- Eligible?
- —
Short-term bridge; refi at stabilization.
Rent comps 1 comps
| Address | Beds | Baths | Sqft | Rent | $/sqft | DOM | Units | Dist |
|---|---|---|---|---|---|---|---|---|
| 75 Briarwood Trl Monroe, MI | 3.0–4.0 | 2.0 | 1360 | $1,199 | $0.88 | 16d | 1 | 0.12mi |
HOA detail
- Monthly dues
- $635 · $7,620/yr
Listing history 19 events
-
2026-06-22days on market $49,990 Active 204 DOM
-
2026-06-21days on market $49,990 Active 203 DOM
-
2026-06-19days on market $49,990 Active 201 DOM
-
2026-06-18days on market $49,990 Active 200 DOM
-
2026-06-17days on market $49,990 Active 199 DOM
-
2026-06-16days on market $49,990 Active 198 DOM
-
2026-06-15days on market $49,990 Active 197 DOM
-
2026-06-14days on market $49,990 Active 195 DOM
-
2026-06-12days on market $49,990 Active 194 DOM
-
2026-06-09days on market $49,990 Active 191 DOM
-
2026-06-08days on market $49,990 Active 190 DOM
-
2026-06-07pricedays on market $49,990 Active 189 DOM
-
2026-06-05days on market $59,900 Active 186 DOM
-
2026-06-02days on market $59,900 Active 184 DOM
-
2026-06-01days on market $59,900 Active 183 DOM
-
2026-05-31days on market $59,900 Active 182 DOM
-
2026-05-30days on market $59,900 Active 181 DOM
-
2025-11-30$59,900 Active 212-char remark
Show marketing remark (212 chars)
1,680 sq. ft. manufactured home with 3 bedrooms, 2 full baths, large deck, appliances included with sale of home. This is a manufactured home on a rented lot in Oakridge Estates, current lot rent is $635 a month.
-
2025-11-29$59,900 Active 212-char remark
Show marketing remark (212 chars)
1,680 sq. ft. manufactured home with 3 bedrooms, 2 full baths, large deck, appliances included with sale of home. This is a manufactured home on a rented lot in Oakridge Estates, current lot rent is $635 a month.
ⓘ Source: listings_history table (triggers on properties + properties_extension) + one-shot
backfill from property_details.listing_events for pre-trigger history.
Nearby sold comps map
Loading sold comps map…
Walkable amenities ~0.75 mi
Loading nearby amenities…
Taxation est. · year 1
- Rental income
- $16,903
- − Mortgage interest
- −$2,800
- − Property taxes
- −$750
- − Insurance
- −$250
- − Repairs & maintenance
- −$1,352
- − Management
- −$1,352
- − HOA
- −$7,620
- − Depreciation
- −$1,454
- Taxable income
- $1,324
- Est. tax owed @ 24.0%
- −$318
- After-tax cash flow
- $1,270/yr
For passive investors: Depreciation is non-cash, so a rental often shows a tax loss while cash-flowing — sheltering income. Rental losses are passive: they offset passive income freely, and up to $25,000/yr can offset ordinary (W-2) income if you actively participate and your MAGI is under $100k (phasing out to $0 by $150k); unused losses carry forward. On sale, claimed depreciation is recaptured at up to 25%, and gains may owe capital-gains tax (a 1031 exchange can defer both). Figures are a year-1 estimate at your 24.0% rate — not tax advice; consult a CPA.
Condition & rehab AI · 12 photos
This manufactured home requires moderate repairs and updates to its exterior and interior, significantly impacting its curb appeal and interior aesthetics. With some cosmetic improvements, it could become a move-in-ready property.
Repairs flagged
- Major siding — Severe weathering and peeling
- Major paint — Peeling and worn paint
- Major flooring — Worn carpet in living areas
- Major interior walls — Worn paint, peeling in some areas
Value-add opportunities
- Both Paint and interior updates — Enhances curb appeal and interior aesthetics
- Both New flooring — Improves living space and adds value
- Both Landscaping and curb appeal — Enhances overall property appearance
Renovation cost estimate screening
| Repair item | Severity | Est. cost |
|---|---|---|
| siding · Severe weathering and peeling | Major | $15,000–50,000 |
| paint · Peeling and worn paint | Major | $15,000–50,000 |
| flooring · Worn carpet in living areas | Major | $15,000–50,000 |
| interior walls · Worn paint, peeling in some areas | Major | $15,000–50,000 |
| Total estimated repair cost · 4 items | $60,000–200,000 |
Value-add ROI direction
- Both Paint and interior updates — Enhances curb appeal and interior aesthetics ↑
- Both New flooring — Improves living space and adds value ↑
- Both Landscaping and curb appeal — Enhances overall property appearance ↑
ⓘ Cost ranges are severity-bucket heuristics (US national rule-of-thumb). Get contractor quotes + a written scope before underwriting a rehab budget.
Schools (NCES district)
- District
- Monroe Public Schools
- NCES district ID
- 2624150
- Math proficiency
- 24% ▲ 3.00%
- Reading proficiency
- 47% ▲ 12.00%
- Median HH income
- $46,437
- Composite
- 30.33/100
- National rank
- #6269
- State rank
- #278 of 540 in MI
Livability — Monroe
- Score
- 83/100
- State rank
- #51
- US rank
- #1034
Category grades
Schools grade is shown separately in the Schools card above.
Census & demographics
- Census place
- South Monroe, MI
- County
- Monroe County · 54,460 people
- City population
- 54,460
- Metro
- Monroe, MI
- Population (ZIP)
- 26,304
- Household income
- $67,414
- Rent vs Own
- Severe rent burden
- 733.0
Population outlook (Monroe County) Hauer SSP2
- Today (2025)
- 144,439 people
- By 2030
- 140,033 · -3.1%
- By 2040
- 128,408 · -11.1%
- By 2050
- 115,024 · -20.4%
- By 2075
- 87,273 · -39.6%
- By 2100
- 63,110 · -56.3%
Race, ethnicity, and origin ACS 2023
- Neighborhood character
- Predominantly White (85%)
- Race & ethnicity
- White 85% Two or more races 7% Black 5% Hispanic / Latino 5%
- Common ancestry
- Lithuanian 10% Romanian 8% Italian 2%
- Foreign-born
- 3% · Canada, Jamaica
- Languages at home
- 96% English-only · Spanish 2% Other Indo-European 1% Arabic 1%
Political lean MEDSL · Monroe
- 2024 margin
- Strong R (+27.1) · D 35.7% · R 62.9% · Other 1.4%
- 2008→2024 swing
- -31.5pp toward R · 2008: 4.3pp · 2024: -27.1pp
- All cycles
- 2024: R+27.1 2020: R+22.6 2016: R+22.1 2012: D+1.0 2008: D+4.3
Not yet ingested
- Civics
- —
Market trends
- HPI YoY
- ▼ -178.99%
- Current HPI
- 126.2638
- Rent YoY
- —
- Metro
- Monroe, MI
- State GDP YoY
- ▲ 1.37%
- F500 in state
- 28
Industry mix (Fortune 500 HQ in MI)
| Industry | F500 HQs | Revenue |
|---|---|---|
| Automotive Parts | 3 | $48B |
|
||
| Automotive | 2 | $372B |
|
||
| Chemicals | 1 | $45B |
|
||
| Automotive Retail | 1 | $29B |
|
||
| Healthcare / Medical Devices | 1 | $23B |
|
||
| Automotive Technology | 1 | $20B |
|
||
Price history
+0.0% since first listed2 events — show timeline
- 2025-11-30 Listed $59,900 REALCOMP
- 2025-11-29 Listed $59,900 MiRealSource-MiMLS
Cash-flow waterfall
monthlySold comps — $/sqft
last 12 mo · ≤1 miLoading sold comps…