 Duplex
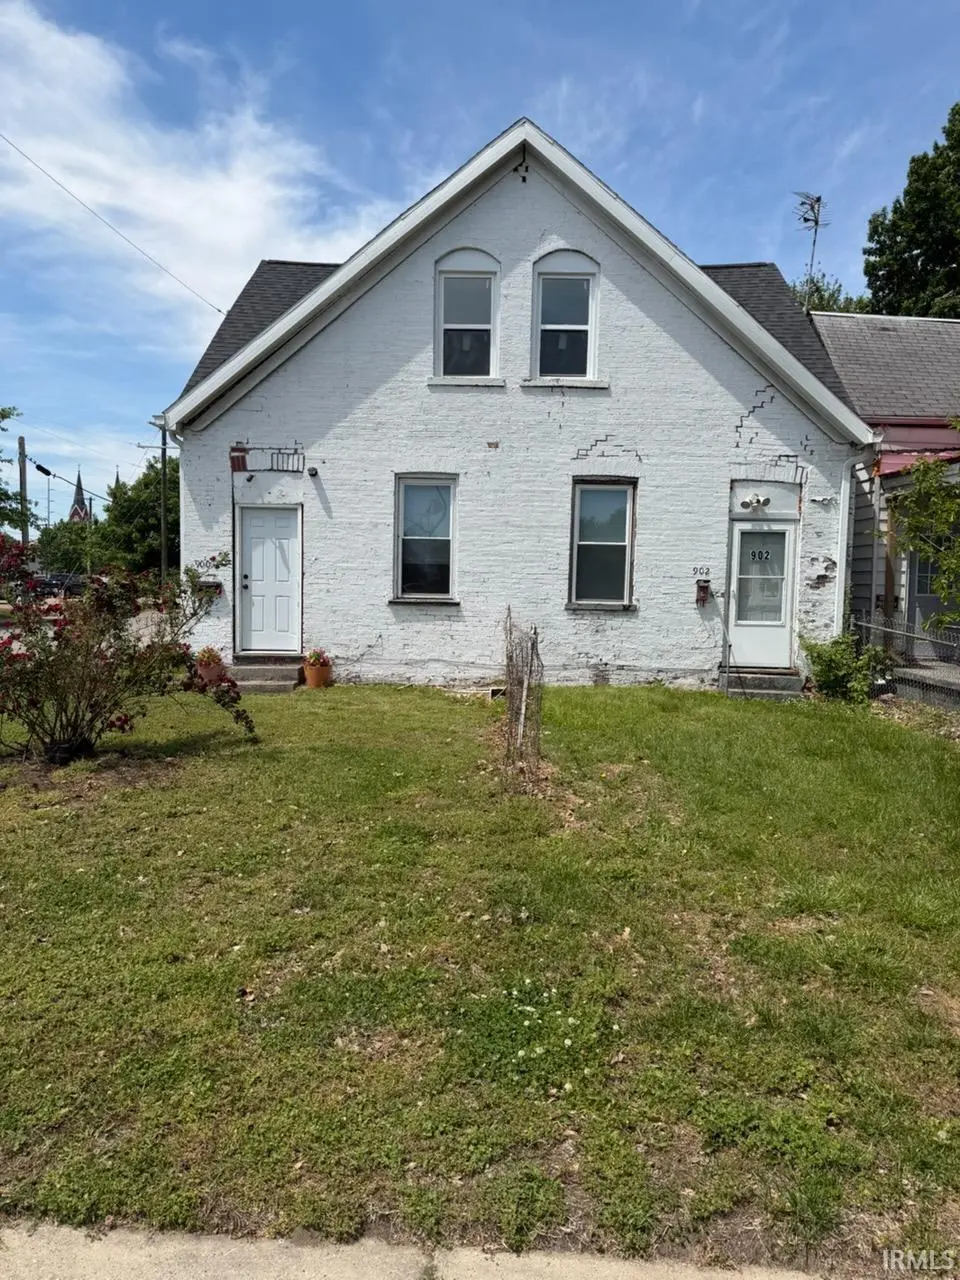
900 902 Mary St · Evansville, IN
Flood risk 1/10 · Minimal
- FEMA flood zone
- X (unshaded)
- Chance of flooding over 30 yrs
- 0.0%
- Est. flood insurance / yr
- $507 – $1,088
Fire risk 1/10 · Minimal
- Est. fire insurance / yr
- $717 – $1,331
Heat risk 5/10 · Moderate
- Hot days now (above 106°F)
- 7 days/yr
- Hot days in 30 yrs
- 19 days/yr
Wind risk 2/10 · Minimal
- Chance of severe wind over 30 yrs
- 4.0%
Air-quality risk 4/10 · Minor
- Unhealthy air days now
- 3 days/yr
- Unhealthy air days in 30 yrs
- 5 days/yr
Risk factors via First Street. Map © Google.
Why this score? — see what drove the B grade
The composite is a weighted blend of 9 inputs, each scored 0–100. Each bar is that input's sub-score; the figure is the points it added to the 100-point composite (weight × sub-score).
- Cash flow +28.8/30.0
- ARV discount +11.1/15.0
- DSCR +10.0/10.0
- 1% rule +8.0/10.0
- Condition / age +3.8/5.0
- Schools +3.3/10.0
- Livability +3.2/5.0
- Rent growth +2.5/5.0
- Appreciation +0.0/10.0
$138,900
🖨 Deal sheet 📄 Offer letter ✓ Due diligence
Multi-family units
County records classify this as Multi-Family (2-4 Unit). Listing-text estimate: 2 units. confirmed
Listing remarks MLS
This is a fantastic opportunity to own a duplex on a corner lot near Deaconess hospital. With a little TLC, this could be a great investment property with a nice return. Per seller, the roof is new, there are two water meters and there is attic space that could be utilized. This property does need work and is priced accordingly. Bring all offers!
Key facts
- Energy efficiency
- Brand new windows
- Newly remodeled
Tags
Property features AI
Finance
- Other: Pets allowed with breed restrictions
Exterior
- Parking: 2 open parking spaces
- Utilities: Public water; Public sewer
- Home design: Duplex (residential income); Single-story
- Construction: Brick construction
- Exterior features: Corner lot
Interior
- Kitchen: Dishwasher; Disposal; Range; Refrigerator
- Flooring: Carpet; Laminate
- Bathrooms: 2 full bathrooms; 2 bathrooms on the main level
- Heating & cooling: Wall unit cooling; Has cooling
- Interior features: Dishwasher; Disposal; Range; Refrigerator; Crawl space basement
- Laundry & utility: Washer hookup
Neighborhood map
What this means for you Summary
Snapshot
- This is a 2 × 1-bed/1.0-bath units multifamily listed at $139k. Condition is rated good.
Deal economics
- At list price, monthly cash flow is $468 ($6k/yr) — positive. Per door: $234/mo.
- The deal already cash-flows at list — no discount required.
- Meets the 1% rule at list price ($2k rent vs $139k).
- Recommended offer: $135k (3.0% below list) — sets the bar for market timing.
- Cap rate 10.3% vs local median 4.6% in Evansville — top-decile yield for the area; either an underpriced asset or a hidden risk that comps aren't pricing in. Stress-test before assuming the spread holds.
Location & tenants
- Location reads 63/100 on livability (#416 in IN) — a middle-class / working-renter tenant base. Strengths: cost of living A+, housing A+, health & safety A+; Watch: crime F, commute F, employment D-.
- Evansville Vanderburgh School Corporation (urban): math 36% / reading 43% proficiency, ranked #153 of 301 in IN (top 51%) — families likely to look elsewhere, expect single-tenant / working-renter base with shorter leases.
- Zoned schools: Delaware Elementary School (math 22% / reading 16%, grade F, #829 of 994 statewide, top 84%, 338 students, 90% FRL); North Junior High School (math 44% / reading 57%, grade C, #43 of 330 statewide, top 14%, 929 students, 42% FRL); North High School (math 57% / reading 74%, grade B, #29 of 369 statewide, top 8%, 1,674 students, 35% FRL).
- Market conditions: 88 active listings in the ZIP; 6 comparable units currently listed for rent nearby; rentals at typical pace (median 21d on market — plan ~3-4 weeks tenant-placement turnaround); 508 units permitted in Vanderburgh County in 2024 (32 in 5+ unit buildings).
- At $1,807/mo this rent would consume 46% of the median local household income ($47k/yr) (locally 722% of renters already pay >50% of income on rent) — very limited rent-growth headroom before tenants either downsize or default.
Forward outlook
- Local home prices are declining (-3.0%/yr); year-one equity from $960 of loan paydown is wiped out by about $4k of value loss. Plan a longer hold.
- At projected returns (-3.0% appreciation + 3.0% rent growth), your $39k cash investment doubles in ~9 years — after that, you're playing with house money.
Negotiation context
- It's been on market 45 days — a 3% lower offer ($135k) is reasonable based on typical stale-listing flexibility.
- 3 sale attempts since 9y ago with the ask held roughly flat each time — persistent listings suggest the price (not the market) is what's stuck; bring a comps-based counter.
- Current owner paid $9k; list at $139k implies a 1394% gain — meaningful room to come down on a strong offer.
Risks & watch-outs
- Watch-outs: built in 1904 — expect roof / HVAC / electrical / plumbing capex.
- Climate carrying-cost: extreme-heat days projected 7→19/yr by 2055 (HVAC capex compounding) — expect insurance premiums to compound above CPI over the hold.
Questions for the listing agent
- It's been on market 45 days. Have you received any prior offers? Is the seller open to a 3% concession, seller financing, or rate buy-down credit?
- Can we see the unit-by-unit rent roll, current vacancy, and any below-market leases? What's the average tenancy length?
- What capital expenditures (roof, boiler, parking lot, exteriors) have been made in the last 5 years, and what's planned in the next 2?
- Built in 1904 — when were the roof, HVAC, electrical panel, plumbing, and water heater last replaced?
- Is there a deadline driving the sale (1031 exchange, divorce, estate, relocation)? That informs how much negotiation room exists.
- Schools are D-rated, which usually means shorter tenancies and higher turnover. Who's the typical renter profile here, and what's been the actual vacancy rate?
- Crime grade is F in this area — have there been break-ins, vandalism, or insurance claims at this property in the last 3 years? What carrier currently insures it and at what premium?
- What's the average days-on-market for RENTAL listings here right now (not sales)? A rising rental-DOM trend means longer vacancies and softer asking-rent achievability than the comps imply.
- What's the recent tenant-quality profile in this submarket — average credit score on applications, eviction rate, late-payment / NSF rate, and stable-employment percentage? A property-management company in the area should have these aggregated.
- How much new apartment / multifamily construction is in the pipeline within 1–3 miles? Heavy new supply (>2% of stock underway) typically softens rents 12–24 months out; light construction supports rent growth.
Investment metrics
- 1% rule
- 1.30% ✓
- Cap rate
- 10.33%
- Cash-on-cash
- 14.43%
- DSCR
- 1.64
- GRM
- 6.4
CMA / ARV
- ARV (on-the-fly)
- $150,832
- Comps found
- 1
Show comp detail 1 sale within ~0.75 mi
| Address | Dist | Beds/Ba | Sqft | Sold | Price | $/sf | Match |
|---|---|---|---|---|---|---|---|
| 910 Harriet St | 0.08mi | 3/2.0 (-1) | 1,881 (+10%) | 3mo | $165,000 | $88 | 64 |
Match score weights: distance 35% · size 25% · config 20% · recency 20%. Top-matched comps best support the ARV.
Projected returns pro-forma
-3.0% appreciation · 3.0% rent growth · sell at horizon
- IRR
- 4.8%
- Equity multiple
- 1.19×
- Total profit
- $7,303
- Equity at exit
- $20,710
- IRR
- 14.3%
- Equity multiple
- 2.15×
- Total profit
- $44,820
- Equity at exit
- $12,010
Cash invested: $38,892 (down + closing). Projections, not guarantees.
Landlord ↔ Tenant lean methodology
- Overall (STATE)
- 90 Strongly Landlord-Friendly
- State Indiana
- 90 Strongly Landlord-Friendly · R+11
- County
- — inherits STATE
- City
- — inherits STATE
ZIP-level market 47710
- Home prices YoY
- -29.7%
- Active inventory
- 88
- Price-to-rent
- 12.8×
Monthly cashflow live
- Estimated rent
- $1,807 high interval (Pro) →
- Mortgage (P&I)
- −$728
- Tax est. 1.5%
- −$174 /mo · $2,084/yr
- Insurance
- −$58
- HOA
- −$0
- Vacancy / Maint / Mgmt
- −$379
- Net cashflow
- $468
Break-even live
2-unit breakdown (identical units grouped — click to expand)
| Units | Beds | Baths | Est. rent |
|---|---|---|---|
| 2× units | 1 | 1 | $1,806 |
| #1 | 1 | 1 | $903 |
| #2 | 1 | 1 | $903 |
| Total (2 units) | $1,807 | ||
UW: 25.0% down · 7.5% · 30yr · 1.5% tax · 5.0% vac · 8.0% maint · 8.0% mgmt
Financing live
Cash to close
- Down payment
- $34,725
- Closing costs
- $4,167
- Reserves months
- —
- Total cash needed
- —
Loan-product check · same deal, 3 products live
Conventional
25% down · 7.5% · 30yr
- Down + closing
- —
- Monthly P&I
- —
- Monthly cashflow
- —
- DSCR
- —
- Eligible?
- —
Personal DTI + credit; lowest rate.
DSCR
20% down · 8.5% · 30yr
- Down + closing
- —
- Monthly P&I
- —
- Monthly cashflow
- —
- DSCR
- —
- Eligible?
- —
No personal income docs; deal must DSCR.
Hard money
10% down · 12.0% · 12mo
- Down + closing
- —
- Monthly P&I
- —
- Monthly cashflow
- —
- DSCR
- —
- Eligible?
- —
Short-term bridge; refi at stabilization.
Rent comps 6 comps
| Address | Beds | Baths | Sqft | Rent | $/sqft | DOM | Units | Dist |
|---|---|---|---|---|---|---|---|---|
| 1317 Harriet St Evansville, IN | 3.0 | 2.0 | 2000 | $995 | $0.50 | 13d | 1 | 0.29mi |
| 121 E Florida St Evansville, IN | 4.0 | 2.0 | 1702 | $100 | $0.06 | 21d | 1 | 0.58mi |
| 109 E Eichel Ave Unit B Evansville, IN | 4.0 | 2.0 | 1228 | $1,257 | $1.02 | 21d | 1 | 0.62mi |
| 1106 W Illinois St Evansville, IN | 5.0 | 2.0 | 1892 | $3,500 | $1.85 | 21d | 1 | 0.68mi |
| 1319 Uhlhorn St Evansville, IN | 3.0 | 2.0 | 1424 | $1,350 | $0.95 | 13d | 1 | 0.93mi |
| 2102 W Delaware St Evansville, IN | 3.0 | 1.0 | 1083 | $925 | $0.85 | 13d | 1 | 1.36mi |
Listing history 19 events
-
2026-06-18days on market $138,900 Active 45 DOM
-
2026-06-17days on market $138,900 Active 44 DOM
-
2026-06-16days on market $138,900 Active 43 DOM
-
2026-06-15days on market $138,900 Active 42 DOM
-
2026-06-14days on market $138,900 Active 40 DOM
-
2026-06-13days on market $138,900 Active 39 DOM
-
2026-06-10days on market $138,900 Active 37 DOM
-
2026-06-09days on market $138,900 Active 36 DOM
-
2026-06-08days on market $138,900 Active 35 DOM
-
2026-06-07days on market $138,900 Active 34 DOM
-
2026-06-02days on market $138,900 Active 29 DOM
-
2026-06-01days on market $138,900 Active 28 DOM
-
2026-05-31days on market $138,900 Active 27 DOM
-
2026-05-30days on market $138,900 Active 26 DOM
-
2026-05-04$138,900 Active
-
2024-08-24historical $695
-
2024-08-06$695
-
2017-11-20soldstatus $9,300 348-char remark
Show marketing remark (348 chars)
This is a fantastic opportunity to own a duplex on a corner lot near Deaconess hospital. With a little TLC, this could be a great investment property with a nice return. Per seller, the roof is new, there are two water meters and there is attic space that could be utilized. This property does need work and is priced accordingly. Bring all offers!
-
2017-09-29$19,900 348-char remark
Show marketing remark (348 chars)
This is a fantastic opportunity to own a duplex on a corner lot near Deaconess hospital. With a little TLC, this could be a great investment property with a nice return. Per seller, the roof is new, there are two water meters and there is attic space that could be utilized. This property does need work and is priced accordingly. Bring all offers!
ⓘ Source: listings_history table (triggers on properties + properties_extension) + one-shot
backfill from property_details.listing_events for pre-trigger history.
Climate risk First Street
- Flood 1/10 Low FEMA zone X (unshaded) · 0% chance over 30 yrs
- Wildfire 1/10 Low
- Heat 5/10 Major 7 d/yr ≥106°F today · 19 d/yr by 30 yrs out
- Wind 2/10 Low 4% chance of damaging wind over 30 yrs
- Air quality 4/10 Moderate 3 unhealthy d/yr today · 5 by 30 yrs out
Nearby sold comps map
Loading sold comps map…
Walkable amenities ~0.75 mi
Loading nearby amenities…
Taxation est. · year 1
- Rental income
- $21,684
- − Mortgage interest
- −$7,781
- − Property taxes
- −$2,084
- − Insurance
- −$694
- − Repairs & maintenance
- −$1,735
- − Management
- −$1,735
- − Depreciation
- −$4,041
- Taxable income
- $3,615
- Est. tax owed @ 24.0%
- −$868
- After-tax cash flow
- $4,744/yr
For passive investors: Depreciation is non-cash, so a rental often shows a tax loss while cash-flowing — sheltering income. Rental losses are passive: they offset passive income freely, and up to $25,000/yr can offset ordinary (W-2) income if you actively participate and your MAGI is under $100k (phasing out to $0 by $150k); unused losses carry forward. On sale, claimed depreciation is recaptured at up to 25%, and gains may owe capital-gains tax (a 1031 exchange can defer both). Figures are a year-1 estimate at your 24.0% rate — not tax advice; consult a CPA.
Condition & rehab AI · 9 photos
This well-maintained duplex is ready for immediate rental income with minimal cosmetic updates needed.
Value-add opportunities
- Both paint exterior — enhances curb appeal and value
- Both landscaping — improves curb appeal and rental appeal
Renovation cost estimate screening
Value-add ROI direction
- Both paint exterior — enhances curb appeal and value ↑
- Both landscaping — improves curb appeal and rental appeal ↑
ⓘ Cost ranges are severity-bucket heuristics (US national rule-of-thumb). Get contractor quotes + a written scope before underwriting a rehab budget.
Schools (NCES district)
- District
- Evansville Vanderburgh School Corporation
- NCES district ID
- 1803450
- Math proficiency
- 36% ▼ -7.00%
- Reading proficiency
- 43% ▼ -3.00%
- Median HH income
- $43,270
- Composite
- 33.41/100
- National rank
- #5471
- State rank
- #153 of 301 in IN
Livability — Evansville
- Score
- 63/100
- State rank
- #416
- US rank
- #15047
Category grades
Schools grade is shown separately in the Schools card above.
Census & demographics
- Census place
- Evansville, IN
- County
- Vanderburgh County · 146,793 people
- City population
- 146,793
- Metro
- Evansville, IN-KY
- Population (ZIP)
- 18,309
- Household income
- $47,292
- Rent vs Own
- Severe rent burden
- 722.0
Population outlook (Vanderburgh County) Hauer SSP2
- Today (2025)
- 187,038 people
- By 2030
- 188,907 · +1.0%
- By 2040
- 190,272 · +1.7%
- By 2050
- 188,871 · +1.0%
- By 2075
- 180,751 · -3.4%
- By 2100
- 163,015 · -12.8%
Race, ethnicity, and origin ACS 2023
- Neighborhood character
- Predominantly White (83%)
- Race & ethnicity
- White 83% Two or more races 7% Black 6% Hispanic / Latino 4%
- Common ancestry
- Scotch-Irish 2% Lithuanian 1% Slovak 1%
- Foreign-born
- 2% · Canada, China
- Languages at home
- 97% English-only · Spanish 3%
Political lean MEDSL · Vanderburgh
- 2024 margin
- R (+12.7) · D 43.0% · R 55.6% · Other 1.4%
- 2008→2024 swing
- -15.1pp toward R · 2008: 2.5pp · 2024: -12.7pp
- All cycles
- 2024: R+12.7 2020: R+9.6 2016: R+16.9 2012: R+10.8 2008: D+2.5
Not yet ingested
- Civics
- —
Market trends
- HPI YoY
- ▼ -91.84%
- Current HPI
- 217.586
- Rent YoY
- —
- Metro
- Evansville, IN-KY
- State GDP YoY
- ▲ 2.90%
- F500 in state
- 18
Industry mix (Fortune 500 HQ in IN)
| Industry | F500 HQs | Revenue |
|---|---|---|
| Industrial Machinery | 2 | $37B |
|
||
| Healthcare | 1 | $177B |
|
||
| Pharmaceuticals | 1 | $45B |
|
||
| Metals / Steel | 1 | $18B |
|
||
| Agriculture | 1 | $17B |
|
||
| Packaging | 1 | $12B |
|
||
Price history
+598.0% since first listed5 events — show timeline
- 2026-05-04 Listed $138,900 IRMLS
- 2024-08-24 Rental Removed $695 APPFOLIO
- 2024-08-06 Listed for Rent $695 APPFOLIO
- 2017-11-20 Sold (MLS) $9,300 IRMLS
- 2017-09-29 Listed $19,900 IRMLS
Cash-flow waterfall
monthlySold comps — $/sqft
last 12 mo · ≤1 miLoading sold comps…