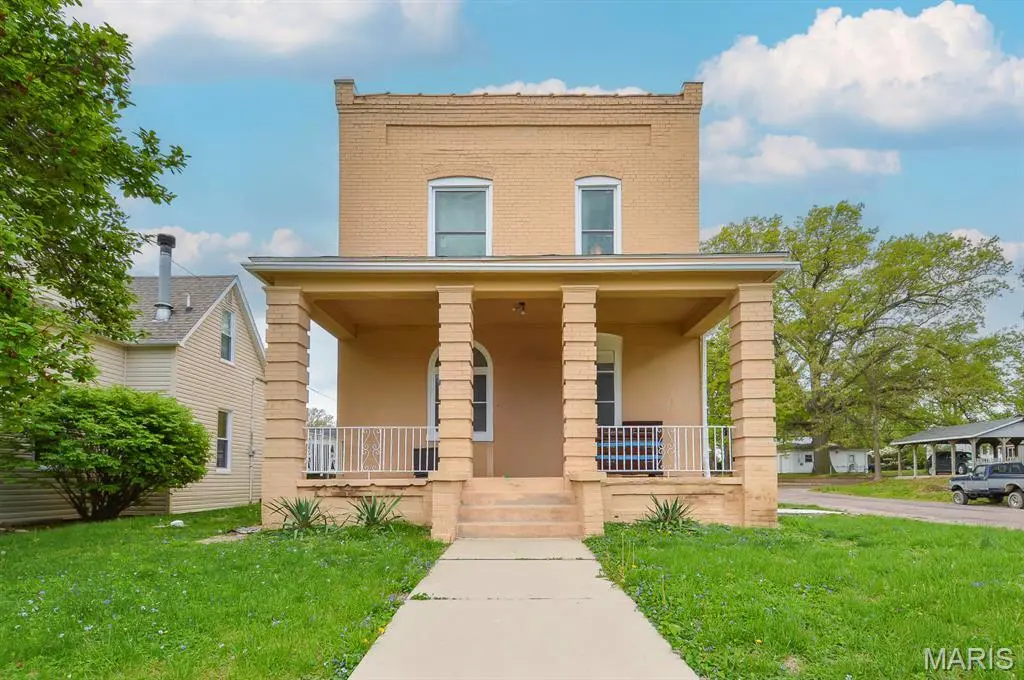
500 Wabash Ave · Belleville, IL
Flood risk 1/10 · Minimal
- FEMA flood zone
- X
- Chance of flooding over 30 yrs
- 0.0%
- Est. flood insurance / yr
- $473 – $860
Fire risk 1/10 · Minimal
- Est. fire insurance / yr
- $804 – $1,492
Heat risk 5/10 · Moderate
- Hot days now (above 107°F)
- 7 days/yr
- Hot days in 30 yrs
- 21 days/yr
Wind risk 2/10 · Minimal
- Chance of severe wind over 30 yrs
- 1.0%
Air-quality risk 4/10 · Minor
- Unhealthy air days now
- 3 days/yr
- Unhealthy air days in 30 yrs
- 6 days/yr
Risk factors via First Street. Map © Google.
Why this score? — see what drove the D+ grade
The composite is a weighted blend of 9 inputs, each scored 0–100. Each bar is that input's sub-score; the figure is the points it added to the 100-point composite (weight × sub-score).
- Cash flow +16.7/30.0
- ARV discount +7.5/15.0
- DSCR +5.2/10.0
- Rent growth +5.0/5.0
- 1% rule +4.8/10.0
- Livability +3.9/5.0
- Condition / age +2.5/5.0
- Schools +2.2/10.0
- Appreciation +0.0/10.0
$134,900
🖨 Deal sheet (PDF) 📄 Offer letter ✓ Due diligence
Listing remarks
Classic character meets modern comfort with this recently remodeled and updated 3BR/2BA home situated on a spacious corner lot just minutes from local schools and the vibrant Belleville Public Square! A welcoming front foyer opens to a beautifully restored staircase accented by classic wooden spindles, while a spacious main-level bedroom is filled with natural light streaming through oversized windows. The main hallway leads to a large family room perfect for everyday living or entertaining, with a conveniently located three-quarter bathroom featuring tiled flooring and a glass-enclosed stand-alone shower. The combined dining area and kitchen flow seamlessly together, creating an inviting s
Key facts
- Large family room
- Spacious corner lot
- Oversized windows
Tags
Property features AI
Finance
- Other: Living area ~1486 (public records); Lot size ~0.17 acre (public records); Year built source: public records
- Financial info: Lease not considered
Exterior
- Parking: Detached garage and on-street parking; 2-car garage (approx. 24x20)
- Utilities: Public water; Public sewer; Electric service by Ameren; Natural gas connected; Cable not available
- Home design: Single-family residence; Two levels; Private ownership; Facing/frontage length approximately 50 feet
- Construction: Brick construction; Flat roof
- Exterior features: Deck; City lot on a corner, level terrain; Asphalt road frontage on a city street
Interior
- Kitchen: Dishwasher; Gas oven; Refrigerator
- Bedrooms: 3 bedrooms total (1 on main level, 2 on upper level)
- Bathrooms: 2 full bathrooms (1 on main level, 1 on upper level)
- Heating & cooling: Forced-air heating (Natural Gas); Central electric air conditioning
- Interior features: Dishwasher; Gas oven; Refrigerator; Full unfinished walk-up basement
- Laundry & utility: Natural gas heating (utility connections for gas)
Neighborhood map
What this means for you Summary
Snapshot
- This is a 3-bed/4.0-bath single-family listed at $135k.
Deal economics
- At list price, monthly cash flow is $83 ($1k/yr) — positive.
- The deal already cash-flows at list — no discount required.
- To meet the 1% rule (rent ≥ 1% of price), the offer needs to be $132k (1.8% below list).
- Recommended offer: $132k (1.8% below list) — sets the bar for 1% rule.
- Cap rate 7.0% vs local median 5.6% in Belleville — meaningfully above typical; check what's discounted (condition, days-on-market, listing class) to confirm the premium yield is real.
Location & tenants
- Location reads 78/100 on livability (#142 in IL, #2,604 nationally) — a middle-class / working-renter tenant base. Strengths: commute A+, cost of living A+, housing A+; Watch: crime F, amenities D-.
- Belleville Twp Hsd 201 (suburban): math 21% / reading 28% proficiency, ranked #308 of 620 in IL (top 50%) — low school quality limits family demand, transient renter base, plan for 1-2y turnover.
- Zoned schools: Douglas Elem School (math 12% / reading 22%, grade F, #1,141 of 2,056 statewide, top 59%, 248 students, 0% FRL); Central Jr High School (math 14% / reading 27%, grade F, #410 of 665 statewide, top 62%, 366 students, 0% FRL); Belleville High School-East (math 23% / reading 30%, grade F, #241 of 693 statewide, top 35%, 2,568 students, 0% FRL).
- Market conditions: Rents rising fast (+14.5%/yr); 149 active listings in the ZIP; 783 units permitted in St. Clair County in 2024 (378 in 5+ unit buildings).
Forward outlook
- Local home prices are declining (-3.0%/yr); year-one equity from $933 of loan paydown is wiped out by about $4k of value loss. Plan a longer hold.
- St. Clair County population projected at -23% by 2050 — secular population decline; favor cash flow + early exit over multi-decade hold.
- At projected returns (-3.0% appreciation + 8.0% rent growth), your $38k cash investment doubles in ~10 years — after that, you're playing with house money.
Negotiation context
- It's been on market 30 days — a 2% lower offer ($133k) is reasonable based on typical stale-listing flexibility.
- 2 sale attempts with the ask held roughly flat each time — persistent listings suggest the price (not the market) is what's stuck; bring a comps-based counter.
Risks & watch-outs
- Watch-outs: built in 1899 — expect roof / HVAC / electrical / plumbing capex.
- Climate carrying-cost: extreme-heat days projected 7→21/yr by 2055 (HVAC capex compounding) — expect insurance premiums to compound above CPI over the hold.
Questions for the listing agent
- Built in 1899 — when were the roof, HVAC, electrical panel, plumbing, and water heater last replaced?
- Is there a deadline driving the sale (1031 exchange, divorce, estate, relocation)? That informs how much negotiation room exists.
- Crime grade is F in this area — have there been break-ins, vandalism, or insurance claims at this property in the last 3 years? What carrier currently insures it and at what premium?
- The area grade is low — what's the realistic commute time and amenity access for the typical tenant pool here? Any planned neighborhood developments (good or bad) we should know about?
- What's the average days-on-market for RENTAL listings here right now (not sales)? A rising rental-DOM trend means longer vacancies and softer asking-rent achievability than the comps imply.
- What's the recent tenant-quality profile in this submarket — average credit score on applications, eviction rate, late-payment / NSF rate, and stable-employment percentage? A property-management company in the area should have these aggregated.
- How much new for-sale + rental construction is in the pipeline within 1–3 miles? Heavy new supply typically softens prices + rents 12–24 months out; constrained supply supports both.
Investment metrics
- 1% rule
- 0.98% ✗
- Cap rate
- 7.03%
- Cash-on-cash
- 2.65%
- DSCR
- 1.12
- GRM
- 8.5
CMA / ARV
- ARV (on-the-fly)
- $72,688
- Comps found
- 3
Show comp detail 3 sales within ~0.75 mi
| Address | Dist | Beds/Ba | Sqft | Sold | Price | $/sf | Match |
|---|---|---|---|---|---|---|---|
| 140 N Virginia Ave | 0.62mi | 3/1.0 | 600 (-3%) | 6mo | $142,500 | $238 | 50 |
| 21 Rusty Wil Dr | 0.39mi | 2/1.0 (-1) | 672 (+9%) | 15mo | $52,650 | $78 | 37 |
| 15 Rusty Wil | 0.33mi | 2/1.0 (-1) | 672 (+9%) | 20mo | $79,500 | $118 | 35 |
Match score weights: distance 35% · size 25% · config 20% · recency 20%. Top-matched comps best support the ARV.
Projected returns pro-forma
-3.0% appreciation · 8.0% rent growth · sell at horizon
- IRR
- -6.5%
- Equity multiple
- 0.75×
- Total profit
- $-9,515
- Equity at exit
- $20,114
- IRR
- 8.6%
- Equity multiple
- 1.81×
- Total profit
- $30,556
- Equity at exit
- $11,664
Cash invested: $37,772 (down + closing). Projections, not guarantees.
Landlord ↔ Tenant lean methodology
- Overall (STATE)
- 43 Moderately Tenant-Leaning
- State Illinois
- 43 Moderately Tenant-Leaning · D+7
- County
- — inherits STATE
- City
- — inherits STATE
ZIP-level market 62220
- Home prices YoY
- -26.4%
- Rents YoY
- 14.5%
- Active inventory
- 149
- Price-to-rent
- 8.5×
Monthly cashflow live
- Estimated rent
- $1,324 medium interval (Pro) →
- Mortgage (P&I)
- −$707
- Tax from tax record
- −$199 /mo · $2,390/yr
- Insurance
- −$56
- HOA
- −$0
- Vacancy / Maint / Mgmt
- −$278
- Net cashflow
- $83
Break-even live
Sensitivity live
| Price | -10% $160 | -5% $122 | +0% $83 | +5% $45 | +10% $7 |
|---|---|---|---|---|---|
| Rent | -10% $-21 | -5% $31 | +0% $83 | +5% $136 | +10% $188 |
| Rate | -1.0pp $151 | -0.5pp $118 | base $83 | +0.5pp $48 | +1.0pp $13 |
UW: 25.0% down · 7.5% · 30yr · 1.5% tax · 5.0% vac · 8.0% maint · 8.0% mgmt
Financing live
Cash to close
- Down payment
- $33,725
- Closing costs
- $4,047
- Reserves months
- —
- Total cash needed
- —
Loan-product check · same deal, 3 products live
Conventional
25% down · 7.5% · 30yr
- Down + closing
- —
- Monthly P&I
- —
- Monthly cashflow
- —
- DSCR
- —
- Eligible?
- —
Personal DTI + credit; lowest rate.
DSCR
20% down · 8.5% · 30yr
- Down + closing
- —
- Monthly P&I
- —
- Monthly cashflow
- —
- DSCR
- —
- Eligible?
- —
No personal income docs; deal must DSCR.
Hard money
10% down · 12.0% · 12mo
- Down + closing
- —
- Monthly P&I
- —
- Monthly cashflow
- —
- DSCR
- —
- Eligible?
- —
Short-term bridge; refi at stabilization.
Listing history 16 events
-
2026-06-21days on market $134,900 Active 30 DOM
-
2026-06-18days on market $134,900 Active 27 DOM
-
2026-06-17days on market $134,900 Active 26 DOM
-
2026-06-16days on market $134,900 Active 25 DOM
-
2026-06-15days on market $134,900 Active 24 DOM
-
2026-06-13days on market $134,900 Active 22 DOM
-
2026-06-09days on market $134,900 Active 18 DOM
-
2026-06-08days on market $134,900 Active 17 DOM
-
2026-06-07days on market $134,900 Active 16 DOM
-
2026-06-03days on market $134,900 Active 12 DOM
-
2026-06-02days on market $134,900 Active 11 DOM
-
2026-06-01days on market $134,900 Active 10 DOM
-
2026-05-31days on market $134,900 Active 9 DOM
-
2026-05-22$134,900 Active
-
2026-04-24$100,000 Active
-
2026-04-23historical
ⓘ Source: listings_history table (triggers on properties + properties_extension) + one-shot
backfill from property_details.listing_events for pre-trigger history.
Tax reassessment forecast IL · Partial reset (capped growth)
- Current annual tax
- $2,390 · $199/mo
- Projected year-2 tax
- $2,726 · $227/mo
- Expected delta
- +$336/yr (+$28/mo · 14.1%)
ⓘ Screening estimate from a state-policy table — verify with the county assessor before closing.
Climate risk First Street
- Flood 1/10 Low FEMA zone X · 0% chance over 30 yrs
- Wildfire 1/10 Low
- Heat 5/10 Major 7 d/yr ≥107°F today · 21 d/yr by 30 yrs out
- Wind 2/10 Low 100% chance of damaging wind over 30 yrs
- Air quality 4/10 Moderate 3 unhealthy d/yr today · 6 by 30 yrs out
Nearby sold comps map
Loading sold comps map…
Walkable amenities ~0.75 mi
Loading nearby amenities…
Taxation est. · year 1
- Rental income
- $15,890
- − Mortgage interest
- −$7,556
- − Property taxes
- −$2,390
- − Insurance
- −$674
- − Repairs & maintenance
- −$1,271
- − Management
- −$1,271
- − Depreciation
- −$3,924
- Taxable loss
- −$1,197
- Est. tax savings @ 24.0%
- +$287
- After-tax cash flow
- $1,287/yr
For passive investors: Depreciation is non-cash, so a rental often shows a tax loss while cash-flowing — sheltering income. Rental losses are passive: they offset passive income freely, and up to $25,000/yr can offset ordinary (W-2) income if you actively participate and your MAGI is under $100k (phasing out to $0 by $150k); unused losses carry forward. On sale, claimed depreciation is recaptured at up to 25%, and gains may owe capital-gains tax (a 1031 exchange can defer both). Figures are a year-1 estimate at your 24.0% rate — not tax advice; consult a CPA.
Schools (NCES district)
- District
- Belleville Twp Hsd 201
- NCES district ID
- 1705640
- Math proficiency
- 21% ▼ -8.00%
- Reading proficiency
- 28% ▼ -3.00%
- Median HH income
- $58,064
- Composite
- 22.39/100
- National rank
- #8115
- State rank
- #308 of 620 in IL
Livability — Belleville
- Score
- 78/100
- State rank
- #142
- US rank
- #2604
Category grades
Schools grade is shown separately in the Schools card above.
Census & demographics
- Census place
- Belleville, IL
- County
- Saint Clair County · 169,691 people
- City population
- 47,407
- Metro
- St. Louis, MO-IL
- Population (ZIP)
- 19,152
- Household income
- $65,952
- Rent vs Own
- Severe rent burden
- 923.0
Population outlook (St. Clair County) Hauer SSP2
- Today (2025)
- 250,366 people
- By 2030
- 240,511 · -3.9%
- By 2040
- 217,391 · -13.2%
- By 2050
- 192,699 · -23.0%
- By 2075
- 140,637 · -43.8%
- By 2100
- 100,499 · -59.9%
Race, ethnicity, and origin ACS 2023
- Neighborhood character
- Predominantly White (67%)
- Race & ethnicity
- White 67% Black 22% Two or more races 6% Hispanic / Latino 3% Asian 1%
- Common ancestry
- Lithuanian 2% Slovak 2% Romanian 2%
- Foreign-born
- 4% · Canada
- Languages at home
- 95% English-only · Arabic 2% Spanish 1% Other Indo-European 1%
Political lean MEDSL · St. Clair
- 2024 margin
- Lean D (+7.9) · D 53.0% · R 45.1% · Other 1.8%
- 2008→2024 swing
- -14.6pp toward R · 2008: 22.4pp · 2024: 7.9pp
- All cycles
- 2024: D+7.9 2020: D+8.7 2016: D+5.6 2012: D+14.5 2008: D+22.4
Not yet ingested
- Civics
- —
Market trends
- HPI YoY
- ▼ -52.27%
- Current HPI
- 145.9237
- Rent YoY
- ▲ 14.47%
- Metro
- St. Louis, MO-IL
- State GDP YoY
- ▲ 1.59%
- F500 in state
- 60
Industry mix (Fortune 500 HQ in IL)
| Industry | F500 HQs | Revenue |
|---|---|---|
| Insurance | 4 | $201B |
|
||
| Consumer Goods | 4 | $87B |
|
||
| Industrial Machinery | 3 | $64B |
|
||
| Healthcare | 2 | $55B |
|
||
| Retail / Pharmacy | 1 | $148B |
|
||
| Agriculture / Food | 1 | $86B |
|
||
Price history
+34.9% since first listed3 events — show timeline
- 2026-05-22 Listed $134,900 MARIS as Distributed by MLS Grid
- 2026-04-24 Listed $100,000 MARIS as Distributed by MLS Grid
- 2026-04-23 Coming Soon — MARIS as Distributed by MLS Grid
Property tax history
-0.3%/yrLatest (2024): $2,390 · -6.3% YoY. Source: county tax records.
Cash-flow waterfall
monthlySold comps — $/sqft
last 12 mo · ≤1 miLoading sold comps…