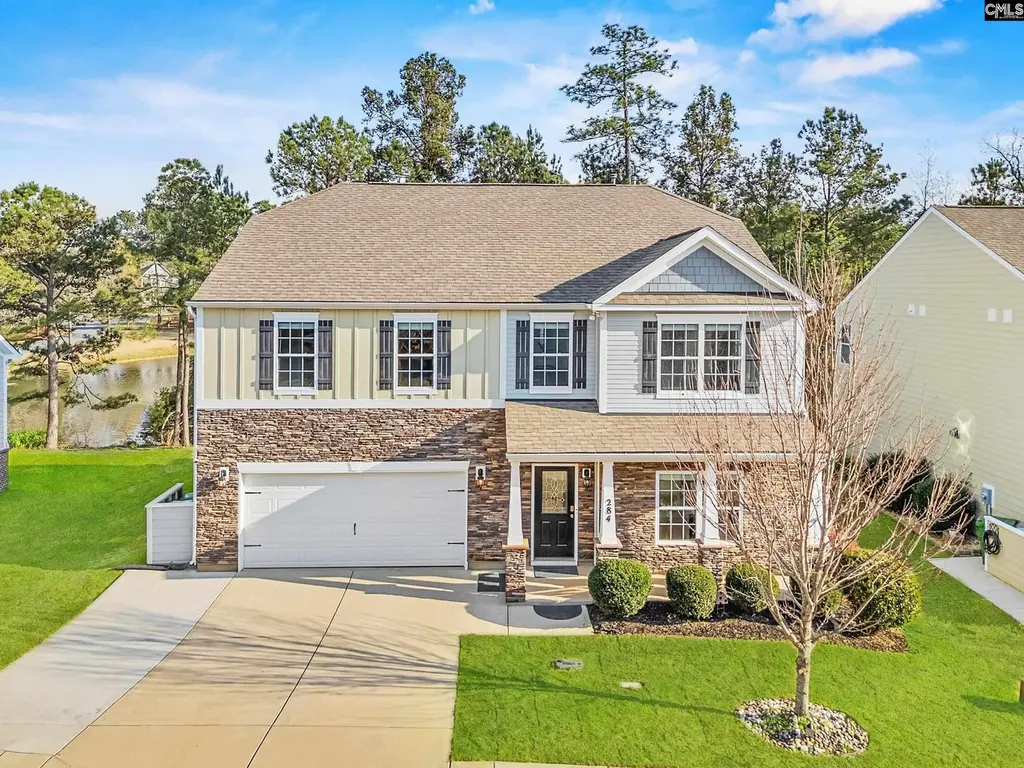
284 October Glory Dr · Blythewood, SC
Flood risk 1/10 · Minimal
- FEMA flood zone
- X (unshaded)
- Chance of flooding over 30 yrs
- 0.0%
- Est. flood insurance / yr
- $507 – $1,088
Fire risk 2/10 · Minimal
- Est. fire insurance / yr
- $783 – $1,453
Heat risk 6/10 · Moderate
- Hot days now (above 106°F)
- 7 days/yr
- Hot days in 30 yrs
- 16 days/yr
Wind risk 6/10 · Moderate
- Chance of severe wind over 30 yrs
- 58.0%
Air-quality risk 3/10 · Minor
- Unhealthy air days now
- 2 days/yr
- Unhealthy air days in 30 yrs
- 2 days/yr
Risk factors via First Street. Map © Google.
Why this score? — see what drove the D grade
The composite is a weighted blend of 9 inputs, each scored 0–100. Each bar is that input's sub-score; the figure is the points it added to the 100-point composite (weight × sub-score).
- Cash flow +13.8/30.0
- ARV discount +7.5/15.0
- DSCR +4.2/10.0
- 1% rule +3.7/10.0
- Schools +3.6/10.0
- Livability +3.5/5.0
- Rent growth +2.5/5.0
- Condition / age +2.5/5.0
- Appreciation +0.0/10.0
$388,500
🖨 Deal sheet (PDF) 📄 Offer letter ✓ Due diligence
Listing remarks
MOTIVATED SELLER! This one has it all! Beautiful move-in ready home on water in a resort like gated golf/tennis/pool community with screened porch and HUGE fenced in yard! This one checks off ALL the boxes! This well maintained home has recent updates like new new carpet, fresh paint, updated owner's shower and provides peaceful views of the community pond right from your screened in porch--great spot for your morning coffee or evening beverage! The large open floor-plan with plenty of storage won't disappoint. Work from home in your private office with double doors at the front of the house OR work/play from your upstairs loft overlooking the water! Cobblestone park is a premier gated comm
Key facts
- 6,969 sq ft lot
- 2 garage spots
- Community pool
Property features AI
Finance
- Other: Located in a golf community with recreation facilities
- HOA & community: Property is part of an association; Community amenities include clubhouse, playground, community pool, tennis courts, sidewalks, street lighting, road and common area maintenance, and maintained green areas
Exterior
- Parking: Attached 2-car garage (garage on main level)
- Security: Gated community; Community security included in association
- Utilities: Public water; Public sewer
- Home design: Two-story single-family home; Fiber cement (Hardy Plank) and stone exterior
- Construction: Slab foundation
- Exterior features: Covered front porch; Screened back porch; Patio; Full gutters; Automatic sprinkler system; Rear wrought-iron fence; Common pond in community; Paved road access
Interior
- Kitchen: Eat-in kitchen with island; Pantry; Granite countertops; Tiled backsplash; Painted cabinets; Microwave above stove; Engineered hardwood flooring; Recessed lights
- Bedrooms: Master suite with double vanity, garden tub, separate shower, private water closet, walk-in closet, vaulted ceilings, ceiling fan, recessed lighting, and carpeted floors (Master on second level); Bedroom 2 with double vanity, walk-in closet and tub/shower (Second level); Bedroom 3 with double vanity, shared bath, walk-in closet and ceiling fan (Second level); Bedroom 4 with shared bath, ceiling fan and a private closet (Second level)
- Flooring: Engineered hardwood in main living areas; Carpet in master bedroom
- Bathrooms: Three full bathrooms; One half bathroom
- Heating & cooling: Central heating; Gas heating on first and second levels; Heat pump cooling on first and second levels
- Interior features: Attic storage with pull-down access; Ceiling fans; Garage opener; Recessed lighting; Fireplace with natural gas logs
- Laundry & utility: Laundry in heated space (located on second level); Washer and dryer included
Neighborhood map
What this means for you Summary
Snapshot
- This is a 4-bed/4.0-bath single-family listed at $388k.
Deal economics
- At list price, monthly cash flow is $34 ($406/yr) — positive.
- The deal already cash-flows at list — no discount required.
- To meet the 1% rule (rent ≥ 1% of price), the offer needs to be $337k (13.2% below list).
- Recommended offer: $337k (13.2% below list) — sets the bar for 1% rule.
Location & tenants
- Location reads 70/100 on livability (#58 in SC) — a middle-class / working-renter tenant base. Strengths: crime A+, employment A+, housing A+; Watch: amenities F, commute F, health & safety F.
- Richland 02 (suburban): math 35% / reading 47% proficiency, ranked #29 of 80 in SC (top 36%) — families likely to look elsewhere, expect single-tenant / working-renter base with shorter leases.
- Zoned schools: Bethel-Hanberry Elementary (math 48% / reading 49%, grade D, #193 of 597 statewide, top 33%, 759 students, 56% FRL); Westwood High (math 47% / reading 87%, grade B, #73 of 196 statewide, top 41%, 1,684 students, 66% FRL) — zoned schools average 61% FRL vs 38% district-wide (23 pts higher); higher-poverty schools than district average — tighter screening recommended.
- Zoned-school proficiency averages 58% at this address vs 41% district-wide (+17 pts) — the actual schools serving this property are materially stronger than the Richland 02 average implies; a family-tenant draw the district grade alone would hide.
- Market conditions: 657 active listings in the ZIP; 2 comparable units currently listed for rent nearby; solid renter incomes; 3,472 units permitted in Richland County in 2024 (1,096 in 5+ unit buildings).
- This rent runs 43% of the median local income ($95k/yr) — at the standard rent-burdened threshold; future hikes will face affordability resistance.
Forward outlook
- Local home prices are declining (-3.0%/yr); year-one equity from $3k of loan paydown is wiped out by about $12k of value loss. Plan a longer hold.
- Richland County population projected at +30% by 2050 — long-run rental-demand tailwind backs the buy-and-hold thesis.
Negotiation context
- It's been on market 87 days — a 6% lower offer ($365k) is reasonable based on typical stale-listing flexibility.
- 2 sale attempts since 6y ago; this cycle's ask has dropped $32k (8%) from the opening price — seller is motivated, your offer sets the floor, not the list.
- Current owner paid $275k; 41% above their basis — modest negotiation headroom, anchor on the comps not their cost.
Risks & watch-outs
- Climate carrying-cost: major wind risk, 58% chance of damaging wind over 30y; extreme-heat days projected 7→16/yr by 2055 (HVAC capex compounding) — expect insurance premiums to compound above CPI over the hold.
Questions for the listing agent
- It's been on market 87 days. Have you received any prior offers? Is the seller open to a 13% concession, seller financing, or rate buy-down credit?
- What does the HOA fee cover, when was the last increase, and are there any pending special assessments or reserve-fund shortfalls?
- Why hasn't it sold? Are there any deal-killer items the seller is aware of (foundation, flood, title, zoning, code violations)?
- Is there a deadline driving the sale (1031 exchange, divorce, estate, relocation)? That informs how much negotiation room exists.
- Schools are B-rated — typically a magnet for longer-tenancy family renters. What's the average tenant stay here, and is there a school-zone premium baked into asking?
- The area grade is low — what's the realistic commute time and amenity access for the typical tenant pool here? Any planned neighborhood developments (good or bad) we should know about?
- What's the average days-on-market for RENTAL listings here right now (not sales)? A rising rental-DOM trend means longer vacancies and softer asking-rent achievability than the comps imply.
- What's the recent tenant-quality profile in this submarket — average credit score on applications, eviction rate, late-payment / NSF rate, and stable-employment percentage? A property-management company in the area should have these aggregated.
- How much new for-sale + rental construction is in the pipeline within 1–3 miles? Heavy new supply typically softens prices + rents 12–24 months out; constrained supply supports both.
Investment metrics
- 1% rule
- 0.87% ✗
- Cap rate
- 6.40%
- Cash-on-cash
- 0.37%
- DSCR
- 1.02
- GRM
- 9.6
CMA / ARV
No comps found within radius.
Projected returns pro-forma
-3.0% appreciation · 3.0% rent growth · sell at horizon
- IRR
- -15.7%
- Equity multiple
- 0.44×
- Total profit
- $-60,783
- Equity at exit
- $57,927
- IRR
- -7.3%
- Equity multiple
- 0.54×
- Total profit
- $-50,085
- Equity at exit
- $33,590
Cash invested: $108,780 (down + closing). Projections, not guarantees.
Landlord ↔ Tenant lean methodology
- Overall (STATE)
- 90 Strongly Landlord-Friendly
- State South Carolina
- 90 Strongly Landlord-Friendly · R+6
- County
- — inherits STATE
- City
- — inherits STATE
ZIP-level market 29016
- Home prices YoY
- -26.3%
- Active inventory
- 657
- Price-to-rent
- 9.6×
Monthly cashflow live
- Estimated rent
- $3,373 medium interval (Pro) →
- Mortgage (P&I)
- −$2,037
- Tax from tax record
- −$273 /mo · $3,281/yr
- Insurance
- −$162
- HOA
- −$158
- Vacancy / Maint / Mgmt
- −$708
- Net cashflow
- $34
Break-even live
Sensitivity live
| Price | -10% $254 | -5% $144 | +0% $34 | +5% $-76 | +10% $-186 |
|---|---|---|---|---|---|
| Rent | -10% $-233 | -5% $-99 | +0% $34 | +5% $167 | +10% $300 |
| Rate | -1.0pp $229 | -0.5pp $133 | base $34 | +0.5pp $-67 | +1.0pp $-169 |
UW: 25.0% down · 7.5% · 30yr · 1.5% tax · 5.0% vac · 8.0% maint · 8.0% mgmt
Financing live
Cash to close
- Down payment
- $97,125
- Closing costs
- $11,655
- Reserves months
- —
- Total cash needed
- —
Loan-product check · same deal, 3 products live
Conventional
25% down · 7.5% · 30yr
- Down + closing
- —
- Monthly P&I
- —
- Monthly cashflow
- —
- DSCR
- —
- Eligible?
- —
Personal DTI + credit; lowest rate.
DSCR
20% down · 8.5% · 30yr
- Down + closing
- —
- Monthly P&I
- —
- Monthly cashflow
- —
- DSCR
- —
- Eligible?
- —
No personal income docs; deal must DSCR.
Hard money
10% down · 12.0% · 12mo
- Down + closing
- —
- Monthly P&I
- —
- Monthly cashflow
- —
- DSCR
- —
- Eligible?
- —
Short-term bridge; refi at stabilization.
Rent comps 2 comps
| Address | Beds | Baths | Sqft | Rent | $/sqft | DOM | Units | Dist |
|---|---|---|---|---|---|---|---|---|
| 1 Bluebottle Ct Blythewood, SC | 4.0 | 3.0 | 2600 | $2,895 | $1.11 | 13d | 1 | 0.43mi |
| 311 Derrick Ln Blythewood, SC | 3.0 | 3.0 | 2218 | $3,500 | $1.58 | 4d | 1 | 1.03mi |
HOA detail
- Monthly dues
- $158 · $1,896/yr
- Likely covers
- waterpoolsecurity
Listing history 29 events
-
2026-06-22days on market $388,500 Active 87 DOM
-
2026-06-18days on market $388,500 Active 84 DOM
-
2026-06-17price $388,500 Active 83 DOM
-
2026-06-17days on market $389,000 Active 83 DOM
-
2026-06-16days on market $389,000 Active 82 DOM
-
2026-06-15days on market $389,000 Active 81 DOM
-
2026-06-14days on market $389,000 Active 79 DOM
-
2026-06-13days on market $389,000 Active 78 DOM
-
2026-06-10days on market $389,000 Active 76 DOM
-
2026-06-09days on market $389,000 Active 75 DOM
-
2026-06-08days on market $389,000 Active 74 DOM
-
2026-06-07days on market $389,000 Active 73 DOM
-
2026-06-05days on market $389,000 Active 70 DOM
-
2026-06-03days on market $389,000 Active 69 DOM
-
2026-06-03days on market $389,000 Active 68 DOM
-
2026-06-01days on market $389,000 Active 67 DOM
-
2026-05-31pricedays on market $389,000 Active 66 DOM
-
2026-05-18price $399,900
-
2026-05-15price $401,000
-
2026-05-07price $402,000
-
2026-05-01price $403,000
-
2026-04-24price $404,000
-
2026-04-17price $405,000
-
2026-04-04price $419,000
-
2026-03-26$420,000 Active
-
2020-08-19soldstatus $275,000
-
2020-06-20historical
-
2020-05-29$275,000 Active
-
2015-07-02soldstatus $2,596,000
ⓘ Source: listings_history table (triggers on properties + properties_extension) + one-shot
backfill from property_details.listing_events for pre-trigger history.
Tax reassessment forecast SC · Resets to sale price
- Current annual tax
- $3,281 · $273/mo
- Projected year-2 tax
- $3,281 · $273/mo
- Expected delta
- $0/yr ($0/mo · 0.0%)
ⓘ Screening estimate from a state-policy table — verify with the county assessor before closing.
Climate risk First Street
- Flood 1/10 Low FEMA zone X (unshaded) · 0% chance over 30 yrs
- Wildfire 2/10 Low
- Heat 6/10 Major 7 d/yr ≥106°F today · 16 d/yr by 30 yrs out
- Wind 6/10 Major 58% chance of damaging wind over 30 yrs
- Air quality 3/10 Moderate 2 unhealthy d/yr today · 2 by 30 yrs out
Nearby sold comps map
Loading sold comps map…
Walkable amenities ~0.75 mi
Loading nearby amenities…
Taxation est. · year 1
- Rental income
- $40,472
- − Mortgage interest
- −$21,762
- − Property taxes
- −$3,281
- − Insurance
- −$1,942
- − Repairs & maintenance
- −$3,238
- − Management
- −$3,238
- − HOA
- −$1,896
- − Depreciation
- −$11,302
- Taxable loss
- −$6,187
- Est. tax savings @ 24.0%
- +$1,485
- After-tax cash flow
- $1,890/yr
For passive investors: Depreciation is non-cash, so a rental often shows a tax loss while cash-flowing — sheltering income. Rental losses are passive: they offset passive income freely, and up to $25,000/yr can offset ordinary (W-2) income if you actively participate and your MAGI is under $100k (phasing out to $0 by $150k); unused losses carry forward. On sale, claimed depreciation is recaptured at up to 25%, and gains may owe capital-gains tax (a 1031 exchange can defer both). Figures are a year-1 estimate at your 24.0% rate — not tax advice; consult a CPA.
Schools (NCES district)
- District
- Richland 02
- NCES district ID
- 4503390
- Math proficiency
- 35% ▼ -15.00%
- Reading proficiency
- 47% ▼ -5.00%
- Median HH income
- $59,684
- Composite
- 36.2/100
- National rank
- #4730
- State rank
- #29 of 80 in SC
Livability — Blythewood
- Score
- 70/100
- State rank
- #58
- US rank
- #7406
Category grades
Schools grade is shown separately in the Schools card above.
Census & demographics
- Census place
- Blythewood, SC
- County
- Richland County · 389,530 people
- City population
- 30,454
- Metro
- Columbia, SC
- Population (ZIP)
- 30,454
- Household income
- $95,082
- Rent vs Own
- Severe rent burden
- 559.0
Population outlook (Richland County) Hauer SSP2
- Today (2025)
- 459,667 people
- By 2030
- 487,524 · +6.1%
- By 2040
- 542,035 · +17.9%
- By 2050
- 595,371 · +29.5%
- By 2075
- 732,998 · +59.5%
- By 2100
- 820,415 · +78.5%
Race, ethnicity, and origin ACS 2023
- Neighborhood character
- Diverse neighborhood (Simpson 0.64)
- Race & ethnicity
- Black 43% White 42% Two or more races 7% Hispanic / Latino 7% Asian 3%
- Hispanic origin (detail)
- Mexican 1% Puerto Rican 2%
- Common ancestry
- Lithuanian 2% Romanian 2% Slovak 2%
- Foreign-born
- 5% · Canada, China
- Languages at home
- 90% English-only · Spanish 5% Other Indo-European 1% German/W. Germanic 1%
Political lean MEDSL · Richland
- 2024 margin
- Solid D (+34.6) · D 66.4% · R 31.8% · Other 1.8%
- 2008→2024 swing
- +5.7pp toward D · 2008: 28.9pp · 2024: 34.6pp
- All cycles
- 2024: D+34.6 2020: D+38.3 2016: D+32.9 2012: D+33.3 2008: D+28.9
Not yet ingested
- Civics
- —
Market trends
- HPI YoY
- ▼ -65.48%
- Current HPI
- 183.5933
- Rent YoY
- —
- Metro
- Columbia, SC
- State GDP YoY
- ▲ 4.51%
- F500 in state
- 2
Industry mix (Fortune 500 HQ in SC)
| Industry | F500 HQs | Revenue |
|---|---|---|
| Packaging | 1 | $7B |
|
||
Price history
-84.6% since first listed12 events — show timeline
- 2026-05-18 Price Changed $399,900 Consolidated MLS
- 2026-05-15 Price Changed $401,000 Consolidated MLS
- 2026-05-07 Price Changed $402,000 Consolidated MLS
- 2026-05-01 Price Changed $403,000 Consolidated MLS
- 2026-04-24 Price Changed $404,000 Consolidated MLS
- 2026-04-17 Price Changed $405,000 Consolidated MLS
- 2026-04-04 Price Changed $419,000 Consolidated MLS
- 2026-03-26 Listed $420,000 Consolidated MLS
- 2020-08-19 Sold (Public Records) $275,000 Public Records
- 2020-06-20 Delisted — Consolidated MLS
- 2020-05-29 Listed $275,000 Consolidated MLS
- 2015-07-02 Sold (Public Records) $2,596,000 Public Records
Property tax history
+22.2%/yrLatest (2025): $3,281 · +3.6% YoY. Source: county tax records.
Cash-flow waterfall
monthlySold comps — $/sqft
last 12 mo · ≤1 miLoading sold comps…