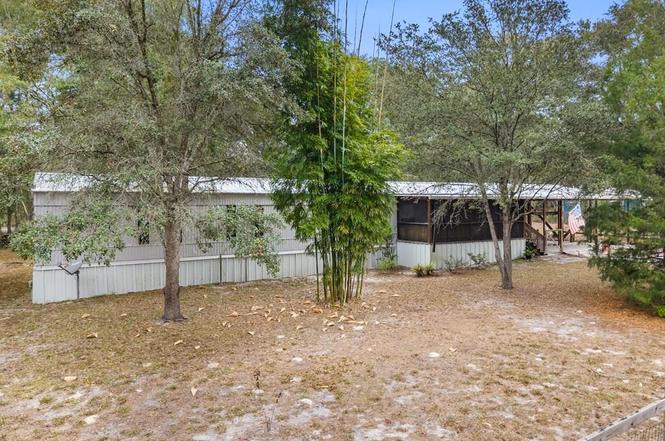
461 NE 432nd Ave · Fanning Springs, FL
Flood risk 7/10 · Major
- FEMA flood zone
- A
- Chance of flooding over 30 yrs
- 0.77%
- Est. flood insurance / yr
- $1,009 – $1,996
Fire risk 6/10 · Moderate
- Est. fire insurance / yr
- $947 – $1,759
Heat risk 8/10 · Major
- Hot days now (above 108°F)
- 7 days/yr
- Hot days in 30 yrs
- 21 days/yr
Wind risk 9/10 · Severe
- Chance of severe wind over 30 yrs
- 99.0%
Air-quality risk 3/10 · Minor
- Unhealthy air days now
- 3 days/yr
- Unhealthy air days in 30 yrs
- 4 days/yr
Risk factors via First Street. Map © Google.
Why this score? — see what drove the B- grade
The composite is a weighted blend of 9 inputs, each scored 0–100. Each bar is that input's sub-score; the figure is the points it added to the 100-point composite (weight × sub-score).
- Cash flow +25.0/30.0
- Appreciation +10.0/10.0
- DSCR +8.1/10.0
- ARV discount +7.5/15.0
- 1% rule +5.5/10.0
- Schools +4.2/10.0
- Livability +3.2/5.0
- Rent growth +2.5/5.0
- Condition / age +2.5/5.0
$139,900
🖨 Deal sheet 📄 Offer letter ✓ Due diligence
Listing remarks MLS
Well Maintained & Manicured! This is not your typical SWMH it is a very large 2 BR, 2 Bath open/split floor plan that features oversized master suite & large master bath, the eat in kitchen features large island sink/bar for entertaining that is open to the oversized living room, 8x24 screened front porch, 12x16 screened back porch with handicap ramp & herb garden. Other exterior features include garden area to sit and watch the butterflies play along with a fire pit, 10x10 storage/workshop, 2 car attached carport all on a fenced & gated . 95 acres on a dead end street. Within minutes to the beautiful Suwannee River at Turner Point Landing with boat launch and park. View Today!
Key facts
- Oversized vanity
- Split-floor plan
- Fully fenced
Tags
Property features AI
Finance
- Other: Property sits on approximately 0.95 acre
Exterior
- Parking: Attached parking
- Utilities: Private well water
- Home design: Residential mobile home; Located in Forest Park Hills subdivision
- Construction: Aluminum siding; Metal roof
- Exterior features: Covered patio/porch; Level lot; Wooded lot; Workshop
Interior
- Kitchen: Refrigerator
- Bedrooms: Total rooms: 4
- Flooring: Laminate; Wood
- Bathrooms: 2 full bathrooms
- Interior features: Breakfast bar; Eat-in kitchen; Walk-in closet(s)
Neighborhood map
What this means for you Summary
Snapshot
- This is a 2-bed/2.0-bath manufactured listed at $140k.
Deal economics
- At list price, monthly cash flow is $178 ($2k/yr) — positive.
- The deal already cash-flows at list — no discount required.
- Meets the 1% rule at list price ($1k rent vs $140k).
- Recommended offer: $123k (12.0% below list) — sets the bar for market timing.
- Cap rate 8.9% vs local median 3.7% in Fanning Springs — top-decile yield for the area; either an underpriced asset or a hidden risk that comps aren't pricing in. Stress-test before assuming the spread holds.
Location & tenants
- Location reads 63/100 on livability (#739 in FL) — a middle-class / working-renter tenant base. Strengths: crime A+, cost of living A+, housing A+; Watch: health & safety D, schools F, amenities F.
- Dixie (rural): math 52% / reading 50% proficiency, ranked #36 of 73 in FL (top 49%) — acceptable for families but not a draw, mixed tenant base, ~2y average lease; 85% free/reduced lunch — lower-income household profile, screen leases tightly.
- Market conditions: 260 active listings in the ZIP; 49 units permitted in Dixie County in 2024 (0 in 5+ unit buildings).
Forward outlook
- In year one you build about $15k of equity ($967 loan paydown + $14k appreciation (10.0% local appreciation)).
- Dixie County population projected at -16% by 2050 — secular population decline; favor cash flow + early exit over multi-decade hold.
- At projected returns (10.0% appreciation + 3.0% rent growth), your $39k cash investment doubles in ~3 years — after that, you're playing with house money.
- By year 3, paydown + projected appreciation supports a ~$38k cash-out refi (75% LTV) — recoverable capital for the next deal without selling this one.
Negotiation context
- It's been on market 146 days — a 12% lower offer ($123k) is reasonable based on typical stale-listing flexibility.
- 3 sale attempts since 8y ago; this cycle's ask has dropped $15k (10%) from the opening price — seller is motivated, your offer sets the floor, not the list.
- Current owner paid $55k; list at $140k implies a 154% gain — meaningful room to come down on a strong offer.
Risks & watch-outs
- Watch-outs: flood insurance adds $125/mo.
- Climate carrying-cost: in FEMA flood zone A (mandatory federal flood insurance); severe wind risk, 99% chance of damaging wind over 30y; major wildfire risk; extreme-heat days projected 7→21/yr by 2055 (HVAC capex compounding) — expect insurance premiums to compound above CPI over the hold.
Questions for the listing agent
- It's been on market 146 days. Have you received any prior offers? Is the seller open to a 12% concession, seller financing, or rate buy-down credit?
- What's the actual annual flood-insurance premium (NFIP or private), and is the property in a SFHA with mandatory coverage?
- Why hasn't it sold? Are there any deal-killer items the seller is aware of (foundation, flood, title, zoning, code violations)?
- Is there a deadline driving the sale (1031 exchange, divorce, estate, relocation)? That informs how much negotiation room exists.
- Schools are F-rated, which usually means shorter tenancies and higher turnover. Who's the typical renter profile here, and what's been the actual vacancy rate?
- What's the average days-on-market for RENTAL listings here right now (not sales)? A rising rental-DOM trend means longer vacancies and softer asking-rent achievability than the comps imply.
- What's the recent tenant-quality profile in this submarket — average credit score on applications, eviction rate, late-payment / NSF rate, and stable-employment percentage? A property-management company in the area should have these aggregated.
- How much new for-sale + rental construction is in the pipeline within 1–3 miles? Heavy new supply typically softens prices + rents 12–24 months out; constrained supply supports both.
Investment metrics
- 1% rule
- 1.05% ✓
- Cap rate
- 8.90%
- Cash-on-cash
- 9.30%
- DSCR
- 1.41
- GRM
- 8.0
CMA / ARV
- ARV (on-the-fly)
- $66,120
- Comps found
- 1
Show comp detail 1 sale within ~0.75 mi
| Address | Dist | Beds/Ba | Sqft | Sold | Price | $/sf | Match |
|---|---|---|---|---|---|---|---|
| 164 NE 453rd Ave | 0.43mi | 2/1.0 | 1,128 (-1%) | 2mo | $65,000 | $58 | 73 |
Match score weights: distance 35% · size 25% · config 20% · recency 20%. Top-matched comps best support the ARV.
Projected returns pro-forma
10.0% appreciation · 3.0% rent growth · sell at horizon
- IRR
- 28.2%
- Equity multiple
- 3.24×
- Total profit
- $87,579
- Equity at exit
- $126,033
- IRR
- 24.6%
- Equity multiple
- 7.36×
- Total profit
- $249,034
- Equity at exit
- $271,795
Cash invested: $39,172 (down + closing). Projections, not guarantees.
Landlord ↔ Tenant lean methodology
- Overall (STATE)
- 87 Strongly Landlord-Friendly
- State Florida
- 87 Strongly Landlord-Friendly · R+3
- County
- — inherits STATE
- City
- — inherits STATE
ZIP-level market 32680
- Home prices YoY
- 2.5%
- Active inventory
- 260
- Price-to-rent
- 8.0×
Monthly cashflow live
- Estimated rent
- $1,465 medium interval (Pro) →
- Mortgage (P&I)
- −$734
- Tax from tax record
- −$62 /mo · $745/yr
- Insurance
- −$58
- Flood insurance flood zone
- −$125 /mo · $1,502/yr
- HOA
- −$0
- Vacancy / Maint / Mgmt
- −$308
- Net cashflow
- $178
Break-even live
UW: 25.0% down · 7.5% · 30yr · 1.5% tax · 5.0% vac · 8.0% maint · 8.0% mgmt
Financing live
Cash to close
- Down payment
- $34,975
- Closing costs
- $4,197
- Reserves months
- —
- Total cash needed
- —
Loan-product check · same deal, 3 products live
Conventional
25% down · 7.5% · 30yr
- Down + closing
- —
- Monthly P&I
- —
- Monthly cashflow
- —
- DSCR
- —
- Eligible?
- —
Personal DTI + credit; lowest rate.
DSCR
20% down · 8.5% · 30yr
- Down + closing
- —
- Monthly P&I
- —
- Monthly cashflow
- —
- DSCR
- —
- Eligible?
- —
No personal income docs; deal must DSCR.
Hard money
10% down · 12.0% · 12mo
- Down + closing
- —
- Monthly P&I
- —
- Monthly cashflow
- —
- DSCR
- —
- Eligible?
- —
Short-term bridge; refi at stabilization.
Listing history 23 events
-
2026-06-18days on market $139,900 Active 146 DOM
-
2026-06-17days on market $139,900 Active 145 DOM
-
2026-06-16days on market $139,900 Active 144 DOM
-
2026-06-15days on market $139,900 Active 143 DOM
-
2026-06-13days on market $139,900 Active 141 DOM
-
2026-06-12days on market $139,900 Active 140 DOM
-
2026-06-09days on market $139,900 Active 137 DOM
-
2026-06-08days on market $139,900 Active 136 DOM
-
2026-06-07days on market $139,900 Active 135 DOM
-
2026-06-07days on market $139,900 Active 134 DOM
-
2026-06-04days on market $139,900 Active 131 DOM
-
2026-06-02days on market $139,900 Active 130 DOM
-
2026-06-01days on market $139,900 Active 129 DOM
-
2026-05-31days on market $139,900 Active 128 DOM
-
2026-05-31days on market $139,900 Active 127 DOM
-
2026-05-07price $139,900
-
2026-04-10price $144,900
-
2026-02-11price $149,900
-
2026-01-24$154,900 Active
-
2025-12-03$159,900 Active
-
2019-01-09soldstatus $55,000
-
2018-12-19soldstatus $55,000 710-char remark
Show marketing remark (710 chars)
Well Maintained & Manicured! This is not your typical SWMH it is a very large 2 BR, 2 Bath open/split floor plan that features oversized master suite & large master bath, the eat in kitchen features large island sink/bar for entertaining that is open to the oversized living room, 8x24 screened front porch, 12x16 screened back porch with handicap ramp & herb garden. Other exterior features include garden area to sit and watch the butterflies play along with a fire pit, 10x10 storage/workshop, 2 car attached carport all on a fenced & gated . 95 acres on a dead end street. Within minutes to the beautiful Suwannee River at Turner Point Landing with boat launch and park. View Today!
-
2018-10-04$59,900 710-char remark
Show marketing remark (710 chars)
Well Maintained & Manicured! This is not your typical SWMH it is a very large 2 BR, 2 Bath open/split floor plan that features oversized master suite & large master bath, the eat in kitchen features large island sink/bar for entertaining that is open to the oversized living room, 8x24 screened front porch, 12x16 screened back porch with handicap ramp & herb garden. Other exterior features include garden area to sit and watch the butterflies play along with a fire pit, 10x10 storage/workshop, 2 car attached carport all on a fenced & gated . 95 acres on a dead end street. Within minutes to the beautiful Suwannee River at Turner Point Landing with boat launch and park. View Today!
ⓘ Source: listings_history table (triggers on properties + properties_extension) + one-shot
backfill from property_details.listing_events for pre-trigger history.
Tax reassessment forecast FL · Resets to sale price
- Current annual tax
- $745 · $62/mo
- Projected year-2 tax
- $1,161 · $97/mo
- Expected delta
- +$417/yr (+$35/mo · 55.9%)
ⓘ Screening estimate from a state-policy table — verify with the county assessor before closing.
Climate risk First Street
- Flood 7/10 Severe FEMA zone A · 77% chance over 30 yrs
- Wildfire 6/10 Major
- Heat 8/10 Severe 7 d/yr ≥108°F today · 21 d/yr by 30 yrs out
- Wind 9/10 Extreme 99% chance of damaging wind over 30 yrs
- Air quality 3/10 Moderate 3 unhealthy d/yr today · 4 by 30 yrs out
Nearby sold comps map
Loading sold comps map…
Walkable amenities ~0.75 mi
Loading nearby amenities…
Taxation est. · year 1
- Rental income
- $17,582
- − Mortgage interest
- −$7,837
- − Property taxes
- −$745
- − Insurance
- −$2,202
- − Repairs & maintenance
- −$1,407
- − Management
- −$1,407
- − Depreciation
- −$4,070
- Taxable loss
- −$84
- Est. tax savings @ 24.0%
- +$20
- After-tax cash flow
- $2,160/yr
For passive investors: Depreciation is non-cash, so a rental often shows a tax loss while cash-flowing — sheltering income. Rental losses are passive: they offset passive income freely, and up to $25,000/yr can offset ordinary (W-2) income if you actively participate and your MAGI is under $100k (phasing out to $0 by $150k); unused losses carry forward. On sale, claimed depreciation is recaptured at up to 25%, and gains may owe capital-gains tax (a 1031 exchange can defer both). Figures are a year-1 estimate at your 24.0% rate — not tax advice; consult a CPA.
Schools (NCES district)
- District
- Dixie
- NCES district ID
- 1200450
- Math proficiency
- 52% ▼ -3.00%
- Reading proficiency
- 50% ▼ -4.00%
- Median HH income
- $34,799
- Composite
- 42.18/100
- National rank
- #3290
- State rank
- #36 of 73 in FL
Livability — Fanning Springs
- Score
- 63/100
- State rank
- #739
- US rank
- #15960
Category grades
Schools grade is shown separately in the Schools card above.
Census & demographics
- Population (ZIP)
- 10,445
Population outlook (Dixie County) Hauer SSP2
- Today (2025)
- 15,122 people
- By 2030
- 14,521 · -4.0%
- By 2040
- 13,503 · -10.7%
- By 2050
- 12,671 · -16.2%
- By 2075
- 10,857 · -28.2%
- By 2100
- 8,344 · -44.8%
Race, ethnicity, and origin ACS 2023
- Neighborhood character
- Predominantly White (94%)
- Race & ethnicity
- White 94% Two or more races 4% Hispanic / Latino 3% Black 1%
- Common ancestry
- Romanian 2% Slovak 1% Italian 1%
- Foreign-born
- 3% · Canada
- Languages at home
- 99% English-only · Spanish 1%
Political lean MEDSL · Dixie
- 2024 margin
- Solid R (+70.4) · D 14.5% · R 84.9%
- 2008→2024 swing
- -25.4pp toward R · 2008: -45.0pp · 2024: -70.4pp
- All cycles
- 2024: R+70.4 2020: R+66.0 2016: R+63.2 2012: R+46.9 2008: R+45.0
Not yet ingested
- Civics
- —
Market trends
- HPI YoY
- ▲ 10.22%
- Current HPI
- 424.0037
- Rent YoY
- —
- Metro
- —
- State GDP YoY
- ▲ 3.28%
- F500 in state
- 36
Industry mix (Fortune 500 HQ in FL)
| Industry | F500 HQs | Revenue |
|---|---|---|
| Industrial Technology | 2 | $29B |
|
||
| Insurance | 2 | $17B |
|
||
| Retail | 1 | $60B |
|
||
| Technology Distribution | 1 | $58B |
|
||
| Homebuilding | 1 | $35B |
|
||
| Technology Manufacturing | 1 | $35B |
|
||
Price history
+133.6% since first listed8 events — show timeline
- 2026-05-07 Price Changed $139,900 DGLMLS
- 2026-04-10 Price Changed $144,900 DGLMLS
- 2026-02-11 Price Changed $149,900 DGLMLS
- 2026-01-24 Listed $154,900 DGLMLS
- 2025-12-03 Listed $159,900 DGLMLS
- 2019-01-09 Sold (Public Records) $55,000 Public Records
- 2018-12-19 Sold (MLS) $55,000 DGLMLS
- 2018-10-04 Listed $59,900 DGLMLS
Property tax history
+10.7%/yrLatest (2025): $745 · +4.3% YoY. Source: county tax records.
Cash-flow waterfall
monthlySold comps — $/sqft
last 12 mo · ≤1 miLoading sold comps…