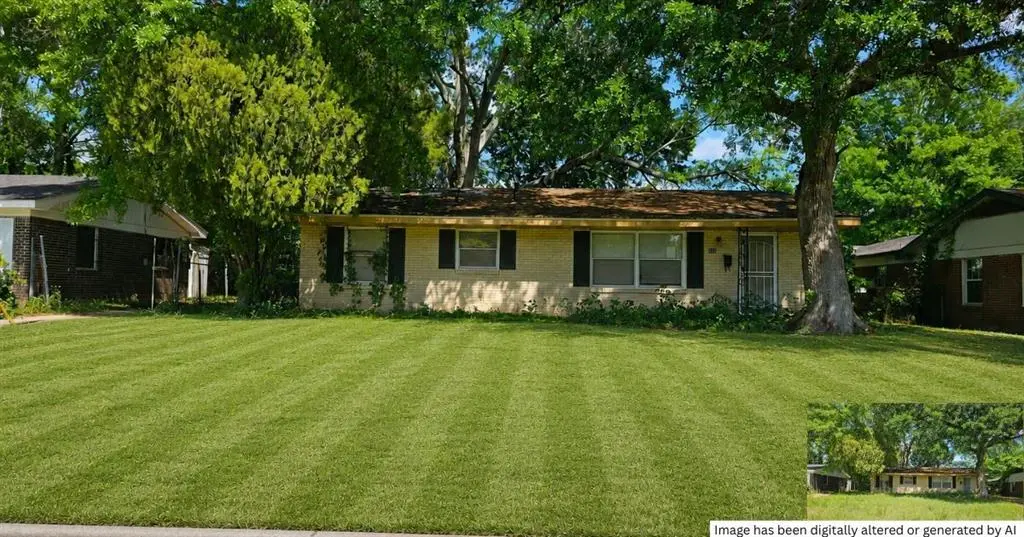
562 Leamore Ct · Mobile, AL
Flood risk 1/10 · Minimal
- FEMA flood zone
- X (unshaded)
- Chance of flooding over 30 yrs
- 0.0%
- Est. flood insurance / yr
- $507 – $1,088
Fire risk 1/10 · Minimal
- Est. fire insurance / yr
- $916 – $1,700
Heat risk 9/10 · Severe
- Hot days now (above 104°F)
- 7 days/yr
- Hot days in 30 yrs
- 21 days/yr
Wind risk 9/10 · Severe
- Chance of severe wind over 30 yrs
- 99.0%
Air-quality risk 2/10 · Minimal
- Unhealthy air days now
- 1 days/yr
- Unhealthy air days in 30 yrs
- 1 days/yr
Risk factors via First Street. Map © Google.
Why this score? — see what drove the B grade
The composite is a weighted blend of 9 inputs, each scored 0–100. Each bar is that input's sub-score; the figure is the points it added to the 100-point composite (weight × sub-score).
- Cash flow +30.0/30.0
- 1% rule +10.0/10.0
- DSCR +10.0/10.0
- Appreciation +7.4/10.0
- ARV discount +5.0/15.0
- Livability +3.8/5.0
- Rent growth +2.5/5.0
- Condition / age +2.5/5.0
- Schools +2.3/10.0
$64,950
🖨 Deal sheet (PDF) 📄 Offer letter ✓ Due diligence
Listing remarks
VRM-Seller will entertain offers between $64,900 and $95,000 Investor Special! Great Fixer-Upper Opportunity! This 3-bedroom, 1-bath home is packed with potential and ready for its next chapter. Conveniently located near University Hospital, this property offers an excellent opportunity for investors, renovators, or buyers looking to add value through improvements. Situated on a spacious lot with generous front and backyard space, there's plenty of room for landscaping, outdoor entertaining, gardening, or future enhancements. The home provides a solid foundation for renovation and customization, making it an ideal project for those with vision and creativity. Whether you're looking to expan
Key facts
- Spacious lot
- 6,939 sq ft lot
- 2 parking spots
Tags
Property features AI
Finance
- Other: Not on land lease
Exterior
- Parking: Driveway parking; Space for 2 vehicles
- Utilities: 110 volt electric service; Public sewer; No listed additional utilities
- Home design: Single family residence; Residential property; Located in Leamore Court subdivision; View present
- Construction: Brick on all sides construction; Built in 1989; Slab foundation; Shingle roof; Wood frame windows
- Exterior features: No notable exterior features; Back yard fencing
Interior
- Kitchen: Cabinets and eat-in kitchen
- Bedrooms: 3 bedrooms
- Flooring: Vinyl flooring; Other flooring
- Bathrooms: Half bathroom
- Heating & cooling: No central heating; Ceiling fan(s) for cooling
- Interior features: Other interior features
- Laundry & utility: Other appliances
Neighborhood map
What this means for you Summary
Snapshot
- This is a 3-bed/1.0-bath single-family listed at $65k.
Deal economics
- At list price, monthly cash flow is $691 ($8k/yr) — positive.
- The deal already cash-flows at list — no discount required.
- Meets the 1% rule at list price ($1k rent vs $65k).
- Cap rate 19.1% vs local median 4.9% in Mobile — top-decile yield for the area; either an underpriced asset or a hidden risk that comps aren't pricing in. Stress-test before assuming the spread holds.
Location & tenants
- Location reads 75/100 on livability (#20 in AL, #4,262 nationally) — a middle-class / working-renter tenant base. Strengths: commute A+, cost of living A+, housing A+; Watch: crime F, employment D-.
- Mobile County (urban): math 15% / reading 39% proficiency, ranked #81 of 129 in AL (top 63%) — low school quality limits family demand, transient renter base, plan for 1-2y turnover; 67% free/reduced lunch — lower-income household profile, screen leases tightly.
- Zoned schools: Holloway Elementary (math 5% / reading 19%, grade F, #554 of 627 statewide, top 88%, 498 students, 98% FRL); Booker T Washington Middle School (math 0% / reading 12%, grade F, #252 of 257 statewide, top 98%, 340 students, 95% FRL); John L Leflore Magnet School (math 2% / reading 2%, grade F, #291 of 305 statewide, top 100%, 618 students, 84% FRL) — zoned schools average 92% FRL vs 67% district-wide (25 pts higher); higher-poverty schools than district average — tighter screening recommended.
- Zoned-school proficiency averages 7% at this address vs 27% district-wide (-20 pts) — the specific schools serving this property underperform the Mobile County average; the district grade overstates school quality for this exact location.
- Market conditions: 40 active listings in the ZIP; 14 comparable units currently listed for rent nearby; rentals at typical pace (median 23d on market — plan ~3-4 weeks tenant-placement turnaround); 1,678 units permitted in Mobile County in 2024 (264 in 5+ unit buildings).
Forward outlook
- In year one you build about $4k of equity ($450 loan paydown + $3k appreciation (4.8% local appreciation)).
- Mobile County population projected to shrink 8% by 2050 — rents likely to lag national; underwrite the cash flow, not the appreciation.
- At projected returns (4.8% appreciation + 3.0% rent growth), your $18k cash investment doubles in ~2 years — after that, you're playing with house money.
- By year 9, paydown + projected appreciation supports a ~$31k cash-out refi (75% LTV) — recoverable capital for the next deal without selling this one.
Negotiation context
- Only 9 days on market — expect competitive offers; lowballing is unlikely to land.
Risks & watch-outs
- Climate carrying-cost: severe wind risk, 99% chance of damaging wind over 30y; extreme-heat days projected 7→21/yr by 2055 (HVAC capex compounding) — expect insurance premiums to compound above CPI over the hold.
Questions for the listing agent
- Is there a deadline driving the sale (1031 exchange, divorce, estate, relocation)? That informs how much negotiation room exists.
- Schools are D-rated, which usually means shorter tenancies and higher turnover. Who's the typical renter profile here, and what's been the actual vacancy rate?
- Crime grade is F in this area — have there been break-ins, vandalism, or insurance claims at this property in the last 3 years? What carrier currently insures it and at what premium?
- What's the average days-on-market for RENTAL listings here right now (not sales)? A rising rental-DOM trend means longer vacancies and softer asking-rent achievability than the comps imply.
- What's the recent tenant-quality profile in this submarket — average credit score on applications, eviction rate, late-payment / NSF rate, and stable-employment percentage? A property-management company in the area should have these aggregated.
- How much new for-sale + rental construction is in the pipeline within 1–3 miles? Heavy new supply typically softens prices + rents 12–24 months out; constrained supply supports both.
Investment metrics
- 1% rule
- 2.11% ✓
- Cap rate
- 19.05%
- Cash-on-cash
- 45.56%
- DSCR
- 3.03
- GRM
- 4.0
CMA / ARV
- ARV (on-the-fly)
- $61,560
- Comps found
- 12
Show comp detail 12 sales within ~0.75 mi
| Address | Dist | Beds/Ba | Sqft | Sold | Price | $/sf | Match |
|---|---|---|---|---|---|---|---|
| 567 Kent St | 0.18mi | 3/1.0 | 997 (-3%) | 3mo | $39,000 | $39 | 84 |
| 500 Summerville St | 0.07mi | 3/1.0 | 1,036 (+1%) | 15mo | $54,300 | $52 | 82 |
| 557 Kent St | 0.13mi | 2/1.0 (-1) | 1,008 (-2%) | 10mo | $37,500 | $37 | 78 |
| 2304 Rushing Dr | 0.24mi | 3/1.0 | 1,092 (+6%) | 4mo | $65,000 | $60 | 75 |
| 556 Wellington St | 0.23mi | 3/1.0 | 994 (-3%) | 14mo | $55,000 | $55 | 73 |
| 2253 Barlow St | 0.20mi | 3/1.0 | 970 (-6%) | 13mo | $59,500 | $61 | 71 |
| 2024 Mott Dr W | 0.40mi | 2/1.0 (-1) | 1,070 (+4%) | 0mo | $38,500 | $36 | 69 |
| 2409 Elsevier St | 0.66mi | 3/1.5 | 1,032 (+1%) | 4mo | $115,000 | $111 | 63 |
| 1869 S Mott Dr | 0.44mi | 3/1.0 | 1,076 (+5%) | 13mo | $95,000 | $88 | 60 |
| 609 Caton Ave | 0.61mi | 3/1.0 | 962 (-6%) | 10mo | $130,000 | $135 | 53 |
| 2005 Mott Dr W | 0.41mi | 2/1.0 (-1) | 939 (-8%) | 13mo | $38,000 | $40 | 51 |
| 2203 Rosa Dr | 0.64mi | 3/1.0 | 1,171 (+14%) | 0mo | $160,500 | $137 | 46 |
Match score weights: distance 35% · size 25% · config 20% · recency 20%. Top-matched comps best support the ARV.
Projected returns pro-forma
4.78% appreciation · 3.0% rent growth · sell at horizon
- IRR
- 53.2%
- Equity multiple
- 4.20×
- Total profit
- $58,111
- Equity at exit
- $35,929
- IRR
- 51.1%
- Equity multiple
- 8.59×
- Total profit
- $138,032
- Equity at exit
- $61,296
Cash invested: $18,186 (down + closing). Projections, not guarantees.
Landlord ↔ Tenant lean methodology
- Overall (STATE)
- 90 Strongly Landlord-Friendly
- State Alabama
- 90 Strongly Landlord-Friendly · R+15
- County
- — inherits STATE
- City
- — inherits STATE
ZIP-level market 36617
- Home prices YoY
- 3.9%
- Active inventory
- 40
- Price-to-rent
- 4.0×
Monthly cashflow live
- Estimated rent
- $1,370 high interval (Pro) →
- Mortgage (P&I)
- −$341
- Tax from tax record
- −$24 /mo · $288/yr
- Insurance
- −$27
- HOA
- −$0
- Vacancy / Maint / Mgmt
- −$288
- Net cashflow
- $691
Break-even live
Sensitivity live
| Price | -10% $727 | -5% $709 | +0% $691 | +5% $672 | +10% $654 |
|---|---|---|---|---|---|
| Rent | -10% $582 | -5% $636 | +0% $691 | +5% $745 | +10% $799 |
| Rate | -1.0pp $723 | -0.5pp $707 | base $691 | +0.5pp $674 | +1.0pp $657 |
UW: 25.0% down · 7.5% · 30yr · 1.5% tax · 5.0% vac · 8.0% maint · 8.0% mgmt
Financing live
Cash to close
- Down payment
- $16,238
- Closing costs
- $1,948
- Reserves months
- —
- Total cash needed
- —
Loan-product check · same deal, 3 products live
Conventional
25% down · 7.5% · 30yr
- Down + closing
- —
- Monthly P&I
- —
- Monthly cashflow
- —
- DSCR
- —
- Eligible?
- —
Personal DTI + credit; lowest rate.
DSCR
20% down · 8.5% · 30yr
- Down + closing
- —
- Monthly P&I
- —
- Monthly cashflow
- —
- DSCR
- —
- Eligible?
- —
No personal income docs; deal must DSCR.
Hard money
10% down · 12.0% · 12mo
- Down + closing
- —
- Monthly P&I
- —
- Monthly cashflow
- —
- DSCR
- —
- Eligible?
- —
Short-term bridge; refi at stabilization.
Rent comps 14 comps
| Address | Beds | Baths | Sqft | Rent | $/sqft | DOM | Units | Dist |
|---|---|---|---|---|---|---|---|---|
| 510 Schwartz St Mobile, AL | 3.0 | 2.0 | 1288 | $1,400 | $1.09 | 15d | 1 | 0.26mi |
| 423 Devon Dr Mobile, AL | 3.0 | 1.0 | 1220 | $950 | $0.78 | 46d | 1 | 0.30mi |
| 402 Havens St Mobile, AL | 4.0 | 2.0 | 960 | $1,350 | $1.41 | 15d | 1 | 0.34mi |
| 186 Stanton Rd Mobile, AL | 1.0–3.0 | 1.0–2.5 | 1263 | $2,450 | $1.94 | 46d | 1 | 0.83mi |
| 305 Indian Creek Dr E Unit 1043809P Mobile, AL | 3.0 | 2.5 | 1496 | $3,985 | $2.66 | 15d | 1 | 0.84mi |
| 2853 Josephine St Mobile, AL | 2.0 | 1.0 | 780 | $975 | $1.25 | 23d | 1 | 1.12mi |
| 2850 Edgewood St Mobile, AL | 2.0 | 1.0 | 816 | $1,000 | $1.23 | 23d | 1 | 1.14mi |
| 129 Shell Road Pl Unit 1043713P Mobile, AL | 4.0 | 2.0 | 1496 | $3,389 | $2.27 | 23d | 1 | 1.18mi |
| 107 Grand Blvd Mobile, AL | 2.0 | 2.0 | 1200 | $1,295 | $1.08 | 23d | 1 | 1.18mi |
| 672 Burden St Mobile, AL | 3.0 | 1.5 | 1421 | $1,300 | $0.91 | 23d | 1 | 1.22mi |
| 708 Bond St Mobile, AL | 3.0 | 1.0 | 1100 | $1,350 | $1.23 | 23d | 1 | 1.30mi |
| 156 Hemley Ave Mobile, AL | 3.0 | 1.0 | 936 | $1,195 | $1.28 | 46d | 1 | 1.42mi |
| 2604 Dauphin St #210 Mobile, AL | 2.0 | 1.0 | 950 | $1,150 | $1.21 | 23d | 1 | 1.43mi |
| 2604 Dauphin St Mobile, AL | 2.0 | 1.0 | 950 | $1,072 | $1.13 | 46d | 2 | 1.43mi |
Listing history 7 events
-
2026-06-21days on market $64,950 Active 9 DOM
-
2026-06-18days on market $64,950 Active 6 DOM
-
2026-06-17days on market $64,950 Active 5 DOM
-
2026-06-16days on market $64,950 Active 4 DOM
-
2026-06-15days on market $64,950 Active 3 DOM
-
2026-06-10remarks 699-char remark
-
2026-06-10$64,950 Active 1 DOM
ⓘ Source: listings_history table (triggers on properties + properties_extension) + one-shot
backfill from property_details.listing_events for pre-trigger history.
Tax reassessment forecast AL · Resets to sale price
- Current annual tax
- $288 · $24/mo
- Projected year-2 tax
- $288 · $24/mo
- Expected delta
- $0/yr ($0/mo · 0.0%)
ⓘ Screening estimate from a state-policy table — verify with the county assessor before closing.
Climate risk First Street
- Flood 1/10 Low FEMA zone X (unshaded) · 0% chance over 30 yrs
- Wildfire 1/10 Low
- Heat 9/10 Extreme 7 d/yr ≥104°F today · 21 d/yr by 30 yrs out
- Wind 9/10 Extreme 99% chance of damaging wind over 30 yrs
- Air quality 2/10 Low 1 unhealthy d/yr today · 1 by 30 yrs out
Nearby sold comps map
Loading sold comps map…
Walkable amenities ~0.75 mi
Loading nearby amenities…
Taxation est. · year 1
- Rental income
- $16,439
- − Mortgage interest
- −$3,638
- − Property taxes
- −$288
- − Insurance
- −$325
- − Repairs & maintenance
- −$1,315
- − Management
- −$1,315
- − Depreciation
- −$1,889
- Taxable income
- $7,668
- Est. tax owed @ 24.0%
- −$1,840
- After-tax cash flow
- $6,446/yr
For passive investors: Depreciation is non-cash, so a rental often shows a tax loss while cash-flowing — sheltering income. Rental losses are passive: they offset passive income freely, and up to $25,000/yr can offset ordinary (W-2) income if you actively participate and your MAGI is under $100k (phasing out to $0 by $150k); unused losses carry forward. On sale, claimed depreciation is recaptured at up to 25%, and gains may owe capital-gains tax (a 1031 exchange can defer both). Figures are a year-1 estimate at your 24.0% rate — not tax advice; consult a CPA.
Schools (NCES district)
- District
- Mobile County
- NCES district ID
- 0102370
- Math proficiency
- 15% ▼ -28.00%
- Reading proficiency
- 39% ▬ 0.00%
- Median HH income
- $42,455
- Composite
- 22.9/100
- National rank
- #8002
- State rank
- #81 of 129 in AL
Livability — Mobile
- Score
- 75/100
- State rank
- #20
- US rank
- #4262
Category grades
Schools grade is shown separately in the Schools card above.
Census & demographics
- Census place
- Mobile, AL
- City population
- 205,729
- Population (ZIP)
- 11,952
Population outlook (Mobile County) Hauer SSP2
- Today (2025)
- 415,303 people
- By 2030
- 411,755 · -0.9%
- By 2040
- 399,670 · -3.8%
- By 2050
- 382,616 · -7.9%
- By 2075
- 337,353 · -18.8%
- By 2100
- 283,391 · -31.8%
Race, ethnicity, and origin ACS 2023
- Neighborhood character
- Predominantly Black (97%)
- Race & ethnicity
- Black 97% White 2%
- Foreign-born
- 0%
Political lean MEDSL · Mobile
- 2024 margin
- R (+16.4) · D 41.3% · R 57.7%
- 2008→2024 swing
- -7.7pp toward R · 2008: -8.7pp · 2024: -16.4pp
- All cycles
- 2024: R+16.4 2020: R+11.9 2016: R+13.9 2012: R+9.3 2008: R+8.7
Not yet ingested
- Civics
- —
Market trends
- HPI YoY
- ▲ 4.78%
- Current HPI
- 128.8377
- Rent YoY
- —
- Metro
- —
- State GDP YoY
- ▲ 2.94%
- F500 in state
- 4
Industry mix (Fortune 500 HQ in AL)
| Industry | F500 HQs | Revenue |
|---|---|---|
| Financial Services | 1 | $8B |
|
||
| Healthcare | 1 | $5B |
|
||
Price history
1 event — show timeline
- 2026-06-10 Listed $64,950 GCMLS AL
Property tax history
-3.8%/yrLatest (2025): $288 · +0.0% YoY. Source: county tax records.
Cash-flow waterfall
monthlySold comps — $/sqft
last 12 mo · ≤1 miLoading sold comps…