2017 Lyons St · San Antonio, TX
Flood risk 1/10 · Minimal
- FEMA flood zone
- X (unshaded)
- Chance of flooding over 30 yrs
- 0.0%
- Est. flood insurance / yr
- $507 – $1,088
Fire risk 1/10 · Minimal
- Est. fire insurance / yr
- $1,222 – $2,270
Heat risk 8/10 · Major
- Hot days now (above 109°F)
- 7 days/yr
- Hot days in 30 yrs
- 22 days/yr
Wind risk 6/10 · Moderate
- Chance of severe wind over 30 yrs
- 77.0%
Air-quality risk 2/10 · Minimal
- Unhealthy air days now
- 1 days/yr
- Unhealthy air days in 30 yrs
- 2 days/yr
Risk factors via First Street. Map © Google.
Why this score? — see what drove the D grade
The composite is a weighted blend of 9 inputs, each scored 0–100. Each bar is that input's sub-score; the figure is the points it added to the 100-point composite (weight × sub-score).
- Cash flow +11.9/30.0
- Appreciation +10.0/10.0
- Rent growth +4.4/5.0
- Livability +4.0/5.0
- DSCR +3.5/10.0
- 1% rule +3.3/10.0
- Condition / age +2.5/5.0
- Schools +1.4/10.0
- ARV discount +1.2/15.0
$114,800
🖨 Deal sheet 📄 Offer letter ✓ Due diligence
Listing remarks MLS
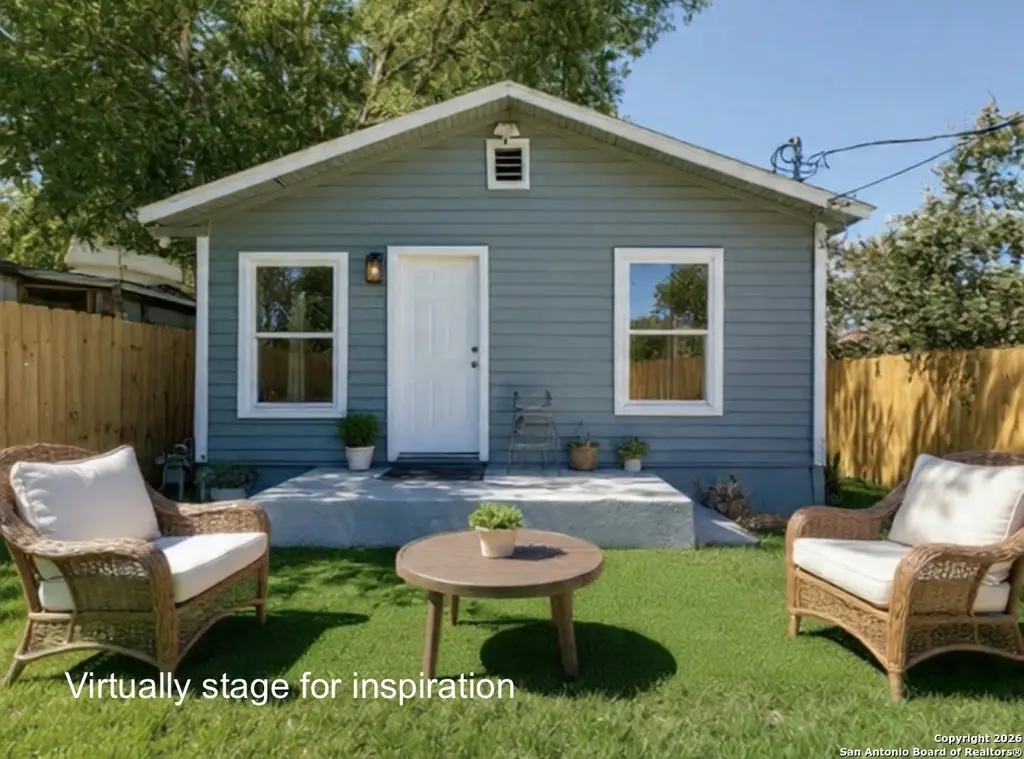
Looking for an upgraded home that's easy to love? This one checks all the boxes. Open layout, custom cabinets, new flooring, upgraded A/C, and a private front and backyard fence-ready for everyday living and weekend hangouts. Virtual staged photos are included for inspiration and layout ideas so you can picture your furniture and style in the space. Close to parks, green spaces, and just a short drive to Downtown San Antonio! Perfect start at home!
Key facts
- Close to parks
- Custom cabinets
- New flooring
Tags
Neighborhood map
What this means for you Summary
Snapshot
- This is a 2-bed/1.0-bath single-family listed at $115k.
Deal economics
- At list price, monthly cash flow is $-29 ($-347/yr) — negative.
- To cash-flow at today's rent, offer at most $110k (4.4% below list).
- To meet the 1% rule (rent ≥ 1% of price), the offer needs to be $95k (16.9% below list).
- Recommended offer: $95k (16.9% below list) — sets the bar for 1% rule.
- Cap rate 6.0% vs local median 3.8% in San Antonio — top-decile yield for the area; either an underpriced asset or a hidden risk that comps aren't pricing in. Stress-test before assuming the spread holds.
Location & tenants
- Location reads 80/100 on livability (#31 in TX, #1,616 nationally) — a professional / high-income tenant draw. Strengths: amenities A+, commute A+, cost of living A+; Watch: schools C-, crime F.
- San Antonio ISD (urban): math 12% / reading 22% proficiency, ranked #805 of 826 in TX (top 98%) — low school quality limits family demand, transient renter base, plan for 1-2y turnover; 80% free/reduced lunch — lower-income household profile, screen leases tightly.
- Market conditions: Rents rising fast (+7.7%/yr); 154 active listings in the ZIP; 28 comparable units currently listed for rent nearby; rentals at typical pace (median 24d on market — plan ~3-4 weeks tenant-placement turnaround); lower-income renter base — watch delinquency; 8,308 units permitted in Bexar County in 2024 (2,506 in 5+ unit buildings).
- This rent runs 35% of the median local income ($32k/yr) — at the standard rent-burdened threshold; future hikes will face affordability resistance.
Forward outlook
- In year one you build about $12k of equity ($794 loan paydown + $11k appreciation (10.0% local appreciation)).
- Bexar County population projected at +50% by 2050 — long-run rental-demand tailwind backs the buy-and-hold thesis.
- At projected returns (10.0% appreciation + 7.7% rent growth), your $32k cash investment doubles in ~3 years — after that, you're playing with house money.
- By year 3, paydown + projected appreciation supports a ~$31k cash-out refi (75% LTV) — recoverable capital for the next deal without selling this one.
Negotiation context
- It's been on market 155 days — a 12% lower offer ($101k) is reasonable based on typical stale-listing flexibility.
- 10 sale attempts since 20y ago; this cycle's ask is 7553% above the opening price — seller raised mid-cycle; expect resistance to lowballs.
Risks & watch-outs
- Watch-outs: built in 1943 — expect roof / HVAC / electrical / plumbing capex.
- Climate carrying-cost: major wind risk, 77% chance of damaging wind over 30y; extreme-heat days projected 7→22/yr by 2055 (HVAC capex compounding) — expect insurance premiums to compound above CPI over the hold.
Questions for the listing agent
- What do current leases actually rent for vs. the listed asking? Can we see a recent rent roll and the last 12 months of T-12 income?
- It's been on market 155 days. Have you received any prior offers? Is the seller open to a 17% concession, seller financing, or rate buy-down credit?
- Built in 1943 — when were the roof, HVAC, electrical panel, plumbing, and water heater last replaced?
- Why hasn't it sold? Are there any deal-killer items the seller is aware of (foundation, flood, title, zoning, code violations)?
- Is there a deadline driving the sale (1031 exchange, divorce, estate, relocation)? That informs how much negotiation room exists.
- Crime grade is F in this area — have there been break-ins, vandalism, or insurance claims at this property in the last 3 years? What carrier currently insures it and at what premium?
- The area grade is low — what's the realistic commute time and amenity access for the typical tenant pool here? Any planned neighborhood developments (good or bad) we should know about?
- What's the average days-on-market for RENTAL listings here right now (not sales)? A rising rental-DOM trend means longer vacancies and softer asking-rent achievability than the comps imply.
- What's the recent tenant-quality profile in this submarket — average credit score on applications, eviction rate, late-payment / NSF rate, and stable-employment percentage? A property-management company in the area should have these aggregated.
- How much new for-sale + rental construction is in the pipeline within 1–3 miles? Heavy new supply typically softens prices + rents 12–24 months out; constrained supply supports both.
Investment metrics
- 1% rule
- 0.83% ✗
- Cap rate
- 5.99%
- Cash-on-cash
- -1.08%
- DSCR
- 0.95
- GRM
- 10.0
CMA / ARV
- ARV (median comp)
- $100,634
- List price
- $114,800
- Delta
- 14.08%
- Verdict
- OVERPRICED
- Comps
- 20 within 1.0 mi
Show comp detail 12 sales within ~0.75 mi
| Address | Dist | Beds/Ba | Sqft | Sold | Price | $/sf | Match |
|---|---|---|---|---|---|---|---|
| 1418 Rivas | 0.29mi | 2/1.0 | 696 (-1%) | 2mo | $139,900 | $201 | 84 |
| 2039 Lyons | 0.07mi | 2/1.0 | 672 (-4%) | 10mo | $65,000 | $97 | 82 |
| 1524 Delgado | 0.31mi | 2/1.0 | 720 (+3%) | 16mo | $75,000 | $104 | 68 |
| 3806 W Martin | 0.64mi | 2/1.0 | 672 (-4%) | 1mo | $93,000 | $138 | 62 |
| 1046 Lombrano St | 0.34mi | 2/1.0 | 618 (-12%) | 3mo | $149,500 | $242 | 62 |
| 919 Monclova Aly | 0.30mi | 3/1.0 (+1) | 650 (-7%) | 8mo | $94,900 | $146 | 62 |
| 1710 Ruiz St | 0.21mi | 2/1.0 | 757 (+8%) | 18mo | $90,000 | $119 | 61 |
| 148 Henry | 0.29mi | 2/1.0 | 794 (+13%) | 6mo | $37,500 | $47 | 59 |
| 1414 Rivas | 0.27mi | 2/1.0 | 600 (-14%) | 9mo | $85,000 | $142 | 56 |
| 511 N Spring St | 0.46mi | 1/1.0 (-1) | 658 (-6%) | 10mo | $90,000 | $137 | 55 |
| 1618 N Hamilton | 0.36mi | 2/1.0 | 604 (-14%) | 10mo | $100,000 | $166 | 52 |
| 2303 Arbor Pl | 0.69mi | 2/1.0 | 791 (+13%) | 16mo | $185,000 | $234 | 33 |
Match score weights: distance 35% · size 25% · config 20% · recency 20%. Top-matched comps best support the ARV.
Projected returns pro-forma
10.0% appreciation · 7.73% rent growth · sell at horizon
- IRR
- 25.1%
- Equity multiple
- 3.04×
- Total profit
- $65,445
- Equity at exit
- $103,421
- IRR
- 23.4%
- Equity multiple
- 7.40×
- Total profit
- $205,846
- Equity at exit
- $223,031
Cash invested: $32,144 (down + closing). Projections, not guarantees.
Landlord ↔ Tenant lean methodology
- Overall (STATE)
- 87 Strongly Landlord-Friendly
- State Texas
- 87 Strongly Landlord-Friendly · R+5
- County
- — inherits STATE
- City
- — inherits STATE
ZIP-level market 78207
- Home prices YoY
- 15.2%
- Rents YoY
- 7.7%
- Active inventory
- 154
- Price-to-rent
- 10.0×
Monthly cashflow live
- Estimated rent
- $954 high interval (Pro) →
- Mortgage (P&I)
- −$602
- Tax from tax record
- −$133 /mo · $1,590/yr
- Insurance
- −$48
- HOA
- −$0
- Vacancy / Maint / Mgmt
- −$200
- Net cashflow
- $-29
Break-even live
UW: 25.0% down · 7.5% · 30yr · 1.5% tax · 5.0% vac · 8.0% maint · 8.0% mgmt
Financing live
Cash to close
- Down payment
- $28,700
- Closing costs
- $3,444
- Reserves months
- —
- Total cash needed
- —
Loan-product check · same deal, 3 products live
Conventional
25% down · 7.5% · 30yr
- Down + closing
- —
- Monthly P&I
- —
- Monthly cashflow
- —
- DSCR
- —
- Eligible?
- —
Personal DTI + credit; lowest rate.
DSCR
20% down · 8.5% · 30yr
- Down + closing
- —
- Monthly P&I
- —
- Monthly cashflow
- —
- DSCR
- —
- Eligible?
- —
No personal income docs; deal must DSCR.
Hard money
10% down · 12.0% · 12mo
- Down + closing
- —
- Monthly P&I
- —
- Monthly cashflow
- —
- DSCR
- —
- Eligible?
- —
Short-term bridge; refi at stabilization.
Rent comps 28 comps
| Address | Beds | Baths | Sqft | Rent | $/sqft | DOM | Units | Dist |
|---|---|---|---|---|---|---|---|---|
| 1033 Rivas St #301 San Antonio, TX | 2.0 | 1.0 | 640 | $895 | $1.40 | 10d | 1 | 0.27mi |
| 1033 Rivas St #301 San Antonio, TX | 2.0 | 1.0 | 640 | $925 | $1.45 | 43d | 1 | 0.27mi |
| 1820 Ruiz St San Antonio, TX | 1.0 | 1.0 | 504 | $750 | $1.49 | 2d | 1 | 0.27mi |
| 816 Rivas St San Antonio, TX | 1.0 | 1.0 | 500 | $750 | $1.50 | 16d | 1 | 0.57mi |
| 816 Rivas St San Antonio, TX | 1.0 | 1.0 | 500 | $750 | $1.50 | 4d | 1 | 0.57mi |
| 816 Rivas St Unit A San Antonio, TX | 2.0 | 1.0 | 650 | $799 | $1.23 | 23d | 1 | 0.57mi |
| 816 Rivas St Unit C San Antonio, TX | 2.0 | 1.0 | 500 | $750 | $1.50 | 43d | 1 | 0.57mi |
| 1218 NW 23rd St Unit 2 San Antonio, TX | 1.0 | 10.5 | 548 | $950 | $1.73 | 23d | 1 | 0.64mi |
| 321 N Chupaderas St Unit 101 San Antonio, TX | 1.0 | 1.0 | 410 | $790 | $1.93 | 43d | 1 | 0.74mi |
| 2503 Arbor Pl San Antonio, TX | 2.0 | 1.0 | 750 | $800 | $1.07 | 43d | 1 | 0.85mi |
| 1750 W Craig Pl San Antonio, TX | 1.0 | 1.0 | 420 | $990 | $2.36 | 43d | 1 | 0.88mi |
| 107 Beso Ln Unit 107-BL San Antonio, TX | 1.0 | 1.0 | 528 | $850 | $1.61 | 23d | 1 | 0.92mi |
| 2403 N Elmendorf St San Antonio, TX | 1.0 | 1.0 | 650 | $1,175 | $1.81 | 23d | 1 | 0.93mi |
| 107 Jesus Aly Unit 4 San Antonio, TX | 2.0 | 1.0 | 400 | $800 | $2.00 | 4d | 1 | 1.07mi |
| 107 Jesus Aly Unit 1 San Antonio, TX | 1.0 | 1.0 | 450 | $700 | $1.56 | 17d | 1 | 1.08mi |
| 216 University Ave Unit 102 San Antonio, TX | 2.0 | 2.0 | 692 | $1,295 | $1.87 | 12d | 1 | 1.15mi |
| 703 N San Marcos San Antonio, TX | 1.0 | 1.0 | 700 | $716 | $1.02 | 43d | 1 | 1.31mi |
| 1635 W Mulberry Ave #208 San Antonio, TX | 1.0 | 1.0 | 700 | $1,450 | $2.07 | 1d | 1 | 1.32mi |
| 1635 W Mulberry Ave #207 San Antonio, TX | 1.0 | 1.0 | 700 | $1,450 | $2.07 | 43d | 1 | 1.32mi |
| 116 Cornell Ave San Antonio, TX | 1.0 | 1.0 | 576 | $899 | $1.56 | 43d | 1 | 1.34mi |
| 1100 N Frio St Apt 403 San Antonio, TX | 1.0 | 1.0 | 500 | $1,100 | $2.20 | 43d | 1 | 1.42mi |
| 2721 Colima St San Antonio, TX | 2.0 | 1.0 | 700 | $1,250 | $1.79 | 14d | 1 | 1.45mi |
| 910 N Frio St San Antonio, TX | 1.0 | 1.0 | 700 | $1,043 | $1.49 | 43d | 1 | 1.47mi |
| 1026 W French Pl #3 San Antonio, TX | 1.0 | 1.0 | 700 | $825 | $1.18 | 20d | 1 | 1.47mi |
| 1020 W French Pl San Antonio, TX | 1.0 | 1.0 | 660 | $1,050 | $1.59 | 23d | 1 | 1.48mi |
| 1802 W Gramercy Pl Unit 1 San Antonio, TX | 2.0 | 1.0 | 700 | $895 | $1.28 | 3d | 1 | 1.48mi |
| 1802 W Gramercy Pl Unit 1 San Antonio, TX | 2.0 | 1.0 | 700 | $895 | $1.28 | 20d | 1 | 1.48mi |
| 3017 Colima St San Antonio, TX | 1.0 | 1.0 | 480 | $800 | $1.67 | 43d | 1 | 1.48mi |
Listing history 48 events
-
2026-06-18days on market $114,800 Active 155 DOM
-
2026-06-17days on market $114,800 Active 154 DOM
-
2026-06-16days on market $114,800 Active 153 DOM
-
2026-06-15days on market $114,800 Active 152 DOM
-
2026-06-13days on market $114,800 Active 150 DOM
-
2026-06-09days on market $114,800 Active 146 DOM
-
2026-06-08days on market $114,800 Active 145 DOM
-
2026-06-07days on market $114,800 Active 144 DOM
-
2026-06-04days on market $114,800 Active 141 DOM
-
2026-06-03days on market $114,800 Active 140 DOM
-
2026-06-02days on market $114,800 Active 139 DOM
-
2026-06-01days on market $114,800 Active 138 DOM
-
2026-05-31days on market $114,800 Active 137 DOM
-
2026-05-10price $114,800 452-char remark
Show marketing remark (452 chars)
Looking for an upgraded home that's easy to love? This one checks all the boxes. Open layout, custom cabinets, new flooring, upgraded A/C, and a private front and backyard fence-ready for everyday living and weekend hangouts. Virtual staged photos are included for inspiration and layout ideas so you can picture your furniture and style in the space. Close to parks, green spaces, and just a short drive to Downtown San Antonio! Perfect start at home!
-
2026-03-30price $114,999 452-char remark
Show marketing remark (452 chars)
Looking for an upgraded home that's easy to love? This one checks all the boxes. Open layout, custom cabinets, new flooring, upgraded A/C, and a private front and backyard fence-ready for everyday living and weekend hangouts. Virtual staged photos are included for inspiration and layout ideas so you can picture your furniture and style in the space. Close to parks, green spaces, and just a short drive to Downtown San Antonio! Perfect start at home!
-
2026-03-26price $115,000 452-char remark
Show marketing remark (452 chars)
Looking for an upgraded home that's easy to love? This one checks all the boxes. Open layout, custom cabinets, new flooring, upgraded A/C, and a private front and backyard fence-ready for everyday living and weekend hangouts. Virtual staged photos are included for inspiration and layout ideas so you can picture your furniture and style in the space. Close to parks, green spaces, and just a short drive to Downtown San Antonio! Perfect start at home!
-
2026-03-08price $117,000 452-char remark
Show marketing remark (452 chars)
Looking for an upgraded home that's easy to love? This one checks all the boxes. Open layout, custom cabinets, new flooring, upgraded A/C, and a private front and backyard fence-ready for everyday living and weekend hangouts. Virtual staged photos are included for inspiration and layout ideas so you can picture your furniture and style in the space. Close to parks, green spaces, and just a short drive to Downtown San Antonio! Perfect start at home!
-
2026-02-14price $118,999 452-char remark
Show marketing remark (452 chars)
Looking for an upgraded home that's easy to love? This one checks all the boxes. Open layout, custom cabinets, new flooring, upgraded A/C, and a private front and backyard fence-ready for everyday living and weekend hangouts. Virtual staged photos are included for inspiration and layout ideas so you can picture your furniture and style in the space. Close to parks, green spaces, and just a short drive to Downtown San Antonio! Perfect start at home!
-
2026-02-04$1,500
-
2026-01-14$119,000 New 452-char remark
Show marketing remark (452 chars)
Looking for an upgraded home that's easy to love? This one checks all the boxes. Open layout, custom cabinets, new flooring, upgraded A/C, and a private front and backyard fence-ready for everyday living and weekend hangouts. Virtual staged photos are included for inspiration and layout ideas so you can picture your furniture and style in the space. Close to parks, green spaces, and just a short drive to Downtown San Antonio! Perfect start at home!
-
2025-12-31historical
-
2025-12-03price $99,999
-
2025-10-25price $118,900
-
2025-10-10price $119,000
-
2025-10-05price $124,000
-
2025-08-31price $124,899
-
2025-08-16price $124,900
-
2025-07-25$130,000 New
-
2025-04-07soldstatus
-
2025-04-04soldstatus Sold
-
2025-03-24historical Active Option
-
2025-03-20price $45,000
-
2025-03-20status Back on Market
-
2025-03-12historical Active Option
-
2025-03-06status Back on Market
-
2025-03-05historical
-
2025-03-04status Back on Market
-
2025-01-31historical
-
2024-12-22price $69,000
-
2024-12-21$65,000 New
-
2023-05-30historical
-
2023-05-23historical Active Option
-
2022-07-08$96,300 New
-
2010-12-01historical
-
2010-08-03$29,500
-
2006-12-07soldstatus
-
2006-12-06soldstatus
-
2006-11-10$29,900
ⓘ Source: listings_history table (triggers on properties + properties_extension) + one-shot
backfill from property_details.listing_events for pre-trigger history.
Tax reassessment forecast TX · Resets to sale price
- Current annual tax
- $1,590 · $133/mo
- Projected year-2 tax
- $2,101 · $175/mo
- Expected delta
- +$510/yr (+$43/mo · 32.1%)
ⓘ Screening estimate from a state-policy table — verify with the county assessor before closing.
Climate risk First Street
- Flood 1/10 Low FEMA zone X (unshaded) · 0% chance over 30 yrs
- Wildfire 1/10 Low
- Heat 8/10 Severe 7 d/yr ≥109°F today · 22 d/yr by 30 yrs out
- Wind 6/10 Major 77% chance of damaging wind over 30 yrs
- Air quality 2/10 Low 1 unhealthy d/yr today · 2 by 30 yrs out
Nearby sold comps map
Loading sold comps map…
Walkable amenities ~0.75 mi
Loading nearby amenities…
Taxation est. · year 1
- Rental income
- $11,445
- − Mortgage interest
- −$6,431
- − Property taxes
- −$1,590
- − Insurance
- −$574
- − Repairs & maintenance
- −$916
- − Management
- −$916
- − Depreciation
- −$3,340
- Taxable loss
- −$2,321
- Est. tax savings @ 24.0%
- +$557
- After-tax cash flow
- $210/yr
For passive investors: Depreciation is non-cash, so a rental often shows a tax loss while cash-flowing — sheltering income. Rental losses are passive: they offset passive income freely, and up to $25,000/yr can offset ordinary (W-2) income if you actively participate and your MAGI is under $100k (phasing out to $0 by $150k); unused losses carry forward. On sale, claimed depreciation is recaptured at up to 25%, and gains may owe capital-gains tax (a 1031 exchange can defer both). Figures are a year-1 estimate at your 24.0% rate — not tax advice; consult a CPA.
Schools (NCES district)
- District
- San Antonio ISD
- NCES district ID
- 4838730
- Math proficiency
- 12% ▼ -21.00%
- Reading proficiency
- 22% ▼ -7.00%
- Median HH income
- $30,952
- Composite
- 13.57/100
- National rank
- #9512
- State rank
- #805 of 826 in TX
Livability — San Antonio
- Score
- 80/100
- State rank
- #31
- US rank
- #1616
Category grades
Schools grade is shown separately in the Schools card above.
Census & demographics
- Census place
- San Antonio, TX
- County
- Bexar County · 1,990,555 people
- City population
- 1,806,925
- Metro
- San Antonio-New Braunfels, TX
- Population (ZIP)
- 55,474
- Household income
- $32,472
- Rent vs Own
- Severe rent burden
- 2789.0
Population outlook (Bexar County) Hauer SSP2
- Today (2025)
- 2,336,851 people
- By 2030
- 2,560,728 · +9.6%
- By 2040
- 3,020,569 · +29.3%
- By 2050
- 3,493,522 · +49.5%
- By 2075
- 4,668,459 · +99.8%
- By 2100
- 5,533,242 · +136.8%
Race, ethnicity, and origin ACS 2023
- Neighborhood character
- Predominantly Hispanic (88%)
- Race & ethnicity
- Hispanic / Latino 88% Two or more races 41% White 6% Black 5% Native American 2%
- Hispanic origin (detail)
- Mexican 79%
- Foreign-born
- 19% · Canada
- Languages at home
- 39% English-only · Spanish 60%
Political lean MEDSL · Bexar
- 2024 margin
- Lean D (+9.8) · D 54.3% · R 44.6% · Other 1.1%
- 2008→2024 swing
- +4.2pp toward D · 2008: 5.6pp · 2024: 9.8pp
- All cycles
- 2024: D+9.8 2020: D+18.2 2016: D+13.5 2012: D+4.6 2008: D+5.6
Not yet ingested
- Civics
- —
Market trends
- HPI YoY
- ▲ 34.92%
- Current HPI
- 264.7559
- Rent YoY
- ▲ 7.73%
- Metro
- San Antonio-New Braunfels, TX
- State GDP YoY
- ▲ 3.95%
- F500 in state
- 110
Industry mix (Fortune 500 HQ in TX)
| Industry | F500 HQs | Revenue |
|---|---|---|
| Energy | 16 | $1,198B |
|
||
| Technology | 5 | $198B |
|
||
| Engineering / Construction | 4 | $72B |
|
||
| Energy Services | 3 | $60B |
|
||
| Utilities | 3 | $41B |
|
||
| Healthcare | 2 | $330B |
|
||
Price history
+283.9% since first listed35 events — show timeline
- 2026-05-10 Price Changed $114,800 LERA
- 2026-03-30 Price Changed $114,999 LERA
- 2026-03-26 Price Changed $115,000 LERA
- 2026-03-08 Price Changed $117,000 LERA
- 2026-02-14 Price Changed $118,999 LERA
- 2026-02-04 Listed for Rent $1,500 SABOR
- 2026-01-14 Listed $119,000 LERA
- 2025-12-31 Listing Removed — LERA
- 2025-12-03 Price Changed $99,999 LERA
- 2025-10-25 Price Changed $118,900 LERA
- 2025-10-10 Price Changed $119,000 LERA
- 2025-10-05 Price Changed $124,000 LERA
- 2025-08-31 Price Changed $124,899 LERA
- 2025-08-16 Price Changed $124,900 LERA
- 2025-07-25 Listed $130,000 LERA
- 2025-04-07 Sold (Public Records) — Public Records
- 2025-04-04 Sold (MLS) — LERA
- 2025-03-24 Contingent — LERA
- 2025-03-20 Price Changed $45,000 LERA
- 2025-03-20 Relisted — LERA
- 2025-03-12 Contingent — LERA
- 2025-03-06 Relisted — LERA
- 2025-03-05 Listing Removed — LERA
- 2025-03-04 Relisted — LERA
- 2025-01-31 Listing Removed — LERA
- 2024-12-22 Price Changed $69,000 LERA
- 2024-12-21 Listed $65,000 LERA
- 2023-05-30 Listing Removed — LERA
- 2023-05-23 Contingent — LERA
- 2022-07-08 Listed $96,300 LERA
- 2010-12-01 Listing Removed — LERA
- 2010-08-03 Listed $29,500 LERA
- 2006-12-07 Sold (Public Records) — Public Records
- 2006-12-06 Sold (MLS) — LERA
- 2006-11-10 Listed $29,900 LERA
Property tax history
+5.6%/yrLatest (2025): $1,590 · -4.1% YoY. Source: county tax records.
Cash-flow waterfall
monthlySold comps — $/sqft
last 12 mo · ≤1 miLoading sold comps…