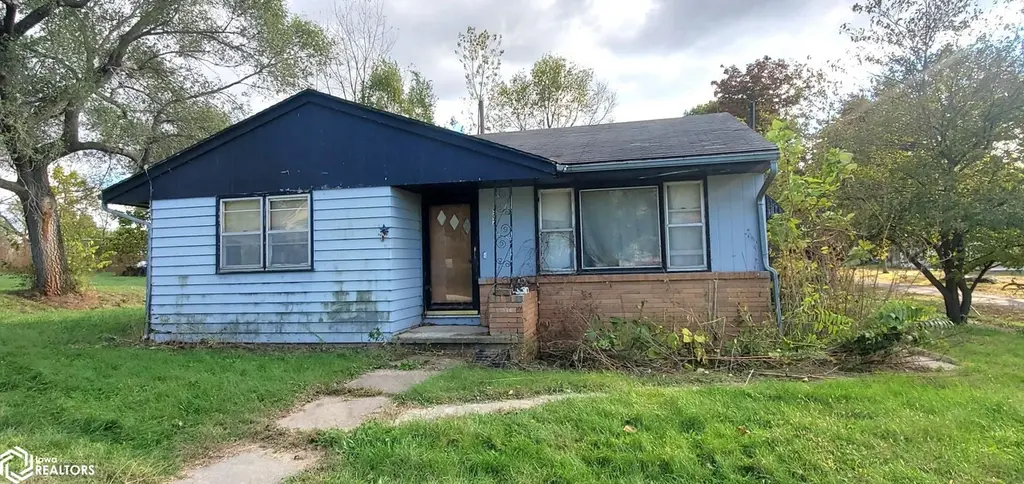
507 King St · Blockton, IA
Flood risk 1/10 · Minimal
- FEMA flood zone
- X (unshaded)
- Chance of flooding over 30 yrs
- 0.0%
- Est. flood insurance / yr
- $473 – $860
Fire risk 1/10 · Minimal
- Est. fire insurance / yr
- $902 – $1,676
Heat risk 3/10 · Minor
- Hot days now (above 104°F)
- 7 days/yr
- Hot days in 30 yrs
- 15 days/yr
Wind risk 2/10 · Minimal
- Chance of severe wind over 30 yrs
- —
Air-quality risk 1/10 · Minimal
- Unhealthy air days now
- 0 days/yr
- Unhealthy air days in 30 yrs
- 0 days/yr
Risk factors via First Street. Map © Google.
Why this score? — see what drove the C- grade
The composite is a weighted blend of 9 inputs, each scored 0–100. Each bar is that input's sub-score; the figure is the points it added to the 100-point composite (weight × sub-score).
- Cash flow +15.0/30.0
- ARV discount +7.5/15.0
- Schools +7.0/10.0
- 1% rule +5.0/10.0
- DSCR +5.0/10.0
- Appreciation +5.0/10.0
- Livability +2.9/5.0
- Rent growth +2.5/5.0
- Condition / age +2.5/5.0
$21,900
🖨 Deal sheet 📄 Offer letter ✓ Due diligence
Listing remarks
This 2-3 bedroom home needs cleaned out and a few updates & repairs, but is an excellent opportunity for some quick sweat equity. The sensible floor plan is sure to please, and the dry basement offers a non conforming 3rd bedroom or whatever you wish. The garage may be best torn down and start over, but you can be the judge there. The home sits on a nice level corner lot in a nice quiet small town.
Key facts
- Level corner lot
- Dry basement
- 2,614 sq ft lot
Tags
Property features AI
Exterior
- Parking: Attached garage (1 car)
- Utilities: Electric with fuses; Public sewer
- Home design: Single-family residence; Residential property
- Construction: HardiPlank and wood siding exterior
- Exterior features: Lot approximately 23' x 119' (about 0.06 acres)
Interior
- Kitchen: Range; Refrigerator
- Bathrooms: 1 full bathroom; 1 three-quarter bathroom
- Heating & cooling: Forced air heating; Window unit cooling
- Interior features: Range; Refrigerator; Basement
Neighborhood map
What this means for you Summary
Snapshot
- This is a 2-bed/2.0-bath single-family listed at $22k.
Deal economics
- At list price, monthly cash flow is $687 ($8k/yr) — positive.
- The deal already cash-flows at list — no discount required.
- Meets the 1% rule at list price ($1k rent vs $22k).
- Recommended offer: $19k (12.0% below list) — sets the bar for market timing.
Location & tenants
- Location reads 57/100 on livability (#907 in IA) — a working-class tenant base; expect higher turnover. Strengths: cost of living A+, housing A+; Watch: crime C-, schools D-, amenities F.
- Bedford Community School District (rural): math 81% / reading 85% proficiency, ranked #23 of 289 in IA (top 8%) — strong family-tenant draw, lease renewals of 3-5y typical.
- Market conditions: 5 active listings in the ZIP; 4 units permitted in Taylor County in 2024 (0 in 5+ unit buildings).
Forward outlook
- In year one you build about $808 of equity ($151 loan paydown + $657 appreciation (3.0% local appreciation)).
- At projected returns (3.0% appreciation + 3.0% rent growth), your $6k cash investment doubles in ~1 year — after that, you're playing with house money.
Negotiation context
- It's been on market 231 days — a 12% lower offer ($19k) is reasonable based on typical stale-listing flexibility.
Questions for the listing agent
- It's been on market 231 days. Have you received any prior offers? Is the seller open to a 12% concession, seller financing, or rate buy-down credit?
- Built in 1962 — when were the roof, HVAC, electrical panel, plumbing, and water heater last replaced?
- Why hasn't it sold? Are there any deal-killer items the seller is aware of (foundation, flood, title, zoning, code violations)?
- Is there a deadline driving the sale (1031 exchange, divorce, estate, relocation)? That informs how much negotiation room exists.
- Schools are D-rated, which usually means shorter tenancies and higher turnover. Who's the typical renter profile here, and what's been the actual vacancy rate?
- What's the average days-on-market for RENTAL listings here right now (not sales)? A rising rental-DOM trend means longer vacancies and softer asking-rent achievability than the comps imply.
- What's the recent tenant-quality profile in this submarket — average credit score on applications, eviction rate, late-payment / NSF rate, and stable-employment percentage? A property-management company in the area should have these aggregated.
- How much new for-sale + rental construction is in the pipeline within 1–3 miles? Heavy new supply typically softens prices + rents 12–24 months out; constrained supply supports both.
Investment metrics
- 1% rule
- 4.85% ✓
- Cap rate
- 43.96%
- Cash-on-cash
- 134.53%
- DSCR
- 6.99
- GRM
- 1.7
CMA / ARV
No comps found within radius.
Projected returns pro-forma
3.0% appreciation · 3.0% rent growth · sell at horizon
- IRR
- —
- Equity multiple
- 8.57×
- Total profit
- $46,439
- Equity at exit
- $9,847
- IRR
- —
- Equity multiple
- 17.96×
- Total profit
- $103,981
- Equity at exit
- $15,176
Cash invested: $6,132 (down + closing). Projections, not guarantees.
Landlord ↔ Tenant lean methodology
- Overall (STATE)
- 83 Strongly Landlord-Friendly
- State Iowa
- 83 Strongly Landlord-Friendly · R+6
- County
- — inherits STATE
- City
- — inherits STATE
ZIP-level market 50836
- Active inventory
- 5
- Price-to-rent
- 1.7×
Monthly cashflow live
- Estimated rent
- $1,062 medium interval (Pro) →
- Mortgage (P&I)
- −$115
- Tax est. 1.5%
- −$27 /mo · $328/yr
- Insurance
- −$9
- HOA
- −$0
- Vacancy / Maint / Mgmt
- −$223
- Net cashflow
- $687
Break-even live
UW: 25.0% down · 7.5% · 30yr · 1.5% tax · 5.0% vac · 8.0% maint · 8.0% mgmt
Financing live
Cash to close
- Down payment
- $5,475
- Closing costs
- $657
- Reserves months
- —
- Total cash needed
- —
Loan-product check · same deal, 3 products live
Conventional
25% down · 7.5% · 30yr
- Down + closing
- —
- Monthly P&I
- —
- Monthly cashflow
- —
- DSCR
- —
- Eligible?
- —
Personal DTI + credit; lowest rate.
DSCR
20% down · 8.5% · 30yr
- Down + closing
- —
- Monthly P&I
- —
- Monthly cashflow
- —
- DSCR
- —
- Eligible?
- —
No personal income docs; deal must DSCR.
Hard money
10% down · 12.0% · 12mo
- Down + closing
- —
- Monthly P&I
- —
- Monthly cashflow
- —
- DSCR
- —
- Eligible?
- —
Short-term bridge; refi at stabilization.
Listing history 18 events
-
2026-06-18days on market $21,900 Active 231 DOM
-
2026-06-17days on market $21,900 Active 230 DOM
-
2026-06-16days on market $21,900 Active 229 DOM
-
2026-06-15days on market $21,900 Active 228 DOM
-
2026-06-13days on market $21,900 Active 226 DOM
-
2026-06-12pricedays on market $21,900 Active 225 DOM
-
2026-06-09pricestatusdays on market $19,900 Active 222 DOM
-
2026-06-08days on market $18,500 Active Under Contract 221 DOM
-
2026-06-07days on market $18,500 Active Under Contract 220 DOM
-
2026-06-05days on market $18,500 Active Under Contract 218 DOM
-
2026-06-04days on market $18,500 Active Under Contract 216 DOM
-
2026-06-02days on market $18,500 Active Under Contract 215 DOM
-
2026-06-01days on market $18,500 Active Under Contract 214 DOM
-
2026-05-31days on market $18,500 Active Under Contract 213 DOM
-
2026-05-31days on market $18,500 Active Under Contract 212 DOM
-
2026-02-02historical Active Under Contract
-
2025-12-15price $18,500
-
2025-10-30$22,500 Active
ⓘ Source: listings_history table (triggers on properties + properties_extension) + one-shot
backfill from property_details.listing_events for pre-trigger history.
Climate risk First Street
- Flood 1/10 Low FEMA zone X (unshaded) · 0% chance over 30 yrs
- Wildfire 1/10 Low
- Heat 3/10 Moderate 7 d/yr ≥104°F today · 15 d/yr by 30 yrs out
- Wind 2/10 Low
- Air quality 1/10 Low 0 unhealthy d/yr today · 0 by 30 yrs out
Nearby sold comps map
Loading sold comps map…
Walkable amenities ~0.75 mi
Loading nearby amenities…
Taxation est. · year 1
- Rental income
- $12,741
- − Mortgage interest
- −$1,227
- − Property taxes
- −$328
- − Insurance
- −$110
- − Repairs & maintenance
- −$1,019
- − Management
- −$1,019
- − Depreciation
- −$637
- Taxable income
- $8,401
- Est. tax owed @ 24.0%
- −$2,016
- After-tax cash flow
- $6,233/yr
For passive investors: Depreciation is non-cash, so a rental often shows a tax loss while cash-flowing — sheltering income. Rental losses are passive: they offset passive income freely, and up to $25,000/yr can offset ordinary (W-2) income if you actively participate and your MAGI is under $100k (phasing out to $0 by $150k); unused losses carry forward. On sale, claimed depreciation is recaptured at up to 25%, and gains may owe capital-gains tax (a 1031 exchange can defer both). Figures are a year-1 estimate at your 24.0% rate — not tax advice; consult a CPA.
Schools (NCES district)
- District
- Bedford Community School District
- NCES district ID
- 1904560
- Math proficiency
- 81% ▬ 0.00%
- Reading proficiency
- 85% ▲ 3.00%
- Median HH income
- $43,547
- Composite
- 69.52/100
- National rank
- #305
- State rank
- #23 of 289 in IA
Livability — Blockton
- Score
- 57/100
- State rank
- #907
- US rank
- #21669
Category grades
Schools grade is shown separately in the Schools card above.
Census & demographics
- Census place
- Blockton, IA
- Population (ZIP)
- 322
Population outlook (Taylor County) Hauer SSP2
- Today (2025)
- 6,143 people
- By 2030
- 6,100 · -0.7%
- By 2040
- 6,080 · -1.0%
- By 2050
- 6,146 · +0.0%
- By 2075
- 6,596 · +7.4%
- By 2100
- 6,954 · +13.2%
Race, ethnicity, and origin ACS 2023
- Neighborhood character
- Predominantly White (95%)
- Race & ethnicity
- White 95% Two or more races 5%
- Common ancestry
- Lithuanian 6% Romanian 3% Italian 3%
- Foreign-born
- 1% · Canada
- Languages at home
- 98% English-only · Spanish 1%
Political lean MEDSL · Taylor
- 2024 margin
- Solid R (+55.7) · D 21.6% · R 77.4% · Other 1.0%
- 2008→2024 swing
- -47.1pp toward R · 2008: -8.6pp · 2024: -55.7pp
- All cycles
- 2024: R+55.7 2020: R+52.9 2016: R+45.1 2012: R+14.1 2008: R+8.6
Not yet ingested
- Civics
- —
Market trends
- HPI YoY
- —
- Current HPI
- —
- Rent YoY
- —
- Metro
- —
- State GDP YoY
- ▲ 2.48%
- F500 in state
- 4
Industry mix (Fortune 500 HQ in IA)
| Industry | F500 HQs | Revenue |
|---|---|---|
| Financial Services | 1 | $16B |
|
||
| Retail / Convenience | 1 | $15B |
|
||
Price history
-17.8% since first listed3 events — show timeline
- 2026-02-02 Contingent — IAR
- 2025-12-15 Price Changed $18,500 IAR
- 2025-10-30 Listed $22,500 IAR
Property tax history
+9.2%/yrLatest (2025): $1,135 · +10.1% YoY. Source: county tax records.
Cash-flow waterfall
monthlySold comps — $/sqft
last 12 mo · ≤1 miLoading sold comps…