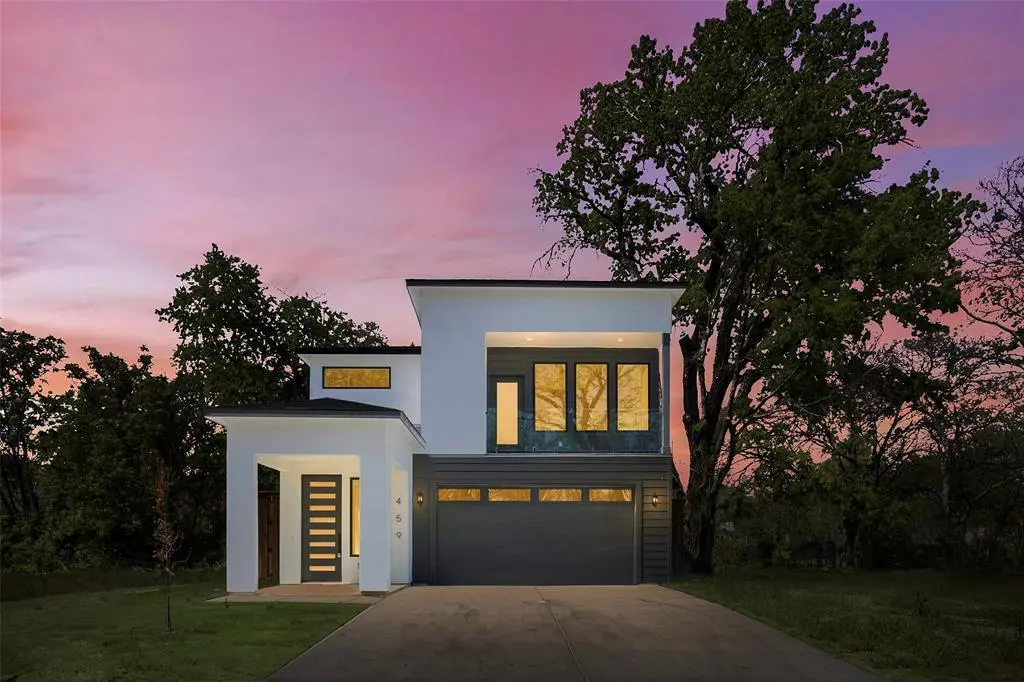
459 Hart St · Dallas, TX
Flood risk 7/10 · Major
- FEMA flood zone
- X
- Chance of flooding over 30 yrs
- 0.75%
- Est. flood insurance / yr
- $507 – $1,088
Fire risk 2/10 · Minimal
- Est. fire insurance / yr
- $1,222 – $2,270
Heat risk 7/10 · Major
- Hot days now (above 109°F)
- 7 days/yr
- Hot days in 30 yrs
- 23 days/yr
Wind risk 6/10 · Moderate
- Chance of severe wind over 30 yrs
- 27.0%
Air-quality risk 3/10 · Minor
- Unhealthy air days now
- 2 days/yr
- Unhealthy air days in 30 yrs
- 3 days/yr
Risk factors via First Street. Map © Google.
Why this score? — see what drove the D- grade
The composite is a weighted blend of 9 inputs, each scored 0–100. Each bar is that input's sub-score; the figure is the points it added to the 100-point composite (weight × sub-score).
- Appreciation +10.0/10.0
- Cash flow +7.8/30.0
- ARV discount +7.5/15.0
- Livability +4.0/5.0
- Schools +2.8/10.0
- Condition / age +2.5/5.0
- DSCR +1.8/10.0
- Rent growth +1.8/5.0
- 1% rule +1.2/10.0
$499,000
🖨 Deal sheet 📄 Offer letter ✓ Due diligence
Listing remarks MLS
Brand-new custom build showcasing unobstructed Downtown Dallas views in the highly sought-after Bottom District. A rare opportunity to own a home with both stunning skyline views and close proximity to the city. Inside, you’ll find soaring ceilings filling the home with natural light, a floor-to-ceiling fireplace, and a primary suite featuring downtown views. The expansive en suite bathroom includes a glass-enclosed shower-tub combination, along with all the modern finishes you could want with the added peace of mind of a builder’s warranty.
Key facts
- 4,225 sq ft lot
- 2 garage spots
- Built 2026
Neighborhood map
What this means for you Summary
Snapshot
- This is a 4-bed/3.0-bath land listed at $499k.
Deal economics
- At list price, monthly cash flow is $-630 ($-8k/yr) — negative.
- To cash-flow at today's rent, offer at most $388k (22.3% below list).
- To meet the 1% rule (rent ≥ 1% of price), the offer needs to be $309k (38.2% below list).
- Recommended offer: $309k (38.2% below list) — sets the bar for 1% rule.
- Cap rate 4.9% vs local median 2.3% in Dallas — top-decile yield for the area; either an underpriced asset or a hidden risk that comps aren't pricing in. Stress-test before assuming the spread holds.
Location & tenants
- Location reads 81/100 on livability (#24 in TX, #1,380 nationally) — a professional / high-income tenant draw. Strengths: amenities A+, commute A+, housing A+; Watch: schools C-, crime F.
- Dallas ISD (urban): math 31% / reading 36% proficiency, ranked #559 of 826 in TX (top 68%) — families likely to look elsewhere, expect single-tenant / working-renter base with shorter leases; 83% free/reduced lunch — lower-income household profile, screen leases tightly.
- Market conditions: Rents soft (-2.7%/yr); 142 active listings in the ZIP; 40 comparable units currently listed for rent nearby; rentals lingering (median 44d on market — plan ~5-8 weeks vacancy on turnover, expect pricing pressure); 50% of comp listings sitting > 30 days — soft ceiling on asking rent; 12,577 units permitted in Dallas County in 2024 (6,829 in 5+ unit buildings).
- At $3,085/mo this rent would consume 79% of the median local household income ($47k/yr) (locally 948% of renters already pay >50% of income on rent) — very limited rent-growth headroom before tenants either downsize or default.
Forward outlook
- In year one you build about $53k of equity ($3k loan paydown + $50k appreciation (10.0% local appreciation)).
- Dallas County population projected at +35% by 2050 — long-run rental-demand tailwind backs the buy-and-hold thesis.
- By year 2, paydown + projected appreciation supports a ~$86k cash-out refi (75% LTV) — recoverable capital for the next deal without selling this one.
Negotiation context
- It's been on market 66 days — a 6% lower offer ($469k) is reasonable based on typical stale-listing flexibility.
- 6 sale attempts since 12y ago; this cycle's ask has dropped $41k (8%) from the opening price — seller is motivated, your offer sets the floor, not the list.
Risks & watch-outs
- Watch-outs: flood insurance adds $66/mo.
- Climate carrying-cost: major flood risk; major wind risk, 27% chance of damaging wind over 30y; extreme-heat days projected 7→23/yr by 2055 (HVAC capex compounding) — expect insurance premiums to compound above CPI over the hold.
Questions for the listing agent
- What do current leases actually rent for vs. the listed asking? Can we see a recent rent roll and the last 12 months of T-12 income?
- It's been on market 66 days. Have you received any prior offers? Is the seller open to a 38% concession, seller financing, or rate buy-down credit?
- What's the actual annual flood-insurance premium (NFIP or private), and is the property in a SFHA with mandatory coverage?
- Why hasn't it sold? Are there any deal-killer items the seller is aware of (foundation, flood, title, zoning, code violations)?
- Is there a deadline driving the sale (1031 exchange, divorce, estate, relocation)? That informs how much negotiation room exists.
- Crime grade is F in this area — have there been break-ins, vandalism, or insurance claims at this property in the last 3 years? What carrier currently insures it and at what premium?
- The area grade is low — what's the realistic commute time and amenity access for the typical tenant pool here? Any planned neighborhood developments (good or bad) we should know about?
- What's the average days-on-market for RENTAL listings here right now (not sales)? A rising rental-DOM trend means longer vacancies and softer asking-rent achievability than the comps imply.
- What's the recent tenant-quality profile in this submarket — average credit score on applications, eviction rate, late-payment / NSF rate, and stable-employment percentage? A property-management company in the area should have these aggregated.
- How much new for-sale + rental construction is in the pipeline within 1–3 miles? Heavy new supply typically softens prices + rents 12–24 months out; constrained supply supports both.
Investment metrics
- 1% rule
- 0.62% ✗
- Cap rate
- 4.94%
- Cash-on-cash
- -4.84%
- DSCR
- 0.78
- GRM
- 13.5
CMA / ARV
- ARV (median comp)
- $124,358
- List price
- $499,000
- Delta
- 301.26%
- Verdict
- OVERPRICED
- Comps
- 6 within 1.0 mi
Projected returns pro-forma
10.0% appreciation · 0.0% rent growth · sell at horizon
- IRR
- 19.7%
- Equity multiple
- 2.59×
- Total profit
- $222,402
- Equity at exit
- $449,539
- IRR
- 17.6%
- Equity multiple
- 5.79×
- Total profit
- $669,940
- Equity at exit
- $969,447
Cash invested: $139,720 (down + closing). Projections, not guarantees.
Landlord ↔ Tenant lean methodology
- Overall (STATE)
- 87 Strongly Landlord-Friendly
- State Texas
- 87 Strongly Landlord-Friendly · R+5
- County
- — inherits STATE
- City
- — inherits STATE
ZIP-level market 75203
- Home prices YoY
- 31.8%
- Rents YoY
- -2.7%
- Active inventory
- 142
- Price-to-rent
- 13.5×
Monthly cashflow live
- Estimated rent
- $3,085 high interval (Pro) →
- Mortgage (P&I)
- −$2,617
- Tax from tax record
- −$176 /mo · $2,115/yr
- Insurance
- −$208
- Flood insurance flood zone
- −$66 /mo · $798/yr
- HOA
- −$0
- Vacancy / Maint / Mgmt
- −$648
- Net cashflow
- $-630
Break-even live
UW: 25.0% down · 7.5% · 30yr · 1.5% tax · 5.0% vac · 8.0% maint · 8.0% mgmt
Financing live
Cash to close
- Down payment
- $124,750
- Closing costs
- $14,970
- Reserves months
- —
- Total cash needed
- —
Loan-product check · same deal, 3 products live
Conventional
25% down · 7.5% · 30yr
- Down + closing
- —
- Monthly P&I
- —
- Monthly cashflow
- —
- DSCR
- —
- Eligible?
- —
Personal DTI + credit; lowest rate.
DSCR
20% down · 8.5% · 30yr
- Down + closing
- —
- Monthly P&I
- —
- Monthly cashflow
- —
- DSCR
- —
- Eligible?
- —
No personal income docs; deal must DSCR.
Hard money
10% down · 12.0% · 12mo
- Down + closing
- —
- Monthly P&I
- —
- Monthly cashflow
- —
- DSCR
- —
- Eligible?
- —
Short-term bridge; refi at stabilization.
Rent comps 40 comps
| Address | Beds | Baths | Sqft | Rent | $/sqft | DOM | Units | Dist |
|---|---|---|---|---|---|---|---|---|
| 404 N Moore St Dallas, TX | 3.0 | 2.5 | 1719 | $2,750 | $1.60 | 7d | 1 | 0.10mi |
| 420 N Denley Dr Dallas, TX | 3.0 | 2.0 | 1592 | $2,500 | $1.57 | 43d | 1 | 0.20mi |
| 815 E 5th St Unit 209 Dallas, TX | 3.0 | 3.5 | 1946 | $3,200 | $1.64 | 24d | 1 | 0.60mi |
| 604 N Ewing Ave Unit 107 Dallas, TX | 3.0 | 3.5 | 1946 | $3,150 | $1.62 | 43d | 1 | 0.62mi |
| 1525 Doyle Ave Dallas, TX | 4.0 | 2.0 | 1710 | $7,750 | $4.53 | 7d | 1 | 0.65mi |
| 441 Avenue A Unit 1019524P Dallas, TX | 4.0 | 2.0 | 1700 | $9,762 | $5.74 | 22d | 1 | 0.65mi |
| 312 S Lancaster Ave Unit 104 Dallas, TX | 3.0 | 3.5 | 1941 | $2,750 | $1.42 | 43d | 1 | 0.69mi |
| 512 N Lancaster Ave Unit 6 Dallas, TX | 3.0 | 3.5 | 1980 | $3,150 | $1.59 | 11d | 1 | 0.69mi |
| 512 N Lancaster Ave #1 Dallas, TX | 3.0 | 3.5 | 1980 | $3,450 | $1.74 | 43d | 1 | 0.69mi |
| 512 N Lancaster Ave Unit 1-2 Dallas, TX | 3.0 | 3.5 | 1980 | $2,950 | $1.49 | 43d | 1 | 0.69mi |
| 1218 Grant St Dallas, TX | 3.0 | 2.5 | 2057 | $2,699 | $1.31 | 24d | 1 | 0.87mi |
| 1218 Grant St Dallas, TX | 3.0 | 2.5 | 2057 | $2,699 | $1.31 | 22d | 1 | 0.87mi |
| 519 High St Dallas, TX | 4.0 | 2.0 | 1869 | $6,000 | $3.21 | 43d | 1 | 0.89mi |
| 1422 Claude St Dallas, TX | 4.0 | 2.0 | 2016 | $2,411 | $1.20 | 43d | 1 | 0.90mi |
| 512 Avenue L Dallas, TX | 3.0 | 4.0 | 2551 | $3,400 | $1.33 | 7d | 1 | 1.01mi |
| 1339 Hendricks Ave Dallas, TX | 3.0 | 3.0 | 2152 | $4,000 | $1.86 | 43d | 1 | 1.01mi |
| 308 E 7th St Dallas, TX | 3.0 | 2.5 | 2399 | $3,600 | $1.50 | 43d | 1 | 1.04mi |
| 306 E 7th St Dallas, TX | 3.0 | 2.5 | 2399 | $3,900 | $1.63 | 14d | 1 | 1.04mi |
| 428 N Patton Ave Dallas, TX | 3.0 | 2.5 | 2399 | $3,900 | $1.63 | 6d | 1 | 1.05mi |
| 302 E 7th St Dallas, TX | 3.0 | 2.5 | 2399 | $3,600 | $1.50 | 43d | 1 | 1.05mi |
| 324 N Patton Ave Dallas, TX | 3.0 | 2.5 | 2300 | $3,499 | $1.52 | 43d | 1 | 1.06mi |
| 1322 Strickland St Dallas, TX | 4.0 | 2.0 | 2053 | $3,299 | $1.61 | 7d | 1 | 1.11mi |
| 1100 Corinth St Dallas, TX | 2.0–3.0 | 2.5–3.5 | 1572 | $3,595 | $2.29 | 43d | 10 | 1.15mi |
| 1367 Branchwood Pl Dallas, TX | 3.0 | 3.5 | 2511 | $3,295 | $1.31 | 5d | 1 | 1.16mi |
| 1366 Branchwood Pl Dallas, TX | 3.0 | 4.0 | 2378 | $3,999 | $1.68 | 43d | 1 | 1.17mi |
| 1310 Branchwood Pl Dallas, TX | 3.0 | 3.5 | 2396 | $3,650 | $1.52 | 15d | 1 | 1.18mi |
| 114 E Chester Ct Dallas, TX | 3.0 | 3.0 | 1834 | $3,000 | $1.64 | 24d | 1 | 1.18mi |
| 112 E Oscar Dr Dallas, TX | 3.0 | 3.0 | 2012 | $3,400 | $1.69 | 11d | 1 | 1.18mi |
| 1309 Arch Pl Dallas, TX | 3.0 | 5.0 | 2443 | $3,875 | $1.59 | 43d | 1 | 1.19mi |
| 1390 Arch Pl Dallas, TX | 4.0 | 4.5 | 2675 | $3,875 | $1.45 | 43d | 1 | 1.20mi |
| 1131 Forester Dr Dallas, TX | 4.0 | 3.0 | 1866 | $2,600 | $1.39 | 43d | 1 | 1.31mi |
| 1805 Browder St Unit 1019612P Dallas, TX | 3.0 | 3.5 | 2357 | $6,830 | $2.90 | 6d | 1 | 1.32mi |
| 1805 Browder St #103 Dallas, TX | 3.0 | 3.5 | 2358 | $8,000 | $3.39 | 43d | 1 | 1.32mi |
| 627 Finley Ct Dallas, TX | 3.0 | 3.0 | 2014 | $3,450 | $1.71 | 43d | 1 | 1.36mi |
| 1508 Seegar St Dallas, TX | 3.0 | 3.5 | 1966 | $3,124 | $1.59 | 14d | 9 | 1.36mi |
| 1512 Seegar St Unit 1508 Dallas, TX | 3.0 | 3.5 | 2003 | $3,250 | $1.62 | 43d | 1 | 1.37mi |
| 901 Elsbeth St Dallas, TX | 3.0 | 3.5 | 1976 | $4,200 | $2.13 | 17d | 1 | 1.38mi |
| 909 Elsbeth St Unit 1019507P Dallas, TX | 3.0 | 3.0 | 1786 | $9,981 | $5.59 | 22d | 1 | 1.38mi |
| 1007 N Madison Ave Dallas, TX | 4.0 | 2.0 | 1895 | $3,500 | $1.85 | 43d | 1 | 1.46mi |
| 1835 Norfolk Ave Dallas, TX | 3.0 | 2.0 | 1666 | $2,200 | $1.32 | 24d | 1 | 1.46mi |
Listing history 18 events
-
2026-05-05price $510,000 559-char remark
Show marketing remark (559 chars)
Brand-new custom build showcasing unobstructed Downtown Dallas views in the highly sought-after Bottom District. A rare opportunity to own a home with both stunning skyline views and close proximity to the city. Inside, you’ll find soaring ceilings filling the home with natural light, a floor-to-ceiling fireplace, and a primary suite featuring downtown views. The expansive en suite bathroom includes a glass-enclosed shower-tub combination, along with all the modern finishes you could want with the added peace of mind of a builder’s warranty.
-
2026-04-14price $524,999 559-char remark
Show marketing remark (559 chars)
Brand-new custom build showcasing unobstructed Downtown Dallas views in the highly sought-after Bottom District. A rare opportunity to own a home with both stunning skyline views and close proximity to the city. Inside, you’ll find soaring ceilings filling the home with natural light, a floor-to-ceiling fireplace, and a primary suite featuring downtown views. The expansive en suite bathroom includes a glass-enclosed shower-tub combination, along with all the modern finishes you could want with the added peace of mind of a builder’s warranty.
-
2026-03-25$540,000 Active 559-char remark
Show marketing remark (559 chars)
Brand-new custom build showcasing unobstructed Downtown Dallas views in the highly sought-after Bottom District. A rare opportunity to own a home with both stunning skyline views and close proximity to the city. Inside, you’ll find soaring ceilings filling the home with natural light, a floor-to-ceiling fireplace, and a primary suite featuring downtown views. The expansive en suite bathroom includes a glass-enclosed shower-tub combination, along with all the modern finishes you could want with the added peace of mind of a builder’s warranty.
-
2026-02-02historical
-
2026-01-28status Active
-
2025-12-18status Pending
-
2025-12-12historical Active Option Contract
-
2025-11-24$549,000 Active
-
2025-05-31historical
-
2025-05-15price $169,000
-
2025-04-15$174,900 Active
-
2025-02-27soldstatus Closed
-
2025-02-11status Pending
-
2025-01-30$108,000 Active
-
2018-09-17soldstatus
-
2014-07-25historical
-
2014-01-24$14,500 Active
-
2008-02-12soldstatus
ⓘ Source: listings_history table (triggers on properties + properties_extension) + one-shot
backfill from property_details.listing_events for pre-trigger history.
Tax reassessment forecast TX · Resets to sale price
- Current annual tax
- $2,115 · $176/mo
- Projected year-2 tax
- $9,132 · $761/mo
- Expected delta
- +$7,016/yr (+$585/mo · 331.7%)
ⓘ Screening estimate from a state-policy table — verify with the county assessor before closing.
Climate risk First Street
- Flood 7/10 Severe FEMA zone X · 75% chance over 30 yrs
- Wildfire 2/10 Low
- Heat 7/10 Severe 7 d/yr ≥109°F today · 23 d/yr by 30 yrs out
- Wind 6/10 Major 27% chance of damaging wind over 30 yrs
- Air quality 3/10 Moderate 2 unhealthy d/yr today · 3 by 30 yrs out
Nearby sold comps map
Loading sold comps map…
Walkable amenities ~0.75 mi
Loading nearby amenities…
Taxation est. · year 1
- Rental income
- $37,022
- − Mortgage interest
- −$27,952
- − Property taxes
- −$2,115
- − Insurance
- −$3,292
- − Repairs & maintenance
- −$2,962
- − Management
- −$2,962
- − Depreciation
- −$14,516
- Taxable loss
- −$16,778
- Est. tax savings @ 24.0%
- +$4,027
- After-tax cash flow
- $-3,536/yr
For passive investors: Depreciation is non-cash, so a rental often shows a tax loss while cash-flowing — sheltering income. Rental losses are passive: they offset passive income freely, and up to $25,000/yr can offset ordinary (W-2) income if you actively participate and your MAGI is under $100k (phasing out to $0 by $150k); unused losses carry forward. On sale, claimed depreciation is recaptured at up to 25%, and gains may owe capital-gains tax (a 1031 exchange can defer both). Figures are a year-1 estimate at your 24.0% rate — not tax advice; consult a CPA.
Schools (NCES district)
- District
- Dallas ISD
- NCES district ID
- 4816230
- Math proficiency
- 31% ▼ -16.00%
- Reading proficiency
- 36% ▼ -4.00%
- Median HH income
- $42,881
- Composite
- 28.41/100
- National rank
- #6763
- State rank
- #559 of 826 in TX
Livability — Dallas
- Score
- 81/100
- State rank
- #24
- US rank
- #1380
Category grades
Schools grade is shown separately in the Schools card above.
Census & demographics
- Census place
- Dallas, TX
- County
- Dallas County · 2,612,404 people
- City population
- 1,168,437
- Metro
- Dallas-Fort Worth-Arlington, TX
- Population (ZIP)
- 15,775
- Household income
- $46,989
- Rent vs Own
- Severe rent burden
- 948.0
Population outlook (Dallas County) Hauer SSP2
- Today (2025)
- 2,979,839 people
- By 2030
- 3,191,823 · +7.1%
- By 2040
- 3,619,611 · +21.5%
- By 2050
- 4,026,915 · +35.1%
- By 2075
- 4,957,073 · +66.4%
- By 2100
- 5,508,725 · +84.9%
Race, ethnicity, and origin ACS 2023
- Neighborhood character
- Diverse neighborhood (Simpson 0.55)
- Race & ethnicity
- Hispanic / Latino 59% Black 31% Two or more races 17% White 7% Native American 2%
- Hispanic origin (detail)
- Mexican 53%
- Common ancestry
- Lithuanian 1% Swiss 1%
- Foreign-born
- 29% · Canada, China, Jamaica
- Languages at home
- 47% English-only · Spanish 51% French/Haitian/Cajun 1%
Political lean MEDSL · Dallas
- 2024 margin
- Strong D (+22.2) · D 60.2% · R 38.0% · Other 1.8%
- 2008→2024 swing
- +6.9pp toward D · 2008: 15.3pp · 2024: 22.2pp
- All cycles
- 2024: D+22.2 2020: D+31.6 2016: D+26.2 2012: D+15.4 2008: D+15.3
Not yet ingested
- Civics
- —
Market trends
- HPI YoY
- ▲ 86.64%
- Current HPI
- 358.9507
- Rent YoY
- ▼ -2.72%
- Metro
- Dallas-Fort Worth-Arlington, TX
- State GDP YoY
- ▲ 3.95%
- F500 in state
- 110
Industry mix (Fortune 500 HQ in TX)
| Industry | F500 HQs | Revenue |
|---|---|---|
| Energy | 16 | $1,198B |
|
||
| Technology | 5 | $198B |
|
||
| Engineering / Construction | 4 | $72B |
|
||
| Energy Services | 3 | $60B |
|
||
| Utilities | 3 | $41B |
|
||
| Healthcare | 2 | $330B |
|
||
Price history
+3417.2% since first listed18 events — show timeline
- 2026-05-05 Price Changed $510,000 NTREIS
- 2026-04-14 Price Changed $524,999 NTREIS
- 2026-03-25 Listed $540,000 NTREIS
- 2026-02-02 Listing Removed — NTREIS
- 2026-01-28 Relisted — NTREIS
- 2025-12-18 Pending — NTREIS
- 2025-12-12 Contingent — NTREIS
- 2025-11-24 Listed $549,000 NTREIS
- 2025-05-31 Listing Removed — NTREIS
- 2025-05-15 Price Changed $169,000 NTREIS
- 2025-04-15 Listed $174,900 NTREIS
- 2025-02-27 Sold (MLS) — NTREIS
- 2025-02-11 Pending — NTREIS
- 2025-01-30 Listed $108,000 NTREIS
- 2018-09-17 Sold (Public Records) — Public Records
- 2014-07-25 Listing Removed — NTREIS
- 2014-01-24 Listed $14,500 NTREIS
- 2008-02-12 Sold (Public Records) — Public Records
Property tax history
+16.5%/yrLatest (2025): $2,115 · -0.4% YoY. Source: county tax records.
Cash-flow waterfall
monthlySold comps — $/sqft
last 12 mo · ≤1 miLoading sold comps…