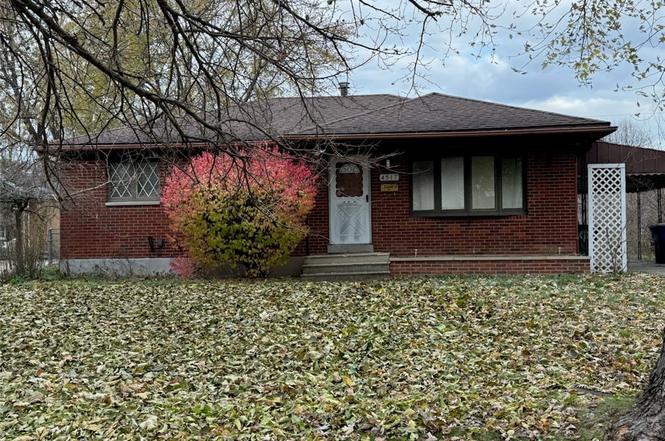
4517 Debra Ave · Dayton, OH
Flood risk 1/10 · Minimal
- FEMA flood zone
- X (unshaded)
- Chance of flooding over 30 yrs
- 0.0%
- Est. flood insurance / yr
- $473 – $860
Fire risk 1/10 · Minimal
- Est. fire insurance / yr
- $713 – $1,323
Heat risk 3/10 · Minor
- Hot days now (above 100°F)
- 7 days/yr
- Hot days in 30 yrs
- 18 days/yr
Wind risk 2/10 · Minimal
- Chance of severe wind over 30 yrs
- 1.0%
Air-quality risk 3/10 · Minor
- Unhealthy air days now
- 2 days/yr
- Unhealthy air days in 30 yrs
- 3 days/yr
Risk factors via First Street. Map © Google.
Why this score? — see what drove the B- grade
The composite is a weighted blend of 9 inputs, each scored 0–100. Each bar is that input's sub-score; the figure is the points it added to the 100-point composite (weight × sub-score).
- Cash flow +30.0/30.0
- 1% rule +10.0/10.0
- DSCR +10.0/10.0
- ARV discount +7.5/15.0
- Rent growth +3.7/5.0
- Livability +3.2/5.0
- Condition / age +2.5/5.0
- Schools +1.3/10.0
- Appreciation +0.0/10.0
$50,000
🖨 Deal sheet (PDF) 📄 Offer letter ✓ Due diligence
Listing remarks
Note change in offer deadline!!! Due to the unprecedented number of showings and offers already received, the property will be available for showing until 7:00 pm Thursday, March 12, and all offers must be submitted no later than 12:00 Noon Friday, March 13. Seller will give preference to offers from buyers who have personally viewed the property. One-story home in a great location has sustained substantial water damage from a broken supply line. Wood Pella windows. Kitchen was remodeled but needs some cabinet repairs. Patio door in the dining area walks out to a large deck and 1.5 car garage. Pass-through carport in driveway provides shelter to the side door. The basement recently flooded
Key facts
- Wood pella windows
- Large deck
- Rec room space
Tags
Neighborhood map
What this means for you Summary
Snapshot
- This is a 3-bed/1.0-bath single-family listed at $50k.
Deal economics
- At list price, monthly cash flow is $519 ($6k/yr) — positive.
- The deal already cash-flows at list — no discount required.
- Meets the 1% rule at list price ($1k rent vs $50k).
- Cap rate 18.7% vs local median 7.3% in Dayton — top-decile yield for the area; either an underpriced asset or a hidden risk that comps aren't pricing in. Stress-test before assuming the spread holds.
Location & tenants
- Location reads 65/100 on livability (#716 in OH) — a middle-class / working-renter tenant base. Strengths: cost of living A+, housing A+, health & safety A; Watch: amenities C-, crime F, commute F.
- Dayton City (urban): math 12% / reading 21% proficiency, ranked #641 of 656 in OH (top 98%) — low school quality limits family demand, transient renter base, plan for 1-2y turnover; 74% free/reduced lunch — lower-income household profile, screen leases tightly.
- Zoned schools: River'S Edge Montessori Elementary School (math 22% / reading 32%, grade F, #1,193 of 1,584 statewide, top 76%, 494 students, 0% FRL); Belmont High School (math 5% / reading 20%, grade F, #720 of 781 statewide, top 93%, 1,100 students, 0% FRL) — zoned schools average 0% FRL vs 74% district-wide (74 pts lower); this property's tenant base skews higher-income than the district average.
- Market conditions: Rents rising fast (+4.8%/yr); 106 active listings in the ZIP; 32 comparable units currently listed for rent nearby; rentals at typical pace (median 25d on market — plan ~3-4 weeks tenant-placement turnaround); 907 units permitted in Montgomery County in 2024 (416 in 5+ unit buildings).
Forward outlook
- Local home prices are declining (-3.0%/yr); year-one equity from $346 of loan paydown is wiped out by about $2k of value loss. Plan a longer hold.
- Montgomery County population projected at -10% by 2050 — secular population decline; favor cash flow + early exit over multi-decade hold.
- At projected returns (-3.0% appreciation + 4.8% rent growth), your $14k cash investment doubles in ~3 years — after that, you're playing with house money.
Negotiation context
- Only 6 days on market — expect competitive offers; lowballing is unlikely to land.
- 2 sale attempts; this cycle's ask has dropped $75k (60%) from the opening price — seller is motivated, your offer sets the floor, not the list.
Risks & watch-outs
- Watch-outs: property tax is 4.8% of price; built in 1957 — expect roof / HVAC / electrical / plumbing capex.
Questions for the listing agent
- Built in 1957 — when were the roof, HVAC, electrical panel, plumbing, and water heater last replaced?
- Property tax is high relative to price — has the assessment been appealed recently, and will the sale trigger a re-assessment?
- Is there a deadline driving the sale (1031 exchange, divorce, estate, relocation)? That informs how much negotiation room exists.
- Crime grade is F in this area — have there been break-ins, vandalism, or insurance claims at this property in the last 3 years? What carrier currently insures it and at what premium?
- What's the average days-on-market for RENTAL listings here right now (not sales)? A rising rental-DOM trend means longer vacancies and softer asking-rent achievability than the comps imply.
- What's the recent tenant-quality profile in this submarket — average credit score on applications, eviction rate, late-payment / NSF rate, and stable-employment percentage? A property-management company in the area should have these aggregated.
- How much new for-sale + rental construction is in the pipeline within 1–3 miles? Heavy new supply typically softens prices + rents 12–24 months out; constrained supply supports both.
Investment metrics
- 1% rule
- 2.53% ✓
- Cap rate
- 18.75%
- Cash-on-cash
- 44.47%
- DSCR
- 2.98
- GRM
- 3.3
CMA / ARV
- ARV (on-the-fly)
- $162,032
- Comps found
- 12
Show comp detail 12 sales within ~0.75 mi
| Address | Dist | Beds/Ba | Sqft | Sold | Price | $/sf | Match |
|---|---|---|---|---|---|---|---|
| 1636 Pence Pl | 0.46mi | 3/1.0 | 1,008 (+2%) | 2mo | $190,000 | $188 | 74 |
| 4404 Woodcliffe Ave | 0.46mi | 2/1.0 (-1) | 990 (+0%) | 1mo | $127,500 | $129 | 73 |
| 2605 Flesher Ave | 0.40mi | 3/1.5 | 1,053 (+7%) | 1mo | $170,000 | $161 | 68 |
| 4620 Farnham Ave | 0.38mi | 3/1.0 | 900 (-9%) | 1mo | $25,286 | $28 | 66 |
| 2127 Moreland Ave | 0.54mi | 2/1.0 (-1) | 960 (-3%) | 0mo | $134,000 | $140 | 64 |
| 1040 Highridge Ave | 0.26mi | 3/2.0 | 1,108 (+12%) | 0mo | $182,000 | $164 | 63 |
| 2817 Kennedy Ave | 0.51mi | 2/2.0 (-1) | 960 (-3%) | 1mo | $125,000 | $130 | 62 |
| 1004 Chelsea Ave | 0.35mi | 2/1.0 (-1) | 864 (-13%) | 2mo | $165,000 | $191 | 56 |
| 541 Watervliet Ave | 0.72mi | 2/2.0 (-1) | 1,000 (+1%) | 1mo | $175,000 | $175 | 55 |
| 1905 Russell Ave | 0.37mi | 2/2.0 (-1) | 1,110 (+12%) | 0mo | $159,000 | $143 | 53 |
| 1804 Culver Ave | 0.68mi | 2/1.5 (-1) | 928 (-6%) | 1mo | $205,000 | $221 | 50 |
| 2348 Fauver Ave | 0.59mi | 2/2.0 (-1) | 1,080 (+9%) | 1mo | $200,000 | $185 | 47 |
Match score weights: distance 35% · size 25% · config 20% · recency 20%. Top-matched comps best support the ARV.
Projected returns pro-forma
-3.0% appreciation · 4.82% rent growth · sell at horizon
- IRR
- 43.9%
- Equity multiple
- 2.96×
- Total profit
- $27,405
- Equity at exit
- $7,455
- IRR
- 50.9%
- Equity multiple
- 6.49×
- Total profit
- $76,880
- Equity at exit
- $4,323
Cash invested: $14,000 (down + closing). Projections, not guarantees.
Landlord ↔ Tenant lean methodology
- Overall (STATE)
- 73 Landlord-Friendly
- State Ohio
- 73 Landlord-Friendly · R+6
- County
- — inherits STATE
- City
- — inherits STATE
ZIP-level market 45420
- Rents YoY
- 4.8%
- Active inventory
- 106
- Price-to-rent
- 3.3×
Monthly cashflow live
- Estimated rent
- $1,266 high interval (Pro) →
- Mortgage (P&I)
- −$262
- Tax from tax record
- −$198 /mo · $2,376/yr
- Insurance
- −$21
- HOA
- −$0
- Vacancy / Maint / Mgmt
- −$266
- Net cashflow
- $519
Break-even live
Sensitivity live
| Price | -10% $689 | -5% $672 | +0% $519 | +5% $505 | +10% $491 |
|---|---|---|---|---|---|
| Rent | -10% $419 | -5% $469 | +0% $519 | +5% $569 | +10% $619 |
| Rate | -1.0pp $544 | -0.5pp $532 | base $519 | +0.5pp $506 | +1.0pp $493 |
UW: 25.0% down · 7.5% · 30yr · 1.5% tax · 5.0% vac · 8.0% maint · 8.0% mgmt
Financing live
Cash to close
- Down payment
- $12,500
- Closing costs
- $1,500
- Reserves months
- —
- Total cash needed
- —
Loan-product check · same deal, 3 products live
Conventional
25% down · 7.5% · 30yr
- Down + closing
- —
- Monthly P&I
- —
- Monthly cashflow
- —
- DSCR
- —
- Eligible?
- —
Personal DTI + credit; lowest rate.
DSCR
20% down · 8.5% · 30yr
- Down + closing
- —
- Monthly P&I
- —
- Monthly cashflow
- —
- DSCR
- —
- Eligible?
- —
No personal income docs; deal must DSCR.
Hard money
10% down · 12.0% · 12mo
- Down + closing
- —
- Monthly P&I
- —
- Monthly cashflow
- —
- DSCR
- —
- Eligible?
- —
Short-term bridge; refi at stabilization.
Rent comps 32 comps
| Address | Beds | Baths | Sqft | Rent | $/sqft | DOM | Units | Dist |
|---|---|---|---|---|---|---|---|---|
| 2850 Hazel Ave Unit 1496064P Dayton, OH | 3.0 | 2.0 | 850 | $6,259 | $7.36 | 20d | 1 | 0.54mi |
| 2112 Patterson Rd Dayton, OH | 3.0 | 1.0 | 1008 | $1,425 | $1.41 | 4d | 1 | 0.64mi |
| 1828 Hazel Ave Dayton, OH | 2.0 | 1.0 | 960 | $1,435 | $1.49 | 4d | 1 | 0.73mi |
| 1659 Hearthstone Dr Dayton, OH | 3.0 | 1.0 | 1102 | $1,195 | $1.08 | 4d | 1 | 0.85mi |
| 1905 Coventry Rd Dayton, OH | 2.0 | 1.0 | 1000 | $1,250 | $1.25 | 25d | 1 | 0.87mi |
| 2212 Farmside Dr Dayton, OH | 3.0 | 1.0 | 1008 | $1,395 | $1.38 | 45d | 1 | 0.89mi |
| 1238 Colwick Dr Dayton, OH | 2.0 | 1.0 | 786 | $1,250 | $1.59 | 13d | 1 | 0.89mi |
| 3311 S Smithville Rd Dayton, OH | 3.0 | 1.0 | 1019 | $1,295 | $1.27 | 45d | 1 | 0.91mi |
| 5345 Middlebury Rd Dayton, OH | 3.0 | 1.0 | 864 | $1,600 | $1.85 | 45d | 1 | 0.91mi |
| 1641 Edendale Rd Dayton, OH | 3.0 | 1.0 | 976 | $1,395 | $1.43 | 4d | 1 | 0.99mi |
| 2416 Brookline Ave Dayton, OH | 2.0 | 1.0 | 806 | $895 | $1.11 | 4d | 1 | 1.00mi |
| 1517 Rausch Ave Dayton, OH | 2.0 | 1.0 | 950 | $950 | $1.00 | 45d | 1 | 1.02mi |
| 1517 Rausch Ave Apt 4 Dayton, OH | 2.0 | 1.0 | 950 | $950 | $1.00 | 4d | 1 | 1.02mi |
| 1934 Farmside Dr Dayton, OH | 3.0 | 1.0 | 1008 | $1,395 | $1.38 | 45d | 1 | 1.02mi |
| 2029 Brookline Ave Dayton, OH | 2.0 | 1.0 | 990 | $1,270 | $1.28 | 16d | 1 | 1.02mi |
| 1501 Rausch Ave Dayton, OH | 2.0 | 1.0 | 865 | $800 | $0.92 | 25d | 1 | 1.03mi |
| 3100 Linden Ave Unit 3102 Dayton, OH | 2.0 | 1.0 | 1035 | $995 | $0.96 | 45d | 1 | 1.15mi |
| 3603 S Smithville Rd Kettering, OH | 2.0 | 1.0 | 950 | $1,100 | $1.16 | 25d | 1 | 1.16mi |
| 1430 Coventry Rd Dayton, OH | 2.0 | 1.0 | 1106 | $1,125 | $1.02 | 16d | 1 | 1.23mi |
| 1053 Wilmington Ave Dayton, OH | 2.0–3.0 | 1.0–1.5 | 1025 | $1,495 | $1.46 | 4d | 5 | 1.31mi |
| 1059 Wilmington Ave Unit 1059 1 Dayton, OH | 3.0 | 1.5 | 1100 | $1,495 | $1.36 | 45d | 1 | 1.31mi |
| 2306 Alice St Dayton, OH | 3.0 | 1.0 | 918 | $1,200 | $1.31 | 5d | 1 | 1.34mi |
| 1143 Blakley Dr Dayton, OH | 3.0 | 1.0 | 947 | $1,195 | $1.26 | 16d | 1 | 1.34mi |
| 922 Wilmington Ave Dayton, OH | 2.0 | 1.0 | 720 | $1,200 | $1.67 | 25d | 1 | 1.35mi |
| 933 Wilmington Ave Dayton, OH | 1.0–2.0 | 1.0–1.5 | 802 | $980 | $1.22 | 5d | 8 | 1.37mi |
| 854 Santa Cruz Ave Dayton, OH | 3.0 | 1.0 | 1060 | $1,300 | $1.23 | 45d | 1 | 1.39mi |
| 809 Patterson Rd Dayton, OH | 2.0 | 1.0–1.5 | 895 | $1,075 | $1.20 | 4d | 7 | 1.44mi |
| 1410 Phillips Ave Unit 1 Dayton, OH | 2.0 | 1.0 | 1000 | $950 | $0.95 | 45d | 1 | 1.44mi |
| 737 Wilmington Ave Dayton, OH | 2.0 | 1.0 | 1000 | $950 | $0.95 | 25d | 1 | 1.44mi |
| 1029 Blakley Dr Dayton, OH | 3.0 | 1.0 | 947 | $1,300 | $1.37 | 4d | 1 | 1.46mi |
| 1354 Ohmer St Unit 1354C Dayton, OH | 2.0 | 1.0 | 900 | $700 | $0.78 | 45d | 1 | 1.49mi |
| 1354 Ohmer St Unit 1354A Dayton, OH | 2.0 | 1.0 | 900 | $675 | $0.75 | 25d | 1 | 1.49mi |
Listing history 5 events
-
2026-03-13status Pending
-
2026-03-10status Active
-
2026-03-10price $50,000
-
2026-03-07historical
-
2026-03-03$125,000 Active
ⓘ Source: listings_history table (triggers on properties + properties_extension) + one-shot
backfill from property_details.listing_events for pre-trigger history.
Tax reassessment forecast OH · Partial reset (capped growth)
- Current annual tax
- $2,376 · $198/mo
- Projected year-2 tax
- $2,376 · $198/mo
- Expected delta
- $0/yr ($0/mo · 0.0%)
ⓘ Screening estimate from a state-policy table — verify with the county assessor before closing.
Climate risk First Street
- Flood 1/10 Low FEMA zone X (unshaded) · 0% chance over 30 yrs
- Wildfire 1/10 Low
- Heat 3/10 Moderate 7 d/yr ≥100°F today · 18 d/yr by 30 yrs out
- Wind 2/10 Low 100% chance of damaging wind over 30 yrs
- Air quality 3/10 Moderate 2 unhealthy d/yr today · 3 by 30 yrs out
Nearby sold comps map
Loading sold comps map…
Walkable amenities ~0.75 mi
Loading nearby amenities…
Taxation est. · year 1
- Rental income
- $15,188
- − Mortgage interest
- −$2,801
- − Property taxes
- −$2,376
- − Insurance
- −$250
- − Repairs & maintenance
- −$1,215
- − Management
- −$1,215
- − Depreciation
- −$1,455
- Taxable income
- $5,877
- Est. tax owed @ 24.0%
- −$1,410
- After-tax cash flow
- $4,816/yr
For passive investors: Depreciation is non-cash, so a rental often shows a tax loss while cash-flowing — sheltering income. Rental losses are passive: they offset passive income freely, and up to $25,000/yr can offset ordinary (W-2) income if you actively participate and your MAGI is under $100k (phasing out to $0 by $150k); unused losses carry forward. On sale, claimed depreciation is recaptured at up to 25%, and gains may owe capital-gains tax (a 1031 exchange can defer both). Figures are a year-1 estimate at your 24.0% rate — not tax advice; consult a CPA.
Schools (NCES district)
- District
- Dayton City
- NCES district ID
- 3904384
- Math proficiency
- 12% ▼ -12.00%
- Reading proficiency
- 21% ▼ -11.00%
- Median HH income
- $28,688
- Composite
- 12.94/100
- National rank
- #9579
- State rank
- #641 of 656 in OH
Livability — Dayton
- Score
- 65/100
- State rank
- #716
- US rank
- #12895
Category grades
Schools grade is shown separately in the Schools card above.
Census & demographics
- Census place
- Dayton, OH
- County
- Montgomery County · 459,541 people
- City population
- 164,387
- Metro
- Dayton-Kettering, OH
- Population (ZIP)
- 24,411
- Household income
- $60,588
- Rent vs Own
- Severe rent burden
- 856.0
Population outlook (Montgomery County) Hauer SSP2
- Today (2025)
- 523,241 people
- By 2030
- 514,948 · -1.6%
- By 2040
- 493,378 · -5.7%
- By 2050
- 469,639 · -10.2%
- By 2075
- 418,360 · -20.0%
- By 2100
- 353,315 · -32.5%
Race, ethnicity, and origin ACS 2023
- Neighborhood character
- Predominantly White (83%)
- Race & ethnicity
- White 83% Black 7% Two or more races 6% Hispanic / Latino 3% Asian 3%
- Common ancestry
- Lithuanian 3% Slovak 2% Italian 2%
- Foreign-born
- 7% · Canada, China
- Languages at home
- 93% English-only · Other Indo-European 2% Spanish 2% Chinese 0%
Political lean MEDSL · Montgomery
- 2024 margin
- Toss-up / Even · D 49.8% · R 49.3%
- 2008→2024 swing
- -5.8pp toward R · 2008: 6.2pp · 2024: 0.5pp
- All cycles
- 2024: D+0.5 2020: D+2.2 2016: R+1.2 2012: D+3.1 2008: D+6.2
Not yet ingested
- Civics
- —
Market trends
- HPI YoY
- ▼ -192.56%
- Current HPI
- 241.6543
- Rent YoY
- ▲ 4.82%
- Metro
- Dayton-Kettering, OH
- State GDP YoY
- ▲ 1.98%
- F500 in state
- 48
Industry mix (Fortune 500 HQ in OH)
| Industry | F500 HQs | Revenue |
|---|---|---|
| Insurance | 3 | $145B |
|
||
| Industrial Machinery | 3 | $49B |
|
||
| Financial Services | 3 | $24B |
|
||
| Consumer Goods | 2 | $93B |
|
||
| Aerospace / Defense | 2 | $47B |
|
||
| Utilities | 2 | $33B |
|
||
Price history
-60.0% since first listed5 events — show timeline
- 2026-03-13 Pending — Dayton MLS
- 2026-03-10 Relisted — Dayton MLS
- 2026-03-10 Price Changed $50,000 Dayton MLS
- 2026-03-07 Listing Removed — Dayton MLS
- 2026-03-03 Listed $125,000 Dayton MLS
Property tax history
+3.7%/yrLatest (2025): $2,376 · +9.2% YoY. Source: county tax records.
Cash-flow waterfall
monthlySold comps — $/sqft
last 12 mo · ≤1 miLoading sold comps…