209 Nottingham Rd · Montgomery, AL
Flood risk 1/10 · Minimal
- FEMA flood zone
- X (unshaded)
- Chance of flooding over 30 yrs
- 0.0%
- Est. flood insurance / yr
- $473 – $860
Fire risk 3/10 · Minor
- Est. fire insurance / yr
- $916 – $1,700
Heat risk 7/10 · Major
- Hot days now (above 107°F)
- 7 days/yr
- Hot days in 30 yrs
- 18 days/yr
Wind risk 8/10 · Major
- Chance of severe wind over 30 yrs
- 80.0%
Air-quality risk 3/10 · Minor
- Unhealthy air days now
- 4 days/yr
- Unhealthy air days in 30 yrs
- 4 days/yr
Risk factors via First Street. Map © Google.
Why this score? — see what drove the D+ grade
The composite is a weighted blend of 9 inputs, each scored 0–100. Each bar is that input's sub-score; the figure is the points it added to the 100-point composite (weight × sub-score).
- Cash flow +23.2/30.0
- DSCR +7.5/10.0
- 1% rule +6.0/10.0
- Rent growth +3.2/5.0
- Livability +3.2/5.0
- Condition / age +2.2/5.0
- Schools +1.7/10.0
- ARV discount +0.4/15.0
- Appreciation +0.0/10.0
$119,995
🖨 Deal sheet 📄 Offer letter ✓ Due diligence
Listing remarks MLS
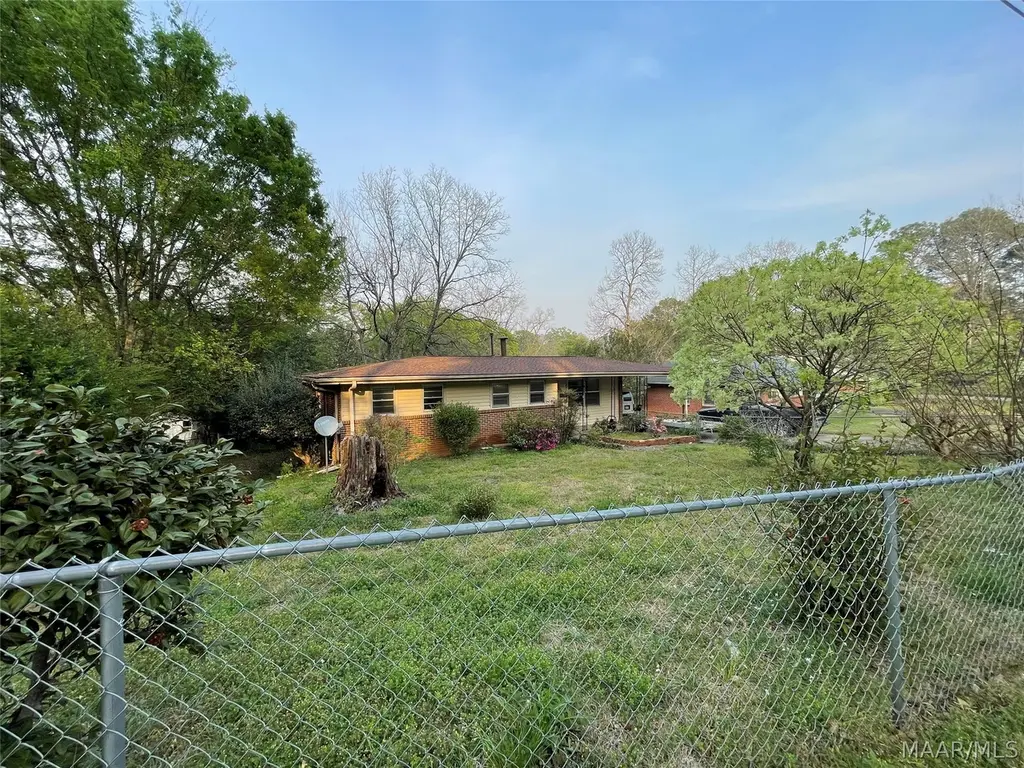
Welcome home! This lovely, fully fenced 3 bedroom/2 bath home has a few surprises in store for you. From the moment you pull into one of two driveways, one with an attached carport, you will find yourself surrounded by flowering trees including crepe myrtles, roses bushes, and more. The backyard is its own private oasis with various areas to entertain, cook out, or simply revel in the tranquility and privacy this property offers. Inside you are greeted by a cozy living and dining room adjacent to the quaint kitchen. 3 bedrooms and a full bath are just down the hallway. But there's more! Not included in the square footage is a full basement that is partially finished. The basement includes a living area, a room for guests, a full bathroom, a laundry area, and storage. An exterior door in the basement leads to one of the covered porches. This home is perfect for anyone looking for peace and quiet without sacrificing the conveniences of city living. This one won't last long! Call your favorite realtor today to schedule your tour!
Key facts
- Guest room
- Laundry space
- Full bathroom
Tags
Property features AI
Finance
- Financial info: $369 annual tax (provided)
Exterior
- Parking: Attached carport; Driveway; Has carport
- Utilities: Public water; Community/Coop sewer; Electricity available; Natural gas available; Cable available
- Home design: Single-story home; Basement foundation; Brick, block, concrete and vinyl siding exterior
- Construction: Built (year per public records); Brick, block, concrete and vinyl siding construction
- Exterior features: Covered patio; Covered porch; Patio; Fully fenced yard; Full fencing; City lot in a subdivision; Irregular lot shape
Interior
- Flooring: Carpet; Laminate
- Bathrooms: 2 full bathrooms
- Heating & cooling: Central heating (gas); Central electric cooling
- Interior features: Partially finished basement; Carpet flooring; Laminate flooring
- Laundry & utility: Gas water heater
Neighborhood map
What this means for you Summary
Snapshot
- This is a 3-bed/2.0-bath single-family listed at $120k. Condition is rated fair.
Deal economics
- At list price, monthly cash flow is $218 ($3k/yr) — positive.
- The deal already cash-flows at list — no discount required.
- Meets the 1% rule at list price ($1k rent vs $120k).
- Recommended offer: $113k (6.0% below list) — sets the bar for market timing.
- Cap rate 8.5% vs local median 6.0% in Montgomery — top-decile yield for the area; either an underpriced asset or a hidden risk that comps aren't pricing in. Stress-test before assuming the spread holds.
Location & tenants
- Location reads 65/100 on livability (#138 in AL) — a middle-class / working-renter tenant base. Strengths: cost of living A+, housing A+; Watch: schools C-, employment D, crime F.
- Montgomery County (urban): math 9% / reading 31% proficiency, ranked #106 of 129 in AL (top 82%) — low school quality limits family demand, transient renter base, plan for 1-2y turnover; 70% free/reduced lunch — lower-income household profile, screen leases tightly.
- Market conditions: Rents rising (+2.6%/yr); 207 active listings in the ZIP; 40 comparable units currently listed for rent nearby; rentals at typical pace (median 21d on market — plan ~3-4 weeks tenant-placement turnaround); 48% of comp listings sitting > 30 days — soft ceiling on asking rent; 460 units permitted in Montgomery County in 2024 (37 in 5+ unit buildings).
Forward outlook
- Local home prices are declining (-3.0%/yr); year-one equity from $829 of loan paydown is wiped out by about $4k of value loss. Plan a longer hold.
- Montgomery County population projected to shrink 8% by 2050 — rents likely to lag national; underwrite the cash flow, not the appreciation.
Negotiation context
- It's been on market 77 days — a 6% lower offer ($113k) is reasonable based on typical stale-listing flexibility.
- 5 sale attempts since 16y ago with the ask held roughly flat each time — persistent listings suggest the price (not the market) is what's stuck; bring a comps-based counter.
Risks & watch-outs
- Watch-outs: built in 1955 — expect roof / HVAC / electrical / plumbing capex.
- Climate carrying-cost: severe wind risk, 80% chance of damaging wind over 30y; extreme-heat days projected 7→18/yr by 2055 (HVAC capex compounding) — expect insurance premiums to compound above CPI over the hold.
Questions for the listing agent
- It's been on market 77 days. Have you received any prior offers? Is the seller open to a 6% concession, seller financing, or rate buy-down credit?
- Have any recent inspections been done? Can we get a copy of the seller's disclosures and any deferred-maintenance estimates?
- Built in 1955 — when were the roof, HVAC, electrical panel, plumbing, and water heater last replaced?
- Why hasn't it sold? Are there any deal-killer items the seller is aware of (foundation, flood, title, zoning, code violations)?
- Is there a deadline driving the sale (1031 exchange, divorce, estate, relocation)? That informs how much negotiation room exists.
- Crime grade is F in this area — have there been break-ins, vandalism, or insurance claims at this property in the last 3 years? What carrier currently insures it and at what premium?
- The area grade is low — what's the realistic commute time and amenity access for the typical tenant pool here? Any planned neighborhood developments (good or bad) we should know about?
- What's the average days-on-market for RENTAL listings here right now (not sales)? A rising rental-DOM trend means longer vacancies and softer asking-rent achievability than the comps imply.
- What's the recent tenant-quality profile in this submarket — average credit score on applications, eviction rate, late-payment / NSF rate, and stable-employment percentage? A property-management company in the area should have these aggregated.
- How much new for-sale + rental construction is in the pipeline within 1–3 miles? Heavy new supply typically softens prices + rents 12–24 months out; constrained supply supports both.
Investment metrics
- 1% rule
- 1.10% ✓
- Cap rate
- 8.47%
- Cash-on-cash
- 7.79%
- DSCR
- 1.35
- GRM
- 7.5
CMA / ARV
- ARV (on-the-fly)
- $103,588
- Comps found
- 12
Show comp detail 12 sales within ~0.75 mi
| Address | Dist | Beds/Ba | Sqft | Sold | Price | $/sf | Match |
|---|---|---|---|---|---|---|---|
| 3508 Cottonwood Dr | 0.30mi | 3/1.5 | 1,066 (-3%) | 10mo | $93,000 | $87 | 70 |
| 3405 Vermont Dr | 0.41mi | 3/1.5 | 1,061 (-4%) | 6mo | $88,000 | $83 | 68 |
| 238 Easthaven Rd | 0.35mi | 3/2.0 | 1,188 (+8%) | 5mo | $77,900 | $66 | 67 |
| 3831 Avondale Ct | 0.63mi | 3/2.0 | 1,144 (+4%) | 4mo | $151,000 | $132 | 61 |
| 3700 Ramos Ct | 0.38mi | 3/2.0 | 1,232 (+12%) | 3mo | $134,400 | $109 | 60 |
| 3618 Nottingham Rd | 0.45mi | 3/1.0 | 1,035 (-6%) | 6mo | $97,000 | $94 | 60 |
| 3816 Marquette Dr | 0.68mi | 3/1.0 | 1,135 (+3%) | 7mo | $121,000 | $107 | 53 |
| 3556 N Wareingwood Dr | 0.63mi | 3/1.0 | 1,215 (+10%) | 3mo | $71,500 | $59 | 47 |
| 508 Forest Hills Dr | 0.61mi | 3/2.0 | 1,267 (+15%) | 1mo | $55,500 | $44 | 46 |
| 3712 Ware Ct | 0.43mi | 2/1.0 (-1) | 1,240 (+12%) | 8mo | $135,000 | $109 | 44 |
| 2933 Willow Lane Dr | 0.70mi | 3/2.0 | 1,234 (+12%) | 6mo | $121,000 | $98 | 42 |
| 302 Whetstone Dr | 0.67mi | 2/1.0 (-1) | 1,025 (-7%) | 8mo | $72,000 | $70 | 42 |
Match score weights: distance 35% · size 25% · config 20% · recency 20%. Top-matched comps best support the ARV.
Projected returns pro-forma
-3.0% appreciation · 2.65% rent growth · sell at horizon
- IRR
- -4.8%
- Equity multiple
- 0.82×
- Total profit
- $-6,000
- Equity at exit
- $17,892
- IRR
- 4.5%
- Equity multiple
- 1.32×
- Total profit
- $10,845
- Equity at exit
- $10,375
Cash invested: $33,599 (down + closing). Projections, not guarantees.
Landlord ↔ Tenant lean methodology
- Overall (STATE)
- 90 Strongly Landlord-Friendly
- State Alabama
- 90 Strongly Landlord-Friendly · R+15
- County
- — inherits STATE
- City
- — inherits STATE
ZIP-level market 36109
- Home prices YoY
- -20.1%
- Rents YoY
- 2.6%
- Active inventory
- 207
- Price-to-rent
- 7.5×
Monthly cashflow live
- Estimated rent
- $1,326 high interval (Pro) →
- Mortgage (P&I)
- −$629
- Tax est. 1.5%
- −$150 /mo · $1,800/yr
- Insurance
- −$50
- HOA
- −$0
- Vacancy / Maint / Mgmt
- −$278
- Net cashflow
- $218
Break-even live
UW: 25.0% down · 7.5% · 30yr · 1.5% tax · 5.0% vac · 8.0% maint · 8.0% mgmt
Financing live
Cash to close
- Down payment
- $29,999
- Closing costs
- $3,600
- Reserves months
- —
- Total cash needed
- —
Loan-product check · same deal, 3 products live
Conventional
25% down · 7.5% · 30yr
- Down + closing
- —
- Monthly P&I
- —
- Monthly cashflow
- —
- DSCR
- —
- Eligible?
- —
Personal DTI + credit; lowest rate.
DSCR
20% down · 8.5% · 30yr
- Down + closing
- —
- Monthly P&I
- —
- Monthly cashflow
- —
- DSCR
- —
- Eligible?
- —
No personal income docs; deal must DSCR.
Hard money
10% down · 12.0% · 12mo
- Down + closing
- —
- Monthly P&I
- —
- Monthly cashflow
- —
- DSCR
- —
- Eligible?
- —
Short-term bridge; refi at stabilization.
Rent comps 40 comps
| Address | Beds | Baths | Sqft | Rent | $/sqft | DOM | Units | Dist |
|---|---|---|---|---|---|---|---|---|
| 118 Nottingham Ct Montgomery, AL | 3.0 | 2.0 | 1344 | $1,275 | $0.95 | 43d | 1 | 0.11mi |
| 3602 Little John Dr Montgomery, AL | 4.0 | 1.0 | 1286 | $1,400 | $1.09 | 20d | 1 | 0.18mi |
| 3515 Cottonwood Dr Montgomery, AL | 3.0 | 1.5 | 1246 | $1,350 | $1.08 | 43d | 1 | 0.31mi |
| 688 Joryne Dr Montgomery, AL | 3.0 | 2.0 | 1500 | $1,200 | $0.80 | 43d | 1 | 0.40mi |
| 239 Forest Hills Dr Montgomery, AL | 4.0 | 1.5 | 1500 | $1,450 | $0.97 | 20d | 1 | 0.41mi |
| 103 Dalraida Rd Unit D Montgomery, AL | 2.0 | 2.0 | 838 | $875 | $1.04 | 43d | 1 | 0.45mi |
| 3334 Cottonwood Dr Montgomery, AL | 3.0 | 2.0 | 1025 | $1,295 | $1.26 | 13d | 1 | 0.46mi |
| 107 Dalraida Rd Unit A Montgomery, AL | 3.0 | 2.0 | 1237 | $1,200 | $0.97 | 43d | 1 | 0.48mi |
| 3329 Vermont Dr Montgomery, AL | 3.0 | 1.5 | 1465 | $1,395 | $0.95 | 13d | 1 | 0.49mi |
| 3233 Hillcrest Ln Montgomery, AL | 3.0 | 2.0 | 1278 | $1,395 | $1.09 | 20d | 1 | 0.51mi |
| 3319 Willow Lane Dr Montgomery, AL | 3.0 | 2.0 | 1032 | $1,200 | $1.16 | 43d | 1 | 0.56mi |
| 860 Greg Dr Montgomery, AL | 3.0 | 2.0 | 1400 | $1,295 | $0.93 | 13d | 1 | 0.56mi |
| 4046 Camellia Dr Unit 1 Montgomery, AL | 3.0 | 2.0 | 1500 | $1,200 | $0.80 | 43d | 1 | 0.66mi |
| 895 Greg Dr Montgomery, AL | 3.0 | 2.0 | 1489 | $1,600 | $1.07 | 13d | 1 | 0.68mi |
| 67 Holliday Dr Montgomery, AL | 3.0 | 1.0 | 1156 | $1,200 | $1.04 | 43d | 1 | 0.74mi |
| 4023 Ware Hill Dr Unit 1507324P Montgomery, AL | 2.0 | 2.0 | 1420 | $4,076 | $2.87 | 13d | 1 | 0.79mi |
| 186 E Salem Dr Montgomery, AL | 3.0 | 1.0 | 1040 | $1,195 | $1.15 | 20d | 1 | 0.85mi |
| 3456 Harrison Rd Montgomery, AL | 3.0 | 1.0 | 1008 | $1,300 | $1.29 | 43d | 1 | 0.86mi |
| 200 Eton Rd Montgomery, AL | 3.0 | 1.5 | 1500 | $895 | $0.60 | 13d | 1 | 0.88mi |
| 610 S Georgetown Dr Unit 1386555P Montgomery, AL | 3.0 | 1.0 | 1474 | $3,635 | $2.47 | 13d | 1 | 0.92mi |
| 122 Oak Forest Dr Montgomery, AL | 3.0 | 1.0 | 1092 | $975 | $0.89 | 20d | 1 | 0.93mi |
| 750 S Marquette Dr Montgomery, AL | 3.0 | 1.0 | 1325 | $1,195 | $0.90 | 43d | 1 | 0.96mi |
| 301 Bradley Dr Montgomery, AL | 2.0 | 1.0 | 841 | $935 | $1.11 | 13d | 1 | 0.97mi |
| 1117 Karen Rd Montgomery, AL | 3.0 | 1.0 | 1308 | $1,195 | $0.91 | 43d | 1 | 0.98mi |
| 311 Bradley Dr Montgomery, AL | 3.0 | 1.0 | 1104 | $825 | $0.75 | 43d | 1 | 0.98mi |
| 3323 Bedford Ln Montgomery, AL | 3.0 | 2.0 | 1134 | $1,200 | $1.06 | 20d | 1 | 0.99mi |
| 3346 Bedford Ln Montgomery, AL | 3.0 | 1.0 | 1134 | $1,295 | $1.14 | 13d | 1 | 0.99mi |
| 7 Calhoun Rd Unit B Montgomery, AL | 2.0 | 1.0 | 961 | $850 | $0.88 | 43d | 1 | 1.00mi |
| 15 Bradley Dr Montgomery, AL | 3.0 | 2.0 | 1365 | $1,500 | $1.10 | 20d | 1 | 1.02mi |
| 319 Olivia Ct Montgomery, AL | 2.0 | 1.0 | 850 | $700 | $0.82 | 20d | 1 | 1.02mi |
| 1154 Lakewood Dr Montgomery, AL | 3.0 | 2.0 | 1066 | $1,350 | $1.27 | 43d | 1 | 1.05mi |
| 108 Calhoun Rd Unit 108B Montgomery, AL | 2.0 | 1.0 | 1350 | $750 | $0.56 | 43d | 1 | 1.05mi |
| 4041A Beth Manor Dr Montgomery, AL | 1.0–3.0 | 1.0–2.0 | 925 | $1,000 | $1.08 | 20d | 20 | 1.12mi |
| 804 Hillman St Montgomery, AL | 3.0 | 2.0 | 1370 | $1,295 | $0.95 | 13d | 1 | 1.16mi |
| 804 Hillman St Montgomery, AL | 3.0 | 2.0 | 1356 | $1,295 | $0.96 | 20d | 1 | 1.16mi |
| 4365 Hillside Oaks Montgomery, AL | 2.0 | 2.0 | 1204 | $1,500 | $1.25 | 43d | 1 | 1.16mi |
| 3136 Harrison Rd Montgomery, AL | 3.0 | 1.5 | 1355 | $1,025 | $0.76 | 43d | 1 | 1.18mi |
| 3318 Habersham Rd Montgomery, AL | 3.0 | 2.0 | 1134 | $1,250 | $1.10 | 13d | 1 | 1.19mi |
| 1216 Beechdale Rd Montgomery, AL | 4.0 | 2.0 | 1495 | $1,325 | $0.89 | 43d | 1 | 1.19mi |
| 1229 Karen Rd Montgomery, AL | 4.0 | 2.0 | 1344 | $1,590 | $1.18 | 43d | 1 | 1.25mi |
Listing history 11 events
-
2026-06-18days on market $119,995 Active 77 DOM
-
2026-06-17days on market $119,995 Active 76 DOM
-
2026-06-16days on market $119,995 Active 75 DOM
-
2026-06-15days on market $119,995 Active 74 DOM
-
2026-06-14days on market $119,995 Active 72 DOM
-
2026-06-13pricedays on market $119,995 Active 71 DOM
-
2026-06-10days on market $124,900 Active 69 DOM
-
2026-06-09days on market $124,900 Active 68 DOM
-
2026-06-08days on market $124,900 Active 67 DOM
-
2026-06-07remarks 669-char remark
-
2026-06-07$124,900 Active 66 DOM
ⓘ Source: listings_history table (triggers on properties + properties_extension) + one-shot
backfill from property_details.listing_events for pre-trigger history.
Climate risk First Street
- Flood 1/10 Low FEMA zone X (unshaded) · 0% chance over 30 yrs
- Wildfire 3/10 Moderate
- Heat 7/10 Severe 7 d/yr ≥107°F today · 18 d/yr by 30 yrs out
- Wind 8/10 Severe 80% chance of damaging wind over 30 yrs
- Air quality 3/10 Moderate 4 unhealthy d/yr today · 4 by 30 yrs out
Nearby sold comps map
Loading sold comps map…
Walkable amenities ~0.75 mi
Loading nearby amenities…
Taxation est. · year 1
- Rental income
- $15,909
- − Mortgage interest
- −$6,722
- − Property taxes
- −$1,800
- − Insurance
- −$600
- − Repairs & maintenance
- −$1,273
- − Management
- −$1,273
- − Depreciation
- −$3,491
- Taxable income
- $751
- Est. tax owed @ 24.0%
- −$180
- After-tax cash flow
- $2,437/yr
For passive investors: Depreciation is non-cash, so a rental often shows a tax loss while cash-flowing — sheltering income. Rental losses are passive: they offset passive income freely, and up to $25,000/yr can offset ordinary (W-2) income if you actively participate and your MAGI is under $100k (phasing out to $0 by $150k); unused losses carry forward. On sale, claimed depreciation is recaptured at up to 25%, and gains may owe capital-gains tax (a 1031 exchange can defer both). Figures are a year-1 estimate at your 24.0% rate — not tax advice; consult a CPA.
Condition & rehab AI · 9 photos
This home requires moderate renovations to improve its condition and increase its value. Key areas for improvement include the kitchen, bathrooms, roof, and landscaping.
Repairs flagged
- Moderate kitchen cabinets — dated and in need of replacement
- Moderate bathroom fixtures — basic and in need of updating
- Moderate roof — visible wear and potential leaks
- Moderate landscaping — overgrown vegetation and needs trimming
Value-add opportunities
- Both paint interior walls — enhances curb appeal and interior aesthetics
- Both replace kitchen cabinets — modernizes the space and increases appeal
- Both update bathroom fixtures — modernizes the space and increases appeal
- Both trim landscaping — enhances curb appeal and creates a more inviting front yard
Renovation cost estimate screening
| Repair item | Severity | Est. cost |
|---|---|---|
| kitchen cabinets · dated and in need of replacement | Moderate | $3,000–15,000 |
| bathroom fixtures · basic and in need of updating | Moderate | $3,000–15,000 |
| roof · visible wear and potential leaks | Moderate | $3,000–15,000 |
| landscaping · overgrown vegetation and needs trimming | Moderate | $3,000–15,000 |
| Total estimated repair cost · 4 items | $12,000–60,000 |
Value-add ROI direction
- Both paint interior walls — enhances curb appeal and interior aesthetics ↑
- Both replace kitchen cabinets — modernizes the space and increases appeal ↑
- Both update bathroom fixtures — modernizes the space and increases appeal ↑
- Both trim landscaping — enhances curb appeal and creates a more inviting front yard ↑
ⓘ Cost ranges are severity-bucket heuristics (US national rule-of-thumb). Get contractor quotes + a written scope before underwriting a rehab budget.
Schools (NCES district)
- District
- Montgomery County
- NCES district ID
- 0102430
- Math proficiency
- 9% ▼ -21.00%
- Reading proficiency
- 31% ▼ -1.00%
- Median HH income
- $43,902
- Composite
- 17.24/100
- National rank
- #9093
- State rank
- #106 of 129 in AL
Livability — Montgomery
- Score
- 65/100
- State rank
- #138
- US rank
- #13416
Category grades
Schools grade is shown separately in the Schools card above.
Census & demographics
- Census place
- Montgomery, AL
- County
- Montgomery County · 190,016 people
- City population
- 175,913
- Metro
- Montgomery, AL
- Population (ZIP)
- 23,581
- Household income
- $59,193
- Rent vs Own
- Severe rent burden
- 1039.0
Population outlook (Montgomery County) Hauer SSP2
- Today (2025)
- 224,008 people
- By 2030
- 221,460 · -1.1%
- By 2040
- 214,179 · -4.4%
- By 2050
- 204,912 · -8.5%
- By 2075
- 177,821 · -20.6%
- By 2100
- 145,134 · -35.2%
Race, ethnicity, and origin ACS 2023
- Neighborhood character
- Diverse neighborhood (Simpson 0.60)
- Race & ethnicity
- White 49% Black 39% Hispanic / Latino 8% Two or more races 4%
- Hispanic origin (detail)
- Mexican 4%
- Common ancestry
- Slovak 2% Lithuanian 1% Serbian 1%
- Foreign-born
- 4% · Canada, South Korea
- Languages at home
- 94% English-only · Spanish 5%
Political lean MEDSL · Montgomery
- 2024 margin
- Solid D (+30.7) · D 64.8% · R 34.1% · Other 1.1%
- 2008→2024 swing
- +11.5pp toward D · 2008: 19.2pp · 2024: 30.7pp
- All cycles
- 2024: D+30.7 2020: D+31.5 2016: D+26.2 2012: D+24.3 2008: D+19.2
Not yet ingested
- Civics
- —
Market trends
- HPI YoY
- ▼ -37.64%
- Current HPI
- 149.3867
- Rent YoY
- ▲ 2.65%
- Metro
- Montgomery, AL
- State GDP YoY
- ▲ 2.94%
- F500 in state
- 4
Industry mix (Fortune 500 HQ in AL)
| Industry | F500 HQs | Revenue |
|---|---|---|
| Financial Services | 1 | $8B |
|
||
| Healthcare | 1 | $5B |
|
||
Price history
+78.7% since first listed14 events — show timeline
- 2026-05-27 Relisted — MAAR
- 2026-05-20 Pending — MAAR
- 2026-03-24 Listed $124,900 MAAR
- 2024-12-06 Rental Removed $1,295 MAAR
- 2024-11-16 Price Changed $1,295 MAAR
- 2024-11-09 Price Changed $1,395 MAAR
- 2024-10-17 Listed for Rent $1,450 MAAR
- 2024-08-20 Sold (MLS) $107,900 MAAR
- 2024-08-08 Pending — MAAR
- 2024-07-30 Contingent — MAAR
- 2024-07-15 Price Changed $115,000 MAAR
- 2024-07-05 Listed $120,000 MAAR
- 2011-09-28 Sold (MLS) $62,500 MAAR
- 2010-06-25 Listed $69,900 MAAR
Cash-flow waterfall
monthlySold comps — $/sqft
last 12 mo · ≤1 miLoading sold comps…