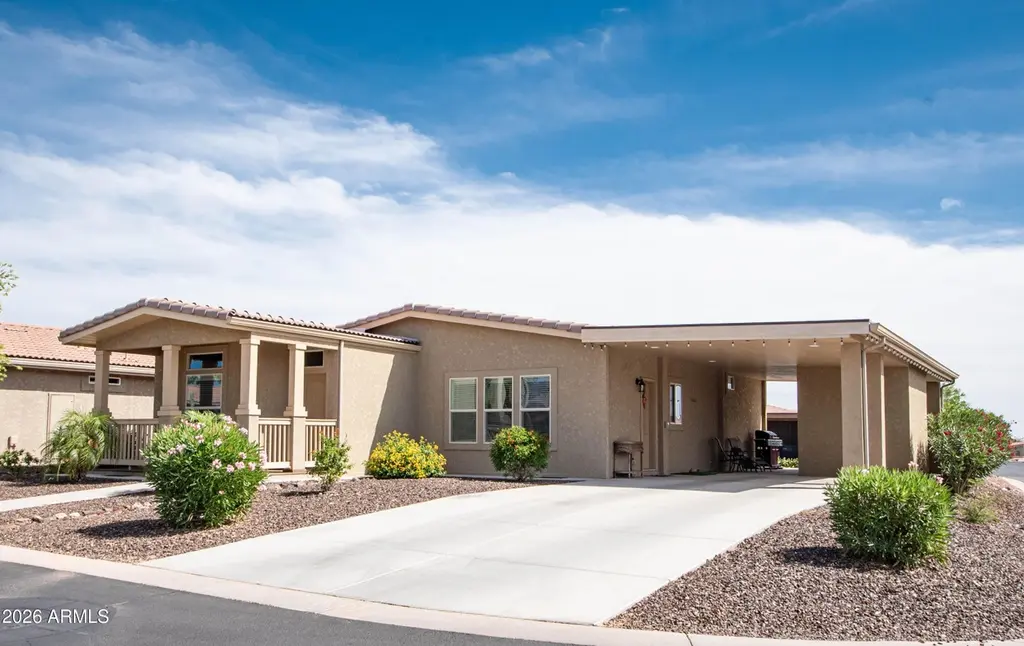
7373 E US Highway 60 -- #361 · Gold Canyon, AZ
Flood risk No data
- FEMA flood zone
- —
- Chance of flooding over 30 yrs
- —
- Est. flood insurance / yr
- —
Fire risk No data
- Est. fire insurance / yr
- —
Heat risk No data
- Hot days now (above threshold)
- —
- Hot days in 30 yrs
- —
Wind risk No data
- Chance of severe wind over 30 yrs
- —
Air-quality risk No data
- Unhealthy air days now
- —
- Unhealthy air days in 30 yrs
- —
Risk factors via First Street. Map © Google.
Why this score? — see what drove the C grade
The composite is a weighted blend of 9 inputs, each scored 0–100. Each bar is that input's sub-score; the figure is the points it added to the 100-point composite (weight × sub-score).
- Cash flow +26.5/30.0
- DSCR +9.1/10.0
- 1% rule +7.1/10.0
- Condition / age +4.0/5.0
- Livability +2.9/5.0
- Rent growth +2.5/5.0
- ARV discount +1.7/15.0
- Schools +1.5/10.0
- Appreciation +0.0/10.0
$264,000
🖨 Deal sheet (PDF) 📄 Offer letter ✓ Due diligence
Listing remarks
Immaculate, bright, and welcoming-this modern home showcases clean lines and thoughtful design throughout. Situated on an oversized corner lot with an extended driveway, this split 3-bedroom, 2-bath residence offers a spacious, light-filled open floor plan. Features include 9-foot ceilings, crown molding, and a well-appointed kitchen w/ stainless steel appliances & large breakfast bar flowing into dining area. Enjoy Arizona living relaxing on your covered front porch or covered back patio that provides an ideal space for relaxing or entertaining. Additional highlights include a covered carport & storage shed. Experience the best of active adult living in the Gated community feat
Key facts
- Oversized corner lot
- Covered front porch
- Open floor plan
Tags
Property features AI
Finance
- Financial info: Current financing: Conventional
- HOA & community: Land lease of $1,200 monthly; Association maintains grounds and streets; Community pool and community spa (heated); Pickleball courts; Tennis courts; Community media room; Biking/walking paths
Exterior
- Parking: 2 covered parking spaces; 2 open parking spaces; Direct access parking; 2 carport spaces
- Security: Gated community; Security guard
- Utilities: City water; Public sewer
- Home design: Manufactured/mobile home; Leasehold ownership; Asphalt road
- Construction: Stucco and painted exterior; Steel frame construction; Tile roof
- Exterior features: Storage; Corner lot; Desert front and back landscaping; Private maintained road; Mountain views; Heated spa (community)
Interior
- Kitchen: Built-in microwave; Kitchen island; Breakfast bar; Refrigerator; Dishwasher; Disposal
- Bedrooms: Up to 3 bedrooms
- Flooring: Carpet; Vinyl; Tile
- Bathrooms: 2 full bathrooms
- Heating & cooling: Electric heating; Central air; Ceiling fans
- Interior features: High-speed internet; Double vanity in bathroom; Breakfast bar; 9+ foot flat ceilings; No interior steps; Kitchen island; Full bathroom in master bedroom; Separate shower and tub; Dual-pane windows; Refrigerator; Dishwasher; Disposal
Neighborhood map
What this means for you Summary
Snapshot
- This is a 3-bed/2.0-bath manufactured listed at $264k. Condition is rated good.
Deal economics
- At list price, monthly cash flow is $700 ($8k/yr) — positive.
- The deal already cash-flows at list — no discount required.
- Meets the 1% rule at list price ($3k rent vs $264k).
- Recommended offer: $256k (3.0% below list) — sets the bar for market timing.
- Cap rate 9.5% vs local median 3.9% in Gold Canyon — top-decile yield for the area; either an underpriced asset or a hidden risk that comps aren't pricing in. Stress-test before assuming the spread holds.
Location & tenants
- Location reads 57/100 on livability (#225 in AZ) — a working-class tenant base; expect higher turnover. Strengths: crime A+, housing A+, employment A; Watch: schools D+, amenities F, commute F.
- Apache Junction Unified District (4443) (suburban): math 15% / reading 20% proficiency, ranked #195 of 249 in AZ (top 78%) — low school quality limits family demand, transient renter base, plan for 1-2y turnover.
- Market conditions: 430 active listings in the ZIP; 9 comparable units currently listed for rent nearby; rentals at typical pace (median 20d on market — plan ~3-4 weeks tenant-placement turnaround); solid renter incomes; 9,504 units permitted in Pinal County in 2024 (776 in 5+ unit buildings).
- This rent runs 44% of the median local income ($86k/yr) — at the standard rent-burdened threshold; future hikes will face affordability resistance.
Forward outlook
- Local home prices are declining (-3.0%/yr); year-one equity from $2k of loan paydown is wiped out by about $8k of value loss. Plan a longer hold.
- At projected returns (-3.0% appreciation + 3.0% rent growth), your $74k cash investment doubles in ~10 years — after that, you're playing with house money.
Negotiation context
- It's been on market 51 days — a 3% lower offer ($256k) is reasonable based on typical stale-listing flexibility.
- 4 sale attempts since 6y ago; this cycle's ask is 7% above the opening price — seller raised mid-cycle; expect resistance to lowballs.
Questions for the listing agent
- It's been on market 51 days. Have you received any prior offers? Is the seller open to a 3% concession, seller financing, or rate buy-down credit?
- Is there a deadline driving the sale (1031 exchange, divorce, estate, relocation)? That informs how much negotiation room exists.
- Schools are D-rated, which usually means shorter tenancies and higher turnover. Who's the typical renter profile here, and what's been the actual vacancy rate?
- What's the average days-on-market for RENTAL listings here right now (not sales)? A rising rental-DOM trend means longer vacancies and softer asking-rent achievability than the comps imply.
- What's the recent tenant-quality profile in this submarket — average credit score on applications, eviction rate, late-payment / NSF rate, and stable-employment percentage? A property-management company in the area should have these aggregated.
- How much new for-sale + rental construction is in the pipeline within 1–3 miles? Heavy new supply typically softens prices + rents 12–24 months out; constrained supply supports both.
Investment metrics
- 1% rule
- 1.21% ✓
- Cap rate
- 9.48%
- Cash-on-cash
- 11.37%
- DSCR
- 1.51
- GRM
- 6.9
CMA / ARV
- ARV (on-the-fly)
- $234,024
- Comps found
- 4
Show comp detail 4 sales within ~0.75 mi
| Address | Dist | Beds/Ba | Sqft | Sold | Price | $/sf | Match |
|---|---|---|---|---|---|---|---|
| 7373 E US Hwy 60 -- #409 | 0.01mi | 2/2.0 (-1) | 1,540 (+11%) | 1mo | $166,500 | $108 | 76 |
| 7373 E US Highway 60 -- #169 | 0.01mi | 2/2.0 (-1) | 1,558 (+12%) | 9mo | $180,000 | $116 | 67 |
| 7373 E US Hwy 60 -- #92 | 0.01mi | 2/2.0 (-1) | 1,300 (-7%) | 24mo | $218,000 | $168 | 63 |
| 6601 E US Highway 60 -- #840 | 0.61mi | 2/2.0 (-1) | 1,250 (-10%) | 12mo | $355,000 | $284 | 39 |
Match score weights: distance 35% · size 25% · config 20% · recency 20%. Top-matched comps best support the ARV.
Projected returns pro-forma
-3.0% appreciation · 3.0% rent growth · sell at horizon
- IRR
- 0.7%
- Equity multiple
- 1.03×
- Total profit
- $1,879
- Equity at exit
- $39,363
- IRR
- 10.3%
- Equity multiple
- 1.80×
- Total profit
- $59,276
- Equity at exit
- $22,826
Cash invested: $73,920 (down + closing). Projections, not guarantees.
Landlord ↔ Tenant lean methodology
- Overall (STATE)
- 87 Strongly Landlord-Friendly
- State Arizona
- 87 Strongly Landlord-Friendly · R+3
- County
- — inherits STATE
- City
- — inherits STATE
ZIP-level market 85118
- Home prices YoY
- -32.4%
- Active inventory
- 430
- Price-to-rent
- 6.9×
Monthly cashflow live
- Estimated rent
- $3,196 high interval (Pro) →
- Mortgage (P&I)
- −$1,384
- Tax est. 1.5%
- −$330 /mo · $3,960/yr
- Insurance
- −$110
- HOA
- −$0
- Vacancy / Maint / Mgmt
- −$671
- Net cashflow
- $700
Break-even live
Sensitivity live
| Price | -10% $883 | -5% $792 | +0% $700 | +5% $609 | +10% $518 |
|---|---|---|---|---|---|
| Rent | -10% $448 | -5% $574 | +0% $700 | +5% $827 | +10% $953 |
| Rate | -1.0pp $833 | -0.5pp $768 | base $700 | +0.5pp $632 | +1.0pp $562 |
UW: 25.0% down · 7.5% · 30yr · 1.5% tax · 5.0% vac · 8.0% maint · 8.0% mgmt
Financing live
Cash to close
- Down payment
- $66,000
- Closing costs
- $7,920
- Reserves months
- —
- Total cash needed
- —
Loan-product check · same deal, 3 products live
Conventional
25% down · 7.5% · 30yr
- Down + closing
- —
- Monthly P&I
- —
- Monthly cashflow
- —
- DSCR
- —
- Eligible?
- —
Personal DTI + credit; lowest rate.
DSCR
20% down · 8.5% · 30yr
- Down + closing
- —
- Monthly P&I
- —
- Monthly cashflow
- —
- DSCR
- —
- Eligible?
- —
No personal income docs; deal must DSCR.
Hard money
10% down · 12.0% · 12mo
- Down + closing
- —
- Monthly P&I
- —
- Monthly cashflow
- —
- DSCR
- —
- Eligible?
- —
Short-term bridge; refi at stabilization.
Rent comps 9 comps
| Address | Beds | Baths | Sqft | Rent | $/sqft | DOM | Units | Dist |
|---|---|---|---|---|---|---|---|---|
| 6497 S Ginty Dr Gold Canyon, AZ | 2.0 | 2.0 | 1673 | $4,300 | $2.57 | 25d | 1 | 0.16mi |
| 6382 S Fairway Dr Gold Canyon, AZ | 2.0 | 2.0 | 1570 | $3,900 | $2.48 | 25d | 1 | 0.38mi |
| 8320 E Masters Rd Gold Canyon, AZ | 2.0 | 2.0 | 1732 | $3,900 | $2.25 | 2d | 1 | 0.50mi |
| 6816 S Russet Sky Way Gold Canyon, AZ | 3.0 | 2.0 | 1366 | $1,800 | $1.32 | 25d | 1 | 0.73mi |
| 6494 S Foothills Dr Gold Canyon, AZ | 3.0 | 2.0 | 1450 | $2,300 | $1.59 | 17d | 1 | 1.00mi |
| 6838 E Las Animas Trl Gold Canyon, AZ | 3.0 | 3.0 | 1638 | $3,500 | $2.14 | 6d | 1 | 1.31mi |
| 4670 S Jalapa Ln Gold Canyon, AZ | 3.0 | 2.0 | 1780 | $4,300 | $2.42 | 25d | 1 | 1.39mi |
| 9797 E La Palma Ave Unit 1 Gold Canyon, AZ | 2.0 | 2.0 | 1100 | $1,395 | $1.27 | 19d | 1 | 1.47mi |
| 9841 E La Palma Ave Gold Canyon, AZ | 2.0 | 2.0 | 995 | $1,200 | $1.21 | 0d | 1 | 1.49mi |
Listing history 23 events
-
2026-06-21days on market $264,000 Active 51 DOM
-
2026-06-18days on market $264,000 Active 48 DOM
-
2026-06-17days on market $264,000 Active 47 DOM
-
2026-06-16days on market $264,000 Active 46 DOM
-
2026-06-15days on market $264,000 Active 45 DOM
-
2026-06-13days on market $264,000 Active 43 DOM
-
2026-06-09days on market $264,000 Active 39 DOM
-
2026-06-08days on market $264,000 Active 38 DOM
-
2026-06-07days on market $264,000 Active 37 DOM
-
2026-06-04days on market $264,000 Active 34 DOM
-
2026-06-03days on market $264,000 Active 33 DOM
-
2026-06-02days on market $264,000 Active 32 DOM
-
2026-06-01days on market $264,000 Active 31 DOM
-
2026-05-31days on market $264,000 Active 30 DOM
-
2026-05-02price $264,000
-
2026-05-01$246,000 Active
-
2024-01-04historical
-
2023-11-04$285,000 Active
-
2023-10-20historical
-
2023-06-22price $281,203
-
2023-05-19$289,900 Active
-
2020-12-31historical
-
2020-10-13$232,900 Active
ⓘ Source: listings_history table (triggers on properties + properties_extension) + one-shot
backfill from property_details.listing_events for pre-trigger history.
Nearby sold comps map
Loading sold comps map…
Walkable amenities ~0.75 mi
Loading nearby amenities…
Taxation est. · year 1
- Rental income
- $38,352
- − Mortgage interest
- −$14,788
- − Property taxes
- −$3,960
- − Insurance
- −$1,320
- − Repairs & maintenance
- −$3,068
- − Management
- −$3,068
- − Depreciation
- −$7,680
- Taxable income
- $4,468
- Est. tax owed @ 24.0%
- −$1,072
- After-tax cash flow
- $7,333/yr
For passive investors: Depreciation is non-cash, so a rental often shows a tax loss while cash-flowing — sheltering income. Rental losses are passive: they offset passive income freely, and up to $25,000/yr can offset ordinary (W-2) income if you actively participate and your MAGI is under $100k (phasing out to $0 by $150k); unused losses carry forward. On sale, claimed depreciation is recaptured at up to 25%, and gains may owe capital-gains tax (a 1031 exchange can defer both). Figures are a year-1 estimate at your 24.0% rate — not tax advice; consult a CPA.
Condition & rehab AI · 12 photos
This modern, well-maintained home in a gated community offers a spacious floor plan and is ready for immediate move-in.
Value-add opportunities
- Both Paint exterior — Enhances curb appeal and value
- Both Replace ceiling fans — Improves air circulation and aesthetics
Renovation cost estimate screening
Value-add ROI direction
- Both Paint exterior — Enhances curb appeal and value ↑
- Both Replace ceiling fans — Improves air circulation and aesthetics ↑
ⓘ Cost ranges are severity-bucket heuristics (US national rule-of-thumb). Get contractor quotes + a written scope before underwriting a rehab budget.
Schools (NCES district)
- District
- Apache Junction Unified District (4443)
- NCES district ID
- 0400790
- Math proficiency
- 15% ▼ -17.00%
- Reading proficiency
- 20% ▼ -13.00%
- Median HH income
- $44,930
- Composite
- 15.34/100
- National rank
- #9325
- State rank
- #195 of 249 in AZ
Livability — Gold Canyon
- Score
- 57/100
- State rank
- #225
- US rank
- #21732
Category grades
Schools grade is shown separately in the Schools card above.
Census & demographics
- Census place
- Gold Canyon, AZ
- County
- Pinal County · 399,947 people
- City population
- 14,932
- Metro
- Phoenix-Mesa-Chandler, AZ
- Population (ZIP)
- 14,932
- Household income
- $86,393
- Rent vs Own
- Severe rent burden
- 160.0
Population outlook (Pinal County) Hauer SSP2
- Today (2025)
- 437,574 people
- By 2030
- 446,903 · +2.1%
- By 2040
- 452,589 · +3.4%
- By 2050
- 444,126 · +1.5%
- By 2075
- 430,300 · -1.7%
- By 2100
- 393,536 · -10.1%
Race, ethnicity, and origin ACS 2023
- Neighborhood character
- Predominantly White (86%)
- Race & ethnicity
- White 86% Hispanic / Latino 8% Two or more races 6%
- Hispanic origin (detail)
- Mexican 7%
- Common ancestry
- Portuguese 7% Romanian 4% Slovak 4%
- Foreign-born
- 5% · Canada
- Languages at home
- 96% English-only · Spanish 3%
Political lean MEDSL · Pinal
- 2024 margin
- Strong R (+22.1) · D 38.5% · R 60.6%
- 2008→2024 swing
- -7.6pp toward R · 2008: -14.5pp · 2024: -22.1pp
- All cycles
- 2024: R+22.1 2020: R+17.3 2016: R+19.3 2012: R+17.1 2008: R+14.5
Not yet ingested
- Civics
- —
Market trends
- HPI YoY
- ▼ -122.27%
- Current HPI
- 255.6958
- Rent YoY
- —
- Metro
- Phoenix-Mesa-Chandler, AZ
- State GDP YoY
- ▲ 4.54%
- F500 in state
- 20
Industry mix (Fortune 500 HQ in AZ)
| Industry | F500 HQs | Revenue |
|---|---|---|
| Technology | 2 | $13B |
|
||
| Mining / Metals | 1 | $23B |
|
||
| Environmental Services | 1 | $16B |
|
||
| Metals / Steel | 1 | $14B |
|
||
| Technology Distribution | 1 | $9B |
|
||
| Homebuilding | 1 | $8B |
|
||
Price history
+13.4% since first listed9 events — show timeline
- 2026-05-02 Price Changed $264,000 ARMLS
- 2026-05-01 Listed $246,000 ARMLS
- 2024-01-04 Listing Removed — ARMLS
- 2023-11-04 Listed $285,000 ARMLS
- 2023-10-20 Listing Removed — ARMLS
- 2023-06-22 Price Changed $281,203 ARMLS
- 2023-05-19 Listed $289,900 ARMLS
- 2020-12-31 Listing Removed — ARMLS
- 2020-10-13 Listed $232,900 ARMLS
Cash-flow waterfall
monthlySold comps — $/sqft
last 12 mo · ≤1 miLoading sold comps…