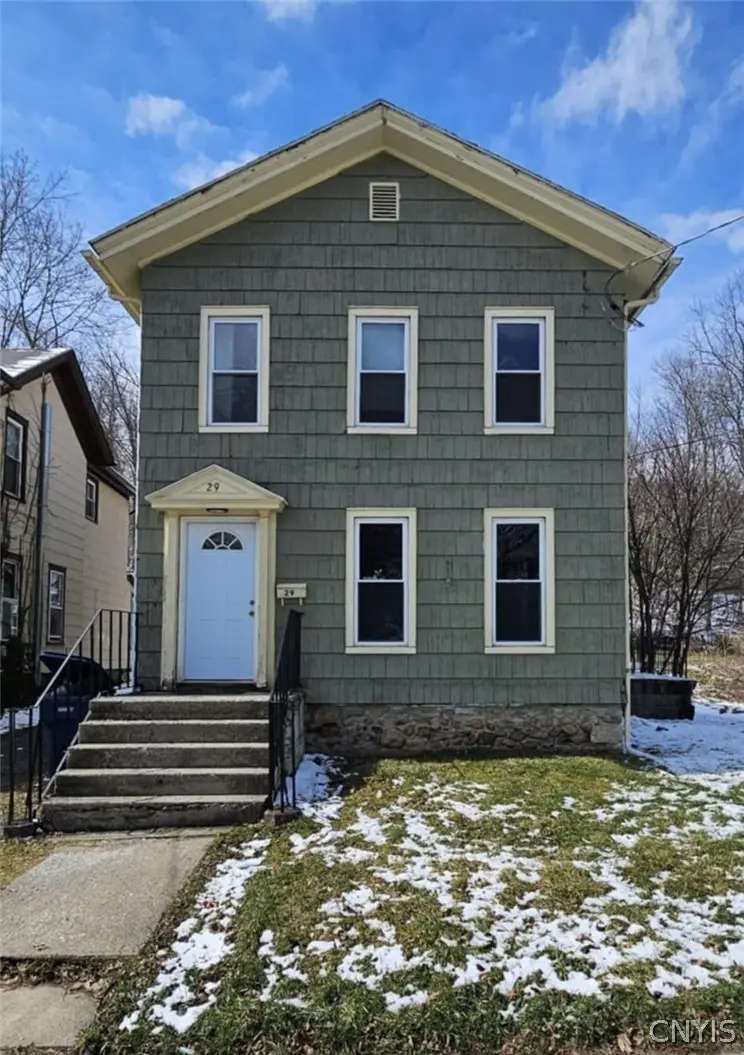
29 Butternut St · Lyons, NY
Flood risk 7/10 · Major
- FEMA flood zone
- X
- Chance of flooding over 30 yrs
- 0.77%
- Est. flood insurance / yr
- $473 – $860
Fire risk 3/10 · Minor
- Est. fire insurance / yr
- $691 – $1,283
Heat risk 2/10 · Minimal
- Hot days now (above 96°F)
- 7 days/yr
- Hot days in 30 yrs
- 15 days/yr
Wind risk 1/10 · Minimal
- Chance of severe wind over 30 yrs
- —
Air-quality risk 2/10 · Minimal
- Unhealthy air days now
- 1 days/yr
- Unhealthy air days in 30 yrs
- 2 days/yr
Risk factors via First Street. Map © Google.
Why this score? — see what drove the A grade
The composite is a weighted blend of 9 inputs, each scored 0–100. Each bar is that input's sub-score; the figure is the points it added to the 100-point composite (weight × sub-score).
- Cash flow +30.0/30.0
- ARV discount +15.0/15.0
- 1% rule +10.0/10.0
- DSCR +10.0/10.0
- Appreciation +10.0/10.0
- Livability +3.8/5.0
- Schools +3.2/10.0
- Rent growth +2.5/5.0
- Condition / age +2.5/5.0
$114,900
🖨 Deal sheet 📄 Offer letter ✓ Due diligence
Listing remarks MLS
Why rent when you can buy?! This home features a new hot water heater, new water service, lots of light and hardwoods throughout. Delayed Showings until Sunday 11/8 at 8 am
Key facts
- Living space
- Manageable lot
- Village home
Tags
Neighborhood map
What this means for you Summary
Snapshot
- This is a 4-bed/1.5-bath single-family listed at $115k.
Deal economics
- At list price, monthly cash flow is $414 ($5k/yr) — positive.
- The deal already cash-flows at list — no discount required.
- Meets the 1% rule at list price ($2k rent vs $115k).
- Recommended offer: $111k (3.0% below list) — sets the bar for market timing.
Location & tenants
- Location reads 75/100 on livability (#270 in NY, #4,307 nationally) — a middle-class / working-renter tenant base. Strengths: cost of living A+, housing A+, health & safety A+; Watch: schools D, employment D, amenities F.
- Lyons Central School District (town): math 33% / reading 42% proficiency, ranked #549 of 590 in NY (top 93%) — families likely to look elsewhere, expect single-tenant / working-renter base with shorter leases.
- Market conditions: 26 active listings in the ZIP; 259 units permitted in Wayne County in 2024 (90 in 5+ unit buildings).
Forward outlook
- In year one you build about $12k of equity ($794 loan paydown + $11k appreciation (10.0% local appreciation)).
- Wayne County population projected at -24% by 2050 — secular population decline; favor cash flow + early exit over multi-decade hold.
- At projected returns (10.0% appreciation + 3.0% rent growth), your $32k cash investment doubles in ~2 years — after that, you're playing with house money.
- By year 3, paydown + projected appreciation supports a ~$31k cash-out refi (75% LTV) — recoverable capital for the next deal without selling this one.
Negotiation context
- It's been on market 56 days — a 3% lower offer ($111k) is reasonable based on typical stale-listing flexibility.
- 3 sale attempts since 8y ago with the ask held roughly flat each time — persistent listings suggest the price (not the market) is what's stuck; bring a comps-based counter.
- Current owner paid $70k; list at $115k implies a 65% gain — meaningful room to come down on a strong offer.
Risks & watch-outs
- Watch-outs: property tax is 2.6% of price; flood insurance adds $56/mo; built in 1860 — expect roof / HVAC / electrical / plumbing capex.
- Climate carrying-cost: major flood risk — expect insurance premiums to compound above CPI over the hold.
Questions for the listing agent
- It's been on market 56 days. Have you received any prior offers? Is the seller open to a 3% concession, seller financing, or rate buy-down credit?
- Built in 1860 — when were the roof, HVAC, electrical panel, plumbing, and water heater last replaced?
- Property tax is high relative to price — has the assessment been appealed recently, and will the sale trigger a re-assessment?
- What's the actual annual flood-insurance premium (NFIP or private), and is the property in a SFHA with mandatory coverage?
- Is there a deadline driving the sale (1031 exchange, divorce, estate, relocation)? That informs how much negotiation room exists.
- Schools are D-rated, which usually means shorter tenancies and higher turnover. Who's the typical renter profile here, and what's been the actual vacancy rate?
- What's the average days-on-market for RENTAL listings here right now (not sales)? A rising rental-DOM trend means longer vacancies and softer asking-rent achievability than the comps imply.
- What's the recent tenant-quality profile in this submarket — average credit score on applications, eviction rate, late-payment / NSF rate, and stable-employment percentage? A property-management company in the area should have these aggregated.
- How much new for-sale + rental construction is in the pipeline within 1–3 miles? Heavy new supply typically softens prices + rents 12–24 months out; constrained supply supports both.
Investment metrics
- 1% rule
- 1.51% ✓
- Cap rate
- 11.20%
- Cash-on-cash
- 17.52%
- DSCR
- 1.78
- GRM
- 5.5
CMA / ARV
- ARV (on-the-fly)
- $148,192
- Comps found
- 12
Show comp detail 12 sales within ~0.75 mi
| Address | Dist | Beds/Ba | Sqft | Sold | Price | $/sf | Match |
|---|---|---|---|---|---|---|---|
| 27 Butternut St | 0.01mi | 3/2.0 (-1) | 1,588 (-6%) | 5mo | $100,000 | $63 | 79 |
| 166 Water St | 0.23mi | 3/1.5 (-1) | 1,732 (+3%) | 8mo | $88,000 | $51 | 73 |
| 30 Cherry St | 0.26mi | 4/2.0 | 1,698 (+1%) | 14mo | $175,000 | $103 | 72 |
| 40 Spencer St | 0.59mi | 4/1.5 | 1,660 (-1%) | 4mo | $149,900 | $90 | 66 |
| 7 High St | 0.06mi | 3/1.5 (-1) | 1,490 (-12%) | 8mo | $115,000 | $77 | 66 |
| 98 Canal St | 0.40mi | 4/1.0 | 1,881 (+12%) | 5mo | $43,000 | $23 | 56 |
| 60 Jackson St | 0.69mi | 3/2.0 (-1) | 1,676 (-0%) | 13mo | $85,000 | $51 | 49 |
| 121 Geneva St | 0.51mi | 3/1.0 (-1) | 1,524 (-10%) | 6mo | $125,000 | $82 | 48 |
| 46 Spencer St | 0.61mi | 3/2.0 (-1) | 1,788 (+6%) | 8mo | $230,000 | $129 | 47 |
| 21 Maple St | 0.45mi | 3/1.0 (-1) | 1,474 (-12%) | 5mo | $144,900 | $98 | 47 |
| 41 Holley St | 0.64mi | 3/1.0 (-1) | 1,868 (+11%) | 3mo | $165,000 | $88 | 42 |
| 88 Maple St | 0.71mi | 3/1.0 (-1) | 1,434 (-15%) | 10mo | $160,000 | $112 | 27 |
Match score weights: distance 35% · size 25% · config 20% · recency 20%. Top-matched comps best support the ARV.
Projected returns pro-forma
10.0% appreciation · 3.0% rent growth · sell at horizon
- IRR
- 35.7%
- Equity multiple
- 3.77×
- Total profit
- $89,080
- Equity at exit
- $103,511
- IRR
- 30.8%
- Equity multiple
- 8.52×
- Total profit
- $241,837
- Equity at exit
- $223,225
Cash invested: $32,172 (down + closing). Projections, not guarantees.
Landlord ↔ Tenant lean methodology
- Overall (STATE)
- 15 Strongly Tenant-Friendly
- State New York
- 15 Strongly Tenant-Friendly · D+10
- County
- — inherits STATE
- City
- — inherits STATE
ZIP-level market 14489
- Home prices YoY
- 14.2%
- Active inventory
- 26
- Price-to-rent
- 5.5×
Monthly cashflow live
- Estimated rent
- $1,737 medium interval (Pro) →
- Mortgage (P&I)
- −$603
- Tax from tax record
- −$252 /mo · $3,024/yr
- Insurance
- −$48
- Flood insurance flood zone
- −$56 /mo · $666/yr
- HOA
- −$0
- Vacancy / Maint / Mgmt
- −$365
- Net cashflow
- $414
Break-even live
UW: 25.0% down · 7.5% · 30yr · 1.5% tax · 5.0% vac · 8.0% maint · 8.0% mgmt
Financing live
Cash to close
- Down payment
- $28,725
- Closing costs
- $3,447
- Reserves months
- —
- Total cash needed
- —
Loan-product check · same deal, 3 products live
Conventional
25% down · 7.5% · 30yr
- Down + closing
- —
- Monthly P&I
- —
- Monthly cashflow
- —
- DSCR
- —
- Eligible?
- —
Personal DTI + credit; lowest rate.
DSCR
20% down · 8.5% · 30yr
- Down + closing
- —
- Monthly P&I
- —
- Monthly cashflow
- —
- DSCR
- —
- Eligible?
- —
No personal income docs; deal must DSCR.
Hard money
10% down · 12.0% · 12mo
- Down + closing
- —
- Monthly P&I
- —
- Monthly cashflow
- —
- DSCR
- —
- Eligible?
- —
Short-term bridge; refi at stabilization.
Listing history 12 events
-
2026-05-14status Pending
-
2026-03-31historical Active Under Contract
-
2026-03-19$114,900 Active
-
2021-02-16soldstatus $69,500 Closed Sale or Rented 172-char remark
Show marketing remark (172 chars)
Why rent when you can buy?! This home features a new hot water heater, new water service, lots of light and hardwoods throughout. Delayed Showings until Sunday 11/8 at 8 am
-
2021-02-10soldstatus $69,500
-
2020-12-07status Under Contract- Do Not Show 172-char remark
Show marketing remark (172 chars)
Why rent when you can buy?! This home features a new hot water heater, new water service, lots of light and hardwoods throughout. Delayed Showings until Sunday 11/8 at 8 am
-
2020-11-18price $69,900 172-char remark
Show marketing remark (172 chars)
Why rent when you can buy?! This home features a new hot water heater, new water service, lots of light and hardwoods throughout. Delayed Showings until Sunday 11/8 at 8 am
-
2020-11-05$74,900 Active 172-char remark
Show marketing remark (172 chars)
Why rent when you can buy?! This home features a new hot water heater, new water service, lots of light and hardwoods throughout. Delayed Showings until Sunday 11/8 at 8 am
-
2018-09-12soldstatus $40,000 Closed Sale or Rented 116-char remark
Show marketing remark (116 chars)
Sold "As Is" Basement, Foundation, HVAC, Water heater/Fuel all unknown Contractors Welcome NOW PENDING
-
2018-08-27status Pending Sale 116-char remark
Show marketing remark (116 chars)
Sold "As Is" Basement, Foundation, HVAC, Water heater/Fuel all unknown Contractors Welcome NOW PENDING
-
2018-07-25$39,900 Active 116-char remark
Show marketing remark (116 chars)
Sold "As Is" Basement, Foundation, HVAC, Water heater/Fuel all unknown Contractors Welcome NOW PENDING
-
1999-11-23soldstatus $45,000
ⓘ Source: listings_history table (triggers on properties + properties_extension) + one-shot
backfill from property_details.listing_events for pre-trigger history.
Tax reassessment forecast NY · Partial reset (capped growth)
- Current annual tax
- $3,024 · $252/mo
- Projected year-2 tax
- $3,024 · $252/mo
- Expected delta
- $0/yr ($0/mo · 0.0%)
ⓘ Screening estimate from a state-policy table — verify with the county assessor before closing.
Climate risk First Street
- Flood 7/10 Severe FEMA zone X · 77% chance over 30 yrs
- Wildfire 3/10 Moderate
- Heat 2/10 Low 7 d/yr ≥96°F today · 15 d/yr by 30 yrs out
- Wind 1/10 Low
- Air quality 2/10 Low 1 unhealthy d/yr today · 2 by 30 yrs out
Nearby sold comps map
Loading sold comps map…
Walkable amenities ~0.75 mi
Loading nearby amenities…
Taxation est. · year 1
- Rental income
- $20,842
- − Mortgage interest
- −$6,436
- − Property taxes
- −$3,024
- − Insurance
- −$1,241
- − Repairs & maintenance
- −$1,667
- − Management
- −$1,667
- − Depreciation
- −$3,343
- Taxable income
- $3,463
- Est. tax owed @ 24.0%
- −$831
- After-tax cash flow
- $4,138/yr
For passive investors: Depreciation is non-cash, so a rental often shows a tax loss while cash-flowing — sheltering income. Rental losses are passive: they offset passive income freely, and up to $25,000/yr can offset ordinary (W-2) income if you actively participate and your MAGI is under $100k (phasing out to $0 by $150k); unused losses carry forward. On sale, claimed depreciation is recaptured at up to 25%, and gains may owe capital-gains tax (a 1031 exchange can defer both). Figures are a year-1 estimate at your 24.0% rate — not tax advice; consult a CPA.
Schools (NCES district)
- District
- Lyons Central School District
- NCES district ID
- 3618030
- Math proficiency
- 33% ▲ 4.00%
- Reading proficiency
- 42% ▼ -28.00%
- Median HH income
- $43,076
- Composite
- 31.73/100
- National rank
- #5909
- State rank
- #549 of 590 in NY
Livability — Lyons
- Score
- 75/100
- State rank
- #270
- US rank
- #4307
Category grades
Schools grade is shown separately in the Schools card above.
Census & demographics
- Census place
- Lyons, NY
- Population (ZIP)
- 7,016
Population outlook (Wayne County) Hauer SSP2
- Today (2025)
- 85,662 people
- By 2030
- 81,945 · -4.3%
- By 2040
- 73,735 · -13.9%
- By 2050
- 65,029 · -24.1%
- By 2075
- 47,451 · -44.6%
- By 2100
- 31,574 · -63.1%
Race, ethnicity, and origin ACS 2023
- Neighborhood character
- Predominantly White (86%)
- Race & ethnicity
- White 86% Hispanic / Latino 8% Two or more races 7% Black 2%
- Hispanic origin (detail)
- Puerto Rican 7%
- Common ancestry
- Iranian 8% Romanian 5% Lithuanian 3%
- Foreign-born
- 1% · Canada
- Languages at home
- 90% English-only · German/W. Germanic 7% Spanish 3% Russian/Polish/Slavic 1%
Political lean MEDSL · Wayne
- 2024 margin
- Strong R (+23.1) · D 38.5% · R 61.5%
- 2008→2024 swing
- -13.2pp toward R · 2008: -9.9pp · 2024: -23.1pp
- All cycles
- 2024: R+23.1 2020: R+19.6 2016: R+26.1 2012: R+9.3 2008: R+9.9
Not yet ingested
- Civics
- —
Market trends
- HPI YoY
- ▲ 38.65%
- Current HPI
- 311.1445
- Rent YoY
- —
- Metro
- —
- State GDP YoY
- ▲ 2.60%
- F500 in state
- 92
Industry mix (Fortune 500 HQ in NY)
| Industry | F500 HQs | Revenue |
|---|---|---|
| Financial Services | 10 | $950B |
|
||
| Consumer Goods | 9 | $162B |
|
||
| Insurance | 4 | $225B |
|
||
| Telecommunications | 2 | $144B |
|
||
| Pharmaceuticals | 2 | $112B |
|
||
| Media / Entertainment | 2 | $69B |
|
||
Price history
+155.3% since first listed12 events — show timeline
- 2026-05-14 Pending — CNYIS
- 2026-03-31 Contingent — CNYIS
- 2026-03-19 Listed $114,900 CNYIS
- 2021-02-16 Sold (MLS) $69,500 UNYREIS
- 2021-02-10 Sold (Public Records) $69,500 Public Records
- 2020-12-07 Pending — UNYREIS
- 2020-11-18 Price Changed $69,900 UNYREIS
- 2020-11-05 Listed $74,900 UNYREIS
- 2018-09-12 Sold (MLS) $40,000 UNYREIS
- 2018-08-27 Pending — UNYREIS
- 2018-07-25 Listed $39,900 UNYREIS
- 1999-11-23 Sold (Public Records) $45,000 Public Records
Property tax history
+4.0%/yrLatest (2025): $3,024 · +71.4% YoY. Source: county tax records.
Cash-flow waterfall
monthlySold comps — $/sqft
last 12 mo · ≤1 miLoading sold comps…