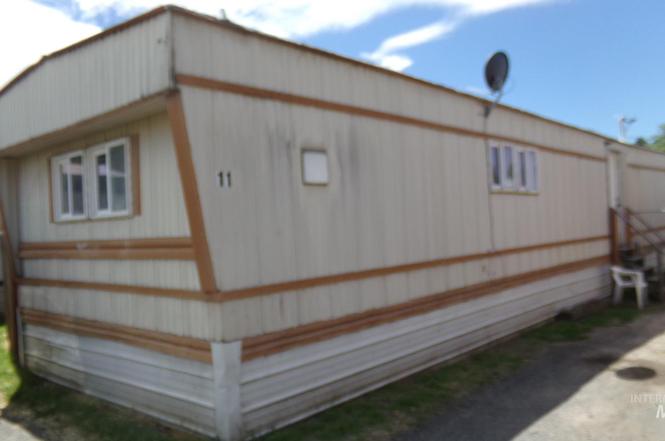
628 Burrell Ave #11 · Lewiston, ID
Flood risk No data
- FEMA flood zone
- —
- Chance of flooding over 30 yrs
- %
- Est. flood insurance / yr
- —
Fire risk No data
- Est. fire insurance / yr
- —
Heat risk No data
- Hot days now (above °F)
- days/yr
- Hot days in 30 yrs
- days/yr
Wind risk No data
- Chance of severe wind over 30 yrs
- %
Air-quality risk No data
- Unhealthy air days now
- days/yr
- Unhealthy air days in 30 yrs
- days/yr
Risk factors via First Street. Map © Google.
Why this score? — see what drove the B grade
The composite is a weighted blend of 9 inputs, each scored 0–100. Each bar is that input's sub-score; the figure is the points it added to the 100-point composite (weight × sub-score).
- Cash flow +30.0/30.0
- 1% rule +10.0/10.0
- DSCR +10.0/10.0
- ARV discount +7.5/15.0
- Schools +4.2/10.0
- Livability +3.8/5.0
- Rent growth +2.5/5.0
- Condition / age +2.5/5.0
- Appreciation +0.0/10.0
$29,500
🖨 Deal sheet 📄 Offer letter ✓ Due diligence
Listing remarks
Affordable living in a good location. Trailer has some improvements with 2 parking spots. Open floor plan and newer deck. New hot water tank-located near the end of the park. Centrally located in the Lewiston Orchards. The park allows pets. Apply with All Valley Property Management. Space Rent $645. More if you have a pet. includes Water/Sewer/Garbage. Must be approved by the park.
Key facts
- Open floor plan
- Allows pets
- New hot water tank
Tags
Neighborhood map
What this means for you Summary
Snapshot
- This is a 2-bed/1.0-bath manufactured listed at $30k.
Deal economics
- At list price, monthly cash flow is $554 ($7k/yr) — positive.
- The deal already cash-flows at list — no discount required.
- Meets the 1% rule at list price ($960 rent vs $30k).
- Cap rate 28.8% vs local median 1.9% in Lewiston — top-decile yield for the area; either an underpriced asset or a hidden risk that comps aren't pricing in. Stress-test before assuming the spread holds.
Location & tenants
- Location reads 75/100 on livability (#30 in ID, #4,281 nationally) — a middle-class / working-renter tenant base. Strengths: housing A+, health & safety A+, cost of living A; Watch: amenities F, commute F.
- Lewiston Independent District (urban): math 44% / reading 54% proficiency, ranked #37 of 92 in ID (top 40%) — families likely to look elsewhere, expect single-tenant / working-renter base with shorter leases.
- Market conditions: 272 active listings in the ZIP; 125 units permitted in Nez Perce County in 2024 (0 in 5+ unit buildings).
- This rent is only 16% of the median local income ($74k/yr) — well below the 30% rent-burden line; pricing power to push rent on renewal without tenant pushback.
Forward outlook
- Local home prices are declining (-3.0%/yr); year-one equity from $204 of loan paydown is wiped out by about $885 of value loss. Plan a longer hold.
- Nez Perce County population projected at +12% by 2050 — modest demand growth; plan on rents tracking national, not racing it.
- At projected returns (-3.0% appreciation + 3.0% rent growth), your $8k cash investment doubles in ~2 years — after that, you're playing with house money.
Negotiation context
- Only 2 days on market — expect competitive offers; lowballing is unlikely to land.
Questions for the listing agent
- Built in 1976 — when were the roof, HVAC, electrical panel, plumbing, and water heater last replaced?
- Is there a deadline driving the sale (1031 exchange, divorce, estate, relocation)? That informs how much negotiation room exists.
- What's the average days-on-market for RENTAL listings here right now (not sales)? A rising rental-DOM trend means longer vacancies and softer asking-rent achievability than the comps imply.
- What's the recent tenant-quality profile in this submarket — average credit score on applications, eviction rate, late-payment / NSF rate, and stable-employment percentage? A property-management company in the area should have these aggregated.
- How much new for-sale + rental construction is in the pipeline within 1–3 miles? Heavy new supply typically softens prices + rents 12–24 months out; constrained supply supports both.
Investment metrics
- 1% rule
- 3.25% ✓
- Cap rate
- 28.84%
- Cash-on-cash
- 80.54%
- DSCR
- 4.58
- GRM
- 2.6
CMA / ARV
- ARV (on-the-fly)
- $66,038
- Comps found
- 6
Show comp detail 6 sales within ~0.75 mi
| Address | Dist | Beds/Ba | Sqft | Sold | Price | $/sf | Match |
|---|---|---|---|---|---|---|---|
| 628 Burrell Ave #7 | 0.00mi | 2/1.0 | 720 (-3%) | 5mo | $25,000 | $35 | 91 |
| 628 Burrell Ave #5 | 0.00mi | 3/2.0 (+1) | 720 (-3%) | 3mo | $9,000 | $13 | 84 |
| 515 Warner Ave #12 | 0.67mi | 2/1.0 | 742 (0%) | 17mo | $69,500 | $94 | 54 |
| 631 Warner Ave. #10 #10 | 0.56mi | 2/1.0 | 784 (+6%) | 13mo | $69,900 | $89 | 54 |
| 631 Warner Ave. #18 Ave | 0.56mi | 2/1.0 | 840 (+13%) | 3mo | $72,500 | $86 | 49 |
| 631 Warner Avenue #17 Ave | 0.56mi | 2/1.0 | 672 (-9%) | 24mo | $65,000 | $97 | 38 |
Match score weights: distance 35% · size 25% · config 20% · recency 20%. Top-matched comps best support the ARV.
Projected returns pro-forma
-3.0% appreciation · 3.0% rent growth · sell at horizon
- IRR
- 80.7%
- Equity multiple
- 4.70×
- Total profit
- $30,543
- Equity at exit
- $4,399
- IRR
- 84.1%
- Equity multiple
- 9.73×
- Total profit
- $72,120
- Equity at exit
- $2,551
Cash invested: $8,260 (down + closing). Projections, not guarantees.
Landlord ↔ Tenant lean methodology
- Overall (STATE)
- 91 Strongly Landlord-Friendly
- State Idaho
- 91 Strongly Landlord-Friendly · R+18
- County
- — inherits STATE
- City
- — inherits STATE
ZIP-level market 83501
- Active inventory
- 272
- Price-to-rent
- 2.6×
Monthly cashflow live
- Estimated rent
- $960 medium interval (Pro) →
- Mortgage (P&I)
- −$155
- Tax est. 1.5%
- −$37 /mo · $442/yr
- Insurance
- −$12
- HOA
- −$0
- Vacancy / Maint / Mgmt
- −$202
- Net cashflow
- $554
Break-even live
UW: 25.0% down · 7.5% · 30yr · 1.5% tax · 5.0% vac · 8.0% maint · 8.0% mgmt
Financing live
Cash to close
- Down payment
- $7,375
- Closing costs
- $885
- Reserves months
- —
- Total cash needed
- —
Loan-product check · same deal, 3 products live
Conventional
25% down · 7.5% · 30yr
- Down + closing
- —
- Monthly P&I
- —
- Monthly cashflow
- —
- DSCR
- —
- Eligible?
- —
Personal DTI + credit; lowest rate.
DSCR
20% down · 8.5% · 30yr
- Down + closing
- —
- Monthly P&I
- —
- Monthly cashflow
- —
- DSCR
- —
- Eligible?
- —
No personal income docs; deal must DSCR.
Hard money
10% down · 12.0% · 12mo
- Down + closing
- —
- Monthly P&I
- —
- Monthly cashflow
- —
- DSCR
- —
- Eligible?
- —
Short-term bridge; refi at stabilization.
Listing history 2 events
-
2026-06-19remarks 384-char remark
-
2026-06-19$29,500 Active 2 DOM
ⓘ Source: listings_history table (triggers on properties + properties_extension) + one-shot
backfill from property_details.listing_events for pre-trigger history.
Nearby sold comps map
Loading sold comps map…
Walkable amenities ~0.75 mi
Loading nearby amenities…
Taxation est. · year 1
- Rental income
- $11,518
- − Mortgage interest
- −$1,652
- − Property taxes
- −$442
- − Insurance
- −$148
- − Repairs & maintenance
- −$921
- − Management
- −$921
- − Depreciation
- −$858
- Taxable income
- $6,574
- Est. tax owed @ 24.0%
- −$1,578
- After-tax cash flow
- $5,075/yr
For passive investors: Depreciation is non-cash, so a rental often shows a tax loss while cash-flowing — sheltering income. Rental losses are passive: they offset passive income freely, and up to $25,000/yr can offset ordinary (W-2) income if you actively participate and your MAGI is under $100k (phasing out to $0 by $150k); unused losses carry forward. On sale, claimed depreciation is recaptured at up to 25%, and gains may owe capital-gains tax (a 1031 exchange can defer both). Figures are a year-1 estimate at your 24.0% rate — not tax advice; consult a CPA.
Schools (NCES district)
- District
- Lewiston Independent District
- NCES district ID
- 1601860
- Math proficiency
- 44% ▬ 0.00%
- Reading proficiency
- 54% ▬ 0.00%
- Median HH income
- $47,224
- Composite
- 41.65/100
- National rank
- #3423
- State rank
- #37 of 92 in ID
Livability — Lewiston
- Score
- 75/100
- State rank
- #30
- US rank
- #4281
Category grades
Schools grade is shown separately in the Schools card above.
Census & demographics
- Census place
- Lewiston, ID
- County
- Nez Perce County · 37,520 people
- City population
- 37,520
- Metro
- Lewiston, ID-WA
- Population (ZIP)
- 37,520
- Household income
- $73,629
- Rent vs Own
- Severe rent burden
- 976.0
Population outlook (Nez Perce County) Hauer SSP2
- Today (2025)
- 42,583 people
- By 2030
- 43,754 · +2.7%
- By 2040
- 45,907 · +7.8%
- By 2050
- 47,819 · +12.3%
- By 2075
- 53,100 · +24.7%
- By 2100
- 55,971 · +31.4%
Race, ethnicity, and origin ACS 2023
- Neighborhood character
- Predominantly White (89%)
- Race & ethnicity
- White 89% Two or more races 5% Hispanic / Latino 5% Native American 2%
- Common ancestry
- Portuguese 6% Slovak 3% Lithuanian 3%
- Foreign-born
- 2% · Canada
- Languages at home
- 97% English-only · Spanish 2%
Political lean MEDSL · Nez Perce
- 2024 margin
- Solid R (+38.6) · D 29.4% · R 68.1% · Other 2.5%
- 2008→2024 swing
- -20.5pp toward R · 2008: -18.1pp · 2024: -38.6pp
- All cycles
- 2024: R+38.6 2020: R+33.6 2016: R+34.1 2012: R+20.9 2008: R+18.1
Not yet ingested
- Civics
- —
Market trends
- HPI YoY
- ▼ -352.77%
- Current HPI
- 229.4958
- Rent YoY
- —
- Metro
- Lewiston, ID-WA
- State GDP YoY
- ▲ 4.51%
- F500 in state
- 6
Industry mix (Fortune 500 HQ in ID)
| Industry | F500 HQs | Revenue |
|---|---|---|
| Retail | 1 | $79B |
|
||
| Technology | 1 | $25B |
|
||
| Food / Agriculture | 1 | $6B |
|
||
Cash-flow waterfall
monthlySold comps — $/sqft
last 12 mo · ≤1 miLoading sold comps…