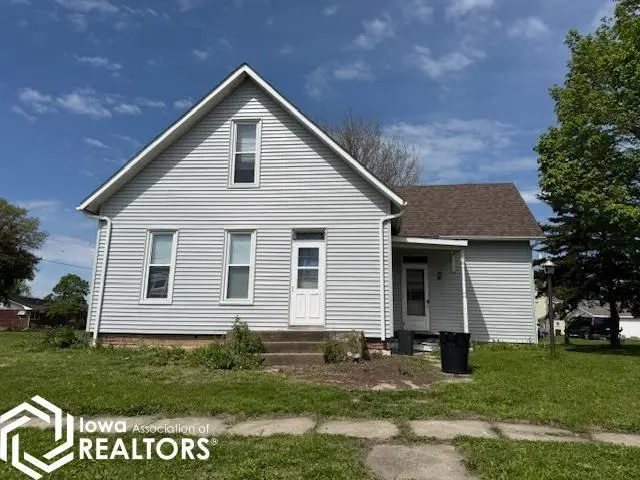
407 S Adams St · Mount Pleasant, IA
Flood risk 1/10 · Minimal
- FEMA flood zone
- X (unshaded)
- Chance of flooding over 30 yrs
- 0.0%
- Est. flood insurance / yr
- $473 – $860
Fire risk 3/10 · Minor
- Est. fire insurance / yr
- $902 – $1,676
Heat risk 3/10 · Minor
- Hot days now (above 106°F)
- 7 days/yr
- Hot days in 30 yrs
- 15 days/yr
Wind risk 2/10 · Minimal
- Chance of severe wind over 30 yrs
- —
Air-quality risk 2/10 · Minimal
- Unhealthy air days now
- 1 days/yr
- Unhealthy air days in 30 yrs
- 2 days/yr
Risk factors via First Street. Map © Google.
Why this score? — see what drove the C- grade
The composite is a weighted blend of 9 inputs, each scored 0–100. Each bar is that input's sub-score; the figure is the points it added to the 100-point composite (weight × sub-score).
- Cash flow +15.4/30.0
- ARV discount +15.0/15.0
- Schools +5.4/10.0
- DSCR +4.7/10.0
- 1% rule +4.3/10.0
- Livability +4.2/5.0
- Rent growth +2.5/5.0
- Condition / age +2.5/5.0
- Appreciation +0.0/10.0
$119,000
🖨 Deal sheet (PDF) 📄 Offer letter ✓ Due diligence
Listing remarks
Enjoy almost 2,000 finished square feet in this home offering 4 bedrooms and 1 1/2 baths. Main level provides large kitchen, dining area, living room, 2 bedrooms, full bath and laundry area. Upper level provides 2 additional bedrooms and 1/2 bath. Large corner lot and 2 car detached garage. Improvements include newer vinyl siding and newer windows!
Key facts
- Laundry area
- Large corner lot
- Newer vinyl siding
Tags
Property features AI
Exterior
- Parking: Detached 2-car garage
- Utilities: Public water; Public sewer
- Home design: Single-family residence; One and one half stories
- Construction: Vinyl siding
- Exterior features: Lot approximately 0.28 acres (80 x 150)
Interior
- Bathrooms: 1 full bathroom; 1 half bathroom
- Heating & cooling: Forced air heating; Central air conditioning
- Interior features: Basement
Neighborhood map
What this means for you Summary
Snapshot
- This is a 3-bed/2.0-bath single-family listed at $119k.
Deal economics
- At list price, monthly cash flow is $46 ($555/yr) — positive.
- The deal already cash-flows at list — no discount required.
- To meet the 1% rule (rent ≥ 1% of price), the offer needs to be $111k (6.7% below list).
- Recommended offer: $111k (6.7% below list) — sets the bar for 1% rule.
- Cap rate 6.8% vs local median 3.3% in Mount Pleasant — top-decile yield for the area; either an underpriced asset or a hidden risk that comps aren't pricing in. Stress-test before assuming the spread holds.
Location & tenants
- Location reads 84/100 on livability (#20 in IA, #662 nationally) — a professional / high-income tenant draw. Strengths: crime A+, cost of living A+, housing A+; Watch: commute F.
- Mount Pleasant Community School District (town): math 63% / reading 66% proficiency, ranked #207 of 289 in IA (top 72%) — acceptable for families but not a draw, mixed tenant base, ~2y average lease.
- Zoned schools: Lincoln Elementary School (math 67% / reading 67%, grade B+, #273 of 616 statewide, top 51%, 211 students, 50% FRL); Mount Pleasant Middle School (math 64% / reading 70%, grade A-, #140 of 246 statewide, top 60%, 406 students, 49% FRL); Mount Pleasant High School (math 65% / reading 67%, grade B, #200 of 336 statewide, top 60%, 582 students, 45% FRL).
- Market conditions: 93 active listings in the ZIP; 30 units permitted in Henry County in 2024 (8 in 5+ unit buildings).
Forward outlook
- Local home prices are declining (-3.0%/yr); year-one equity from $823 of loan paydown is wiped out by about $4k of value loss. Plan a longer hold.
- Henry County population projected to shrink 9% by 2050 — rents likely to lag national; underwrite the cash flow, not the appreciation.
Negotiation context
- It's been on market 45 days — a 3% lower offer ($115k) is reasonable based on typical stale-listing flexibility.
Risks & watch-outs
- Watch-outs: built in 1900 — expect roof / HVAC / electrical / plumbing capex.
Questions for the listing agent
- It's been on market 45 days. Have you received any prior offers? Is the seller open to a 7% concession, seller financing, or rate buy-down credit?
- Built in 1900 — when were the roof, HVAC, electrical panel, plumbing, and water heater last replaced?
- Is there a deadline driving the sale (1031 exchange, divorce, estate, relocation)? That informs how much negotiation room exists.
- Schools are B-rated — typically a magnet for longer-tenancy family renters. What's the average tenant stay here, and is there a school-zone premium baked into asking?
- What's the average days-on-market for RENTAL listings here right now (not sales)? A rising rental-DOM trend means longer vacancies and softer asking-rent achievability than the comps imply.
- What's the recent tenant-quality profile in this submarket — average credit score on applications, eviction rate, late-payment / NSF rate, and stable-employment percentage? A property-management company in the area should have these aggregated.
- How much new for-sale + rental construction is in the pipeline within 1–3 miles? Heavy new supply typically softens prices + rents 12–24 months out; constrained supply supports both.
Investment metrics
- 1% rule
- 0.93% ✗
- Cap rate
- 6.76%
- Cash-on-cash
- 1.67%
- DSCR
- 1.07
- GRM
- 8.9
CMA / ARV
- ARV (median comp)
- $166,671
- List price
- $119,000
- Delta
- -28.60%
- Verdict
- UNDERPRICED
- Comps
- 20 within 1.0 mi
Show comp detail 12 sales within ~0.75 mi
| Address | Dist | Beds/Ba | Sqft | Sold | Price | $/sf | Match |
|---|---|---|---|---|---|---|---|
| 603 E Green St | 0.37mi | 3/2.0 | 1,904 (-1%) | 9mo | $260,000 | $137 | 74 |
| 703 S Adams Ct | 0.25mi | 3/2.5 | 1,820 (-5%) | 8mo | $250,000 | $137 | 71 |
| 203 E Webster St. St | 0.09mi | 3/2.0 | 2,195 (+15%) | 5mo | $211,000 | $96 | 67 |
| 610 E Henry St | 0.56mi | 3/1.5 | 1,843 (-4%) | 0mo | $22,500 | $12 | 65 |
| 505 S Pine St | 0.52mi | 3/2.0 | 1,957 (+2%) | 8mo | $189,900 | $97 | 65 |
| 308 E Washington St | 0.24mi | 4/1.5 (+1) | 1,760 (-8%) | 5mo | $136,000 | $77 | 64 |
| 103 E Henry St | 0.44mi | 3/1.5 | 1,792 (-6%) | 3mo | $130,000 | $73 | 64 |
| 305 S Locust St. St | 0.17mi | 3/1.0 | 1,640 (-14%) | 1mo | $147,450 | $90 | 64 |
| 605 E Clay St. St | 0.36mi | 2/2.0 (-1) | 2,072 (+8%) | 6mo | $179,000 | $86 | 60 |
| 700 W Henry St. St | 0.64mi | 4/2.0 (+1) | 1,974 (+3%) | 2mo | $195,000 | $99 | 58 |
| 511 E Washington St | 0.37mi | 4/2.5 (+1) | 2,172 (+13%) | 2mo | $234,900 | $108 | 51 |
| 415 N Adams St | 0.59mi | 3/1.5 | 1,680 (-12%) | 7mo | $120,223 | $72 | 44 |
Match score weights: distance 35% · size 25% · config 20% · recency 20%. Top-matched comps best support the ARV.
Projected returns pro-forma
-3.0% appreciation · 3.0% rent growth · sell at horizon
- IRR
- -13.6%
- Equity multiple
- 0.51×
- Total profit
- $-16,313
- Equity at exit
- $17,743
- IRR
- -4.7%
- Equity multiple
- 0.69×
- Total profit
- $-10,321
- Equity at exit
- $10,289
Cash invested: $33,320 (down + closing). Projections, not guarantees.
Landlord ↔ Tenant lean methodology
- Overall (STATE)
- 83 Strongly Landlord-Friendly
- State Iowa
- 83 Strongly Landlord-Friendly · R+6
- County
- — inherits STATE
- City
- — inherits STATE
ZIP-level market 52641
- Home prices YoY
- -25.2%
- Active inventory
- 93
- Price-to-rent
- 8.9×
Monthly cashflow live
- Estimated rent
- $1,110 medium interval (Pro) →
- Mortgage (P&I)
- −$624
- Tax from tax record
- −$157 /mo · $1,886/yr
- Insurance
- −$50
- HOA
- −$0
- Vacancy / Maint / Mgmt
- −$233
- Net cashflow
- $46
Break-even live
Sensitivity live
| Price | -10% $114 | -5% $80 | +0% $46 | +5% $13 | +10% $-21 |
|---|---|---|---|---|---|
| Rent | -10% $-41 | -5% $2 | +0% $46 | +5% $90 | +10% $134 |
| Rate | -1.0pp $106 | -0.5pp $77 | base $46 | +0.5pp $15 | +1.0pp $-16 |
UW: 25.0% down · 7.5% · 30yr · 1.5% tax · 5.0% vac · 8.0% maint · 8.0% mgmt
Financing live
Cash to close
- Down payment
- $29,750
- Closing costs
- $3,570
- Reserves months
- —
- Total cash needed
- —
Loan-product check · same deal, 3 products live
Conventional
25% down · 7.5% · 30yr
- Down + closing
- —
- Monthly P&I
- —
- Monthly cashflow
- —
- DSCR
- —
- Eligible?
- —
Personal DTI + credit; lowest rate.
DSCR
20% down · 8.5% · 30yr
- Down + closing
- —
- Monthly P&I
- —
- Monthly cashflow
- —
- DSCR
- —
- Eligible?
- —
No personal income docs; deal must DSCR.
Hard money
10% down · 12.0% · 12mo
- Down + closing
- —
- Monthly P&I
- —
- Monthly cashflow
- —
- DSCR
- —
- Eligible?
- —
Short-term bridge; refi at stabilization.
Listing history 18 events
-
2026-06-21days on market $119,000 Active 45 DOM
-
2026-06-21days on market $119,000 Active 44 DOM
-
2026-06-18days on market $119,000 Active 42 DOM
-
2026-06-17days on market $119,000 Active 41 DOM
-
2026-06-16days on market $119,000 Active 40 DOM
-
2026-06-15days on market $119,000 Active 39 DOM
-
2026-06-13days on market $119,000 Active 37 DOM
-
2026-06-12days on market $119,000 Active 36 DOM
-
2026-06-09days on market $119,000 Active 33 DOM
-
2026-06-08days on market $119,000 Active 32 DOM
-
2026-06-07days on market $119,000 Active 31 DOM
-
2026-06-07days on market $119,000 Active 30 DOM
-
2026-06-04days on market $119,000 Active 27 DOM
-
2026-06-02days on market $119,000 Active 26 DOM
-
2026-06-01days on market $119,000 Active 25 DOM
-
2026-05-31days on market $119,000 Active 24 DOM
-
2026-05-31days on market $119,000 Active 23 DOM
-
2026-05-06$129,900 Active 350-char remark
ⓘ Source: listings_history table (triggers on properties + properties_extension) + one-shot
backfill from property_details.listing_events for pre-trigger history.
Tax reassessment forecast IA · Partial reset (capped growth)
- Current annual tax
- $1,886 · $157/mo
- Projected year-2 tax
- $1,886 · $157/mo
- Expected delta
- $0/yr ($0/mo · 0.0%)
ⓘ Screening estimate from a state-policy table — verify with the county assessor before closing.
Climate risk First Street
- Flood 1/10 Low FEMA zone X (unshaded) · 0% chance over 30 yrs
- Wildfire 3/10 Moderate
- Heat 3/10 Moderate 7 d/yr ≥106°F today · 15 d/yr by 30 yrs out
- Wind 2/10 Low
- Air quality 2/10 Low 1 unhealthy d/yr today · 2 by 30 yrs out
Nearby sold comps map
Loading sold comps map…
Walkable amenities ~0.75 mi
Loading nearby amenities…
Taxation est. · year 1
- Rental income
- $13,323
- − Mortgage interest
- −$6,666
- − Property taxes
- −$1,886
- − Insurance
- −$595
- − Repairs & maintenance
- −$1,066
- − Management
- −$1,066
- − Depreciation
- −$3,462
- Taxable loss
- −$1,418
- Est. tax savings @ 24.0%
- +$340
- After-tax cash flow
- $896/yr
For passive investors: Depreciation is non-cash, so a rental often shows a tax loss while cash-flowing — sheltering income. Rental losses are passive: they offset passive income freely, and up to $25,000/yr can offset ordinary (W-2) income if you actively participate and your MAGI is under $100k (phasing out to $0 by $150k); unused losses carry forward. On sale, claimed depreciation is recaptured at up to 25%, and gains may owe capital-gains tax (a 1031 exchange can defer both). Figures are a year-1 estimate at your 24.0% rate — not tax advice; consult a CPA.
Schools (NCES district)
- District
- Mount Pleasant Community School District
- NCES district ID
- 1919890
- Math proficiency
- 63% ▼ -5.00%
- Reading proficiency
- 66% ▬ 0.00%
- Median HH income
- $46,805
- Composite
- 54.49/100
- National rank
- #1348
- State rank
- #207 of 289 in IA
Livability — Mount Pleasant
- Score
- 84/100
- State rank
- #20
- US rank
- #662
Category grades
Schools grade is shown separately in the Schools card above.
Census & demographics
- Census place
- Mount Pleasant, IA
- Population (ZIP)
- 12,796
Population outlook (Henry County) Hauer SSP2
- Today (2025)
- 19,583 people
- By 2030
- 19,271 · -1.6%
- By 2040
- 18,505 · -5.5%
- By 2050
- 17,796 · -9.1%
- By 2075
- 16,821 · -14.1%
- By 2100
- 15,549 · -20.6%
Race, ethnicity, and origin ACS 2023
- Neighborhood character
- Predominantly White (83%)
- Race & ethnicity
- White 83% Hispanic / Latino 7% Two or more races 6% Black 4% Asian 1%
- Hispanic origin (detail)
- Mexican 4% Puerto Rican 1%
- Common ancestry
- Romanian 3% Portuguese 2% Lithuanian 2%
- Foreign-born
- 3% · Canada
- Languages at home
- 93% English-only · Spanish 4% Other Asian/Pacific 1%
Political lean MEDSL · Henry
- 2024 margin
- Solid R (+36.0) · D 31.3% · R 67.3% · Other 1.5%
- 2008→2024 swing
- -30.9pp toward R · 2008: -5.0pp · 2024: -36.0pp
- All cycles
- 2024: R+36.0 2020: R+32.4 2016: R+30.9 2012: R+6.0 2008: R+5.0
Not yet ingested
- Civics
- —
Market trends
- HPI YoY
- ▼ -60.39%
- Current HPI
- 179.2437
- Rent YoY
- —
- Metro
- —
- State GDP YoY
- ▲ 2.48%
- F500 in state
- 4
Industry mix (Fortune 500 HQ in IA)
| Industry | F500 HQs | Revenue |
|---|---|---|
| Financial Services | 1 | $16B |
|
||
| Retail / Convenience | 1 | $15B |
|
||
Price history
-8.4% since first listed2 events — show timeline
- 2026-05-27 Price Changed $119,000 IAR
- 2026-05-06 Listed $129,900 IAR
Property tax history
+9.5%/yrLatest (2025): $1,886 · +5.5% YoY. Source: county tax records.
Cash-flow waterfall
monthlySold comps — $/sqft
last 12 mo · ≤1 miLoading sold comps…