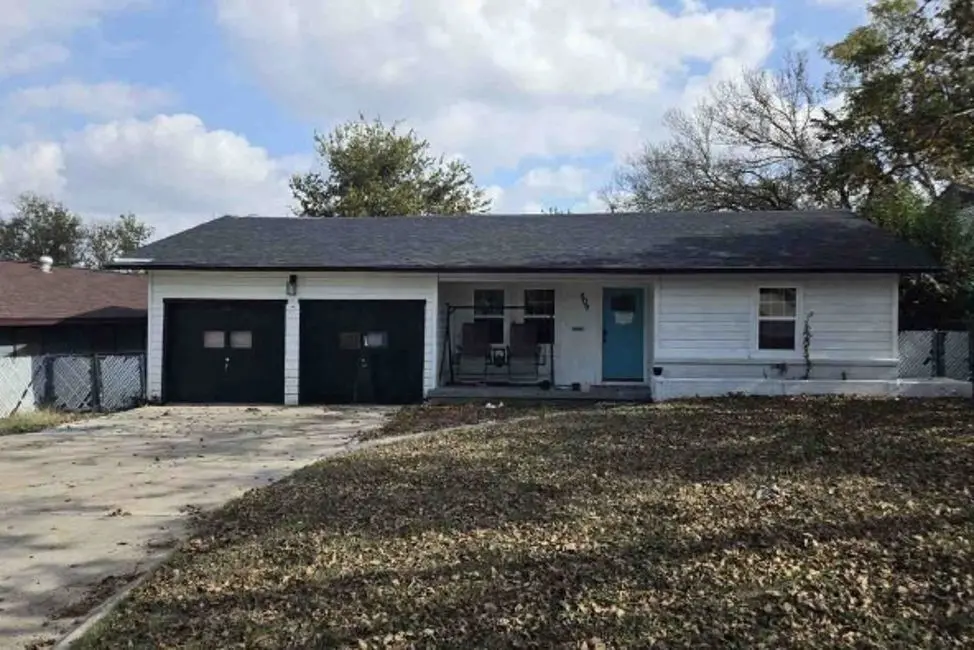
809 S 36th St · Temple, TX
Flood risk 1/10 · Minimal
- FEMA flood zone
- X (unshaded)
- Chance of flooding over 30 yrs
- 0.0%
- Est. flood insurance / yr
- $507 – $1,088
Fire risk 3/10 · Minor
- Est. fire insurance / yr
- $1,222 – $2,270
Heat risk 8/10 · Major
- Hot days now (above 108°F)
- 7 days/yr
- Hot days in 30 yrs
- 24 days/yr
Wind risk 6/10 · Moderate
- Chance of severe wind over 30 yrs
- 77.0%
Air-quality risk 1/10 · Minimal
- Unhealthy air days now
- 0 days/yr
- Unhealthy air days in 30 yrs
- 0 days/yr
Risk factors via First Street. Map © Google.
Why this score? — see what drove the B- grade
The composite is a weighted blend of 9 inputs, each scored 0–100. Each bar is that input's sub-score; the figure is the points it added to the 100-point composite (weight × sub-score).
- Cash flow +23.6/30.0
- ARV discount +15.0/15.0
- 1% rule +8.0/10.0
- DSCR +7.6/10.0
- Livability +3.8/5.0
- Rent growth +3.4/5.0
- Schools +2.7/10.0
- Condition / age +2.5/5.0
- Appreciation +0.0/10.0
$110,700
🖨 Deal sheet 📄 Offer letter ✓ Due diligence
Listing remarks MLS
This home features 3 bedrooms 2 bathrooms
Key facts
- 6,825 sq ft lot
- 2 garage spots
- Built 1962
Neighborhood map
What this means for you Summary
Snapshot
- This is a 3-bed/2.0-bath single-family listed at $111k.
Deal economics
- At list price, monthly cash flow is $209 ($3k/yr) — positive.
- The deal already cash-flows at list — no discount required.
- Meets the 1% rule at list price ($1k rent vs $111k).
- Recommended offer: $101k (9.0% below list) — sets the bar for market timing.
- Cap rate 8.6% vs local median 3.6% in Temple — top-decile yield for the area; either an underpriced asset or a hidden risk that comps aren't pricing in. Stress-test before assuming the spread holds.
Location & tenants
- Location reads 75/100 on livability (#122 in TX, #3,814 nationally) — a middle-class / working-renter tenant base. Strengths: cost of living A+, housing A+, health & safety A+; Watch: schools C-, commute C-, crime D+.
- Temple ISD (urban): math 32% / reading 31% proficiency, ranked #590 of 826 in TX (top 71%) — families likely to look elsewhere, expect single-tenant / working-renter base with shorter leases; 66% free/reduced lunch — lower-income household profile, screen leases tightly.
- Market conditions: Rents rising (+3.4%/yr); 335 active listings in the ZIP; 40 comparable units currently listed for rent nearby; rentals leasing fast (median 14d on market — plan ~1-2 weeks tenant-placement turnaround); 3,222 units permitted in Bell County in 2024 (246 in 5+ unit buildings).
Forward outlook
- Local home prices are declining (-3.0%/yr); year-one equity from $765 of loan paydown is wiped out by about $3k of value loss. Plan a longer hold.
- Bell County population projected at +21% by 2050 — long-run rental-demand tailwind backs the buy-and-hold thesis.
Negotiation context
- It's been on market 115 days — a 9% lower offer ($101k) is reasonable based on typical stale-listing flexibility.
- 5 sale attempts since 4y ago; this cycle's ask has dropped $16k (13%) from the opening price — seller is motivated, your offer sets the floor, not the list.
Risks & watch-outs
- Watch-outs: property tax is 3.2% of price.
- Climate carrying-cost: major wind risk, 77% chance of damaging wind over 30y; extreme-heat days projected 7→24/yr by 2055 (HVAC capex compounding) — expect insurance premiums to compound above CPI over the hold.
Questions for the listing agent
- It's been on market 115 days. Have you received any prior offers? Is the seller open to a 9% concession, seller financing, or rate buy-down credit?
- Built in 1962 — when were the roof, HVAC, electrical panel, plumbing, and water heater last replaced?
- Property tax is high relative to price — has the assessment been appealed recently, and will the sale trigger a re-assessment?
- Why hasn't it sold? Are there any deal-killer items the seller is aware of (foundation, flood, title, zoning, code violations)?
- Is there a deadline driving the sale (1031 exchange, divorce, estate, relocation)? That informs how much negotiation room exists.
- Crime grade is D in this area — have there been break-ins, vandalism, or insurance claims at this property in the last 3 years? What carrier currently insures it and at what premium?
- What's the average days-on-market for RENTAL listings here right now (not sales)? A rising rental-DOM trend means longer vacancies and softer asking-rent achievability than the comps imply.
- What's the recent tenant-quality profile in this submarket — average credit score on applications, eviction rate, late-payment / NSF rate, and stable-employment percentage? A property-management company in the area should have these aggregated.
- How much new for-sale + rental construction is in the pipeline within 1–3 miles? Heavy new supply typically softens prices + rents 12–24 months out; constrained supply supports both.
Investment metrics
- 1% rule
- 1.30% ✓
- Cap rate
- 8.56%
- Cash-on-cash
- 8.08%
- DSCR
- 1.36
- GRM
- 6.4
CMA / ARV
- ARV (median comp)
- $149,940
- List price
- $110,700
- Delta
- -26.17%
- Verdict
- UNDERPRICED
- Comps
- 20 within 1.0 mi
Show comp detail 9 sales within ~0.75 mi
| Address | Dist | Beds/Ba | Sqft | Sold | Price | $/sf | Match |
|---|---|---|---|---|---|---|---|
| 1906 E Avenue G | 0.12mi | 4/2.0 (+1) | 1,347 (+3%) | 6mo | $102,000 | $76 | 79 |
| 908 S 22nd St | 0.44mi | 3/2.0 | 1,318 (+1%) | 6mo | $163,000 | $124 | 73 |
| 1914 E Avenue G | 0.11mi | 3/2.0 | 1,452 (+11%) | 9mo | $100,000 | $69 | 70 |
| 707 S 34th St | 0.09mi | 3/1.5 | 1,436 (+10%) | 10mo | $86,000 | $60 | 69 |
| 815 S 24th St | 0.30mi | 3/2.0 | 1,248 (-5%) | 16mo | $179,000 | $143 | 65 |
| 902 S 24th St | 0.33mi | 4/2.0 (+1) | 1,425 (+9%) | 1mo | $184,999 | $130 | 64 |
| 1106 S 26th St | 0.35mi | 2/1.0 (-1) | 1,128 (-14%) | 1mo | $30,500 | $27 | 51 |
| 1504 E Central Ave | 0.68mi | 3/2.0 | 1,454 (+11%) | 9mo | $90,000 | $62 | 42 |
| 916 E Avenue B | 0.72mi | 3/2.0 | 1,428 (+9%) | 19mo | $210,000 | $147 | 36 |
Match score weights: distance 35% · size 25% · config 20% · recency 20%. Top-matched comps best support the ARV.
Projected returns pro-forma
-3.0% appreciation · 3.44% rent growth · sell at horizon
- IRR
- -3.3%
- Equity multiple
- 0.87×
- Total profit
- $-3,884
- Equity at exit
- $16,506
- IRR
- 7.0%
- Equity multiple
- 1.54×
- Total profit
- $16,864
- Equity at exit
- $9,571
Cash invested: $30,996 (down + closing). Projections, not guarantees.
Landlord ↔ Tenant lean methodology
- Overall (STATE)
- 87 Strongly Landlord-Friendly
- State Texas
- 87 Strongly Landlord-Friendly · R+5
- County
- — inherits STATE
- City
- — inherits STATE
ZIP-level market 76501
- Rents YoY
- 3.4%
- Active inventory
- 335
- Price-to-rent
- 6.4×
Monthly cashflow live
- Estimated rent
- $1,434 high interval (Pro) →
- Mortgage (P&I)
- −$581
- Tax from tax record
- −$297 /mo · $3,566/yr
- Insurance
- −$46
- HOA
- −$0
- Vacancy / Maint / Mgmt
- −$301
- Net cashflow
- $209
Break-even live
UW: 25.0% down · 7.5% · 30yr · 1.5% tax · 5.0% vac · 8.0% maint · 8.0% mgmt
Financing live
Cash to close
- Down payment
- $27,675
- Closing costs
- $3,321
- Reserves months
- —
- Total cash needed
- —
Loan-product check · same deal, 3 products live
Conventional
25% down · 7.5% · 30yr
- Down + closing
- —
- Monthly P&I
- —
- Monthly cashflow
- —
- DSCR
- —
- Eligible?
- —
Personal DTI + credit; lowest rate.
DSCR
20% down · 8.5% · 30yr
- Down + closing
- —
- Monthly P&I
- —
- Monthly cashflow
- —
- DSCR
- —
- Eligible?
- —
No personal income docs; deal must DSCR.
Hard money
10% down · 12.0% · 12mo
- Down + closing
- —
- Monthly P&I
- —
- Monthly cashflow
- —
- DSCR
- —
- Eligible?
- —
Short-term bridge; refi at stabilization.
Rent comps 40 comps
| Address | Beds | Baths | Sqft | Rent | $/sqft | DOM | Units | Dist |
|---|---|---|---|---|---|---|---|---|
| 1906 East Avenue G Unit G Temple, TX | 4.0 | 2.0 | 1347 | $1,600 | $1.19 | 23d | 1 | 0.15mi |
| 1702 E Heritage Ave Temple, TX | 3.0 | 2.0 | 1718 | $1,400 | $0.81 | 43d | 1 | 0.18mi |
| 708 S 28th St Unit 28th St unit 708 A Temple, TX | 3.0 | 2.5 | 1355 | $1,435 | $1.06 | 43d | 1 | 0.25mi |
| 805 S 24th St Temple, TX | 3.0 | 2.0 | 1233 | $1,245 | $1.01 | 43d | 1 | 0.30mi |
| 820 S 24th St Unit B Temple, TX | 3.0 | 2.5 | 1300 | $1,435 | $1.10 | 13d | 1 | 0.32mi |
| 612 S 26th St Temple, TX | 3.0 | 2.0 | 1237 | $1,195 | $0.97 | 43d | 1 | 0.33mi |
| 1001 S Terrace St Temple, TX | 3.0 | 2.0 | 1090 | $1,015 | $0.93 | 13d | 1 | 0.36mi |
| 613 S 24th St Temple, TX | 3.0 | 2.0 | 1028 | $1,290 | $1.25 | 23d | 1 | 0.36mi |
| 1218 S 26th St Unit A Temple, TX | 3.0 | 1.0 | 900 | $850 | $0.94 | 23d | 1 | 0.39mi |
| 1115 S #B S Terrace ST Unit Terrace St unit 1115 B Temple, TX | 3.0 | 2.5 | 1355 | $1,435 | $1.06 | 43d | 1 | 0.40mi |
| 903 S 18th St Temple, TX | 3.0 | 2.0 | 1144 | $1,295 | $1.13 | 13d | 1 | 0.50mi |
| 234 Dolphin Dr Unit 234 A Dolphin Temple, TX | 3.0 | 2.0 | 1379 | $1,350 | $0.98 | 13d | 1 | 0.60mi |
| 226 Dolphin Dr Unit 226 A Dolphin Temple, TX | 3.0 | 3.0 | 1455 | $1,450 | $1.00 | 13d | 1 | 0.60mi |
| 222 Dolphin Dr Unit 222 A Dolphin Temple, TX | 3.0 | 3.0 | 1455 | $1,450 | $1.00 | 13d | 1 | 0.61mi |
| 218 Dolphin Dr Unit 218 A Dolphin Temple, TX | 3.0 | 2.0 | 1379 | $1,350 | $0.98 | 13d | 1 | 0.61mi |
| 306 Dolphin Dr Unit 306 A Dolphin Temple, TX | 3.0 | 2.0 | 1379 | $1,350 | $0.98 | 13d | 1 | 0.61mi |
| 518 S Knob St Unit B Temple, TX | 3.0 | 2.0 | 1090 | $1,015 | $0.93 | 13d | 1 | 0.63mi |
| 708 Henderson St Temple, TX | 3.0 | 2.0 | 1090 | $1,025 | $0.94 | 13d | 1 | 0.65mi |
| 121 Dolphin Dr Unit 121 A Dolphin Temple, TX | 3.0 | 2.0 | 1379 | $1,350 | $0.98 | 13d | 1 | 0.65mi |
| 117 Dolphin Dr Unit 117 A Dolphin Temple, TX | 3.0 | 2.0 | 1379 | $1,350 | $0.98 | 13d | 1 | 0.67mi |
| 110 Dolphin Dr Unit A Temple, TX | 3.0 | 2.0 | 1378 | $1,350 | $0.98 | 13d | 1 | 0.67mi |
| 703 S 16th St Temple, TX | 3.0 | 2.0 | 1090 | $1,035 | $0.95 | 13d | 1 | 0.68mi |
| 503 Henderson St Temple, TX | 3.0 | 2.0 | 1090 | $1,015 | $0.93 | 13d | 1 | 0.68mi |
| 501 Henderson St Temple, TX | 4.0 | 2.0 | 1223 | $1,050 | $0.86 | 13d | 1 | 0.68mi |
| 307 Riptide Rd Temple, TX | 3.0 | 2.0 | 1400 | $1,500 | $1.07 | 13d | 1 | 0.69mi |
| 103 Dolphin Dr Unit B Temple, TX | 3.0 | 2.0 | 1373 | $1,550 | $1.13 | 43d | 1 | 0.70mi |
| 104 S 22nd St Unit B Temple, TX | 3.0 | 2.5 | 1300 | $1,435 | $1.10 | 43d | 1 | 0.71mi |
| 209 S 18th St Temple, TX | 3.0 | 2.5 | 1250 | $1,400 | $1.12 | 43d | 1 | 0.72mi |
| 209 S 18th St Unit A Temple, TX | 3.0 | 2.0 | 1250 | $1,550 | $1.24 | 13d | 1 | 0.72mi |
| 209 S 18th St Unit A Temple, TX | 3.0 | 2.0 | 1250 | $1,550 | $1.24 | 23d | 1 | 0.72mi |
| 2321 Ocean Ave Unit B Temple, TX | 3.0 | 2.0 | 1310 | $1,400 | $1.07 | 43d | 1 | 0.72mi |
| 2321 Ocean Ave Unit B Temple, TX | 3.0 | 2.0 | 1310 | $1,400 | $1.07 | 13d | 1 | 0.72mi |
| 509 S 16th St Temple, TX | 3.0 | 2.0 | 1090 | $1,065 | $0.98 | 13d | 1 | 0.72mi |
| 505 S 16th St Temple, TX | 3.0 | 2.0 | 1090 | $1,070 | $0.98 | 13d | 1 | 0.73mi |
| 215 Riptide Rd Unit A Temple, TX | 3.0 | 2.0 | 1345 | $1,400 | $1.04 | 43d | 1 | 0.73mi |
| 2310 Ocean Ave Unit A Temple, TX | 3.0 | 2.0 | 1300 | $1,425 | $1.10 | 43d | 1 | 0.73mi |
| 2322 Ocean Ave Temple, TX | 3.0 | 2.0 | 1300 | $1,495 | $1.15 | 13d | 1 | 0.75mi |
| 101 Riptide Rd Temple, TX | 3.0 | 2.0 | 1310 | $1,495 | $1.14 | 21d | 1 | 0.78mi |
| 101 S 50th St Unit 1324867P Temple, TX | 3.0 | 2.0 | 1194 | $4,293 | $3.60 | 21d | 1 | 0.79mi |
| 603 East Avenue M Unit B Temple, TX | 3.0 | 1.0 | 900 | $945 | $1.05 | 43d | 1 | 0.80mi |
Listing history 32 events
-
2026-06-18days on market $110,700 Active 115 DOM
-
2026-06-17days on market $110,700 Active 114 DOM
-
2026-06-16days on market $110,700 Active 113 DOM
-
2026-06-15days on market $110,700 Active 112 DOM
-
2026-06-14days on market $110,700 Active 110 DOM
-
2026-06-10days on market $110,700 Active 107 DOM
-
2026-06-09days on market $110,700 Active 106 DOM
-
2026-06-08days on market $110,700 Active 105 DOM
-
2026-06-07days on market $110,700 Active 104 DOM
-
2026-06-03days on market $110,700 Active 100 DOM
-
2026-06-02days on market $110,700 Active 99 DOM
-
2026-06-01days on market $110,700 Active 98 DOM
-
2026-05-31days on market $110,700 Active 97 DOM
-
2026-05-30days on market $110,700 Active 96 DOM
-
2026-04-10price $110,700 41-char remark
Show marketing remark (41 chars)
This home features 3 bedrooms 2 bathrooms
-
2026-02-23$127,100 Active 41-char remark
Show marketing remark (41 chars)
This home features 3 bedrooms 2 bathrooms
-
2023-03-31status Pending
-
2023-03-22soldstatus
-
2023-03-21soldstatus Closed
-
2023-02-18historical Active Under Contract
-
2023-02-11status Active
-
2023-02-06historical Active Under Contract
-
2023-02-06historical Active Under Contract
-
2023-01-26price $194,000
-
2023-01-26price $194,000
-
2023-01-08$198,000 Active
-
2023-01-05$198,000 Active
-
2022-05-24status Pending
-
2022-05-20$99,000 Active
-
2006-04-26soldstatus
-
2004-05-05soldstatus
-
1995-04-07soldstatus
ⓘ Source: listings_history table (triggers on properties + properties_extension) + one-shot
backfill from property_details.listing_events for pre-trigger history.
Tax reassessment forecast TX · Resets to sale price
- Current annual tax
- $3,566 · $297/mo
- Projected year-2 tax
- $3,566 · $297/mo
- Expected delta
- $0/yr ($0/mo · -0.0%)
ⓘ Screening estimate from a state-policy table — verify with the county assessor before closing.
Climate risk First Street
- Flood 1/10 Low FEMA zone X (unshaded) · 0% chance over 30 yrs
- Wildfire 3/10 Moderate
- Heat 8/10 Severe 7 d/yr ≥108°F today · 24 d/yr by 30 yrs out
- Wind 6/10 Major 77% chance of damaging wind over 30 yrs
- Air quality 1/10 Low 0 unhealthy d/yr today · 0 by 30 yrs out
Nearby sold comps map
Loading sold comps map…
Walkable amenities ~0.75 mi
Loading nearby amenities…
Taxation est. · year 1
- Rental income
- $17,204
- − Mortgage interest
- −$6,201
- − Property taxes
- −$3,566
- − Insurance
- −$554
- − Repairs & maintenance
- −$1,376
- − Management
- −$1,376
- − Depreciation
- −$3,220
- Taxable income
- $911
- Est. tax owed @ 24.0%
- −$219
- After-tax cash flow
- $2,287/yr
For passive investors: Depreciation is non-cash, so a rental often shows a tax loss while cash-flowing — sheltering income. Rental losses are passive: they offset passive income freely, and up to $25,000/yr can offset ordinary (W-2) income if you actively participate and your MAGI is under $100k (phasing out to $0 by $150k); unused losses carry forward. On sale, claimed depreciation is recaptured at up to 25%, and gains may owe capital-gains tax (a 1031 exchange can defer both). Figures are a year-1 estimate at your 24.0% rate — not tax advice; consult a CPA.
Schools (NCES district)
- District
- Temple ISD
- NCES district ID
- 4842330
- Math proficiency
- 32% ▼ -8.00%
- Reading proficiency
- 31% ▼ -4.00%
- Median HH income
- $43,120
- Composite
- 26.8/100
- National rank
- #7123
- State rank
- #590 of 826 in TX
Livability — Temple
- Score
- 75/100
- State rank
- #122
- US rank
- #3814
Category grades
Schools grade is shown separately in the Schools card above.
Census & demographics
- Census place
- Temple, TX
- County
- Bell County · 345,090 people
- City population
- 96,587
- Metro
- Killeen-Temple, TX
- Population (ZIP)
- 17,752
- Household income
- $62,532
- Rent vs Own
- Severe rent burden
- 466.0
Population outlook (Bell County) Hauer SSP2
- Today (2025)
- 371,114 people
- By 2030
- 389,104 · +4.8%
- By 2040
- 420,592 · +13.3%
- By 2050
- 447,779 · +20.7%
- By 2075
- 499,130 · +34.5%
- By 2100
- 505,680 · +36.3%
Race, ethnicity, and origin ACS 2023
- Neighborhood character
- Diverse neighborhood (Simpson 0.67)
- Race & ethnicity
- White 42% Hispanic / Latino 36% Two or more races 18% Black 17% Native American 2%
- Hispanic origin (detail)
- Mexican 31% Puerto Rican 2%
- Common ancestry
- Romanian 3% Italian 2% Slovak 1%
- Foreign-born
- 6% · Canada
- Languages at home
- 79% English-only · Spanish 20%
Political lean MEDSL · Bell
- 2024 margin
- R (+16.2) · D 41.3% · R 57.6% · Other 1.1%
- 2008→2024 swing
- -6.5pp toward R · 2008: -9.8pp · 2024: -16.2pp
- All cycles
- 2024: R+16.2 2020: R+8.5 2016: R+15.1 2012: R+16.4 2008: R+9.8
Not yet ingested
- Civics
- —
Market trends
- HPI YoY
- ▼ -113.09%
- Current HPI
- 177.0555
- Rent YoY
- ▲ 3.44%
- Metro
- Killeen-Temple, TX
- State GDP YoY
- ▲ 3.95%
- F500 in state
- 110
Industry mix (Fortune 500 HQ in TX)
| Industry | F500 HQs | Revenue |
|---|---|---|
| Energy | 16 | $1,198B |
|
||
| Technology | 5 | $198B |
|
||
| Engineering / Construction | 4 | $72B |
|
||
| Energy Services | 3 | $60B |
|
||
| Utilities | 3 | $41B |
|
||
| Healthcare | 2 | $330B |
|
||
Price history
+11.8% since first listed18 events — show timeline
- 2026-04-10 Price Changed $110,700 HARMLS
- 2026-02-23 Listed $127,100 HARMLS
- 2023-03-31 Pending — CTXMLS
- 2023-03-22 Sold (Public Records) — Public Records
- 2023-03-21 Sold (MLS) — Unlock MLS
- 2023-02-18 Contingent — CTXMLS
- 2023-02-11 Relisted — CTXMLS
- 2023-02-06 Contingent — Unlock MLS
- 2023-02-06 Contingent — CTXMLS
- 2023-01-26 Price Changed $194,000 Unlock MLS
- 2023-01-26 Price Changed $194,000 CTXMLS
- 2023-01-08 Listed $198,000 Unlock MLS
- 2023-01-05 Listed $198,000 CTXMLS
- 2022-05-24 Pending — CTXMLS
- 2022-05-20 Listed $99,000 CTXMLS
- 2006-04-26 Sold (Public Records) — Public Records
- 2004-05-05 Sold (Public Records) — Public Records
- 1995-04-07 Sold (Public Records) — Public Records
Property tax history
+8.1%/yrLatest (2025): $3,566 · +12.3% YoY. Source: county tax records.
Cash-flow waterfall
monthlySold comps — $/sqft
last 12 mo · ≤1 miLoading sold comps…