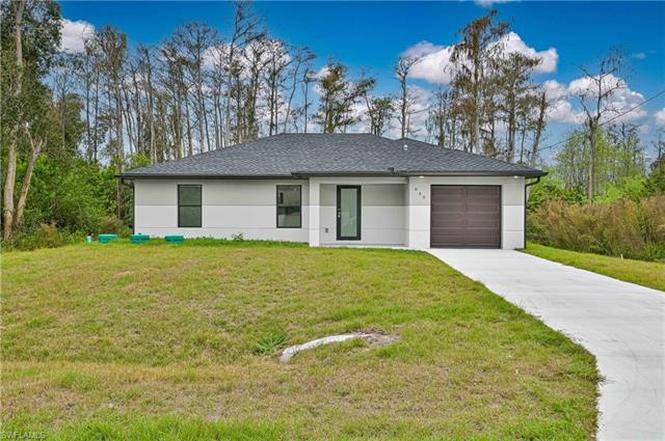
640 Lydia St · Lehigh Acres, FL
Flood risk 6/10 · Moderate
- FEMA flood zone
- X (unshaded)
- Chance of flooding over 30 yrs
- 0.68%
- Est. flood insurance / yr
- $507 – $1,088
Fire risk 5/10 · Moderate
- Est. fire insurance / yr
- $947 – $1,759
Heat risk 9/10 · Severe
- Hot days now (above 108°F)
- 7 days/yr
- Hot days in 30 yrs
- 27 days/yr
Wind risk 10/10 · Severe
- Chance of severe wind over 30 yrs
- 99.0%
Air-quality risk 2/10 · Minimal
- Unhealthy air days now
- 1 days/yr
- Unhealthy air days in 30 yrs
- 2 days/yr
Risk factors via First Street. Map © Google.
Why this score? — see what drove the D grade
The composite is a weighted blend of 9 inputs, each scored 0–100. Each bar is that input's sub-score; the figure is the points it added to the 100-point composite (weight × sub-score).
- Appreciation +10.0/10.0
- Cash flow +7.9/30.0
- ARV discount +7.5/15.0
- Schools +4.1/10.0
- Livability +3.0/5.0
- Condition / age +2.5/5.0
- 1% rule +2.4/10.0
- DSCR +1.9/10.0
- Rent growth +1.3/5.0
$264,900
🖨 Deal sheet 📄 Offer letter ✓ Due diligence
Listing remarks MLS
Location Location Locations. .. Great lot off of Hwy 82 in Lehigh Acres, 15 mins to Ft. Myers Airport and major shopping, 30 mins to beaches. Buy now in one of the fastest developing cities in the US.
Key facts
- Epoxy flooring
- Granite countertops
- Quarter-acre lot
Tags
Property features AI
Finance
- Other: Oversize lot on 0.26 acres (wooded area view); Zoned RS-1; Located in Lehigh Acres development
- HOA & community: No HOA maintenance or amenities; Community type: see remarks
Exterior
- Parking: Attached 1-car garage
- Security: Impact resistant doors and windows
- Utilities: Well water; Septic sewer; Electric service (central)
- Home design: Single-family residential (Florida style); One story; Rear exposure facing south
- Construction: Concrete block and poured concrete construction; Shingle roof; Built in 2025
- Exterior features: Room for pool; Stucco exterior; Impact resistant doors and windows; Single-hung impact resistant windows
Interior
- Kitchen: Range; Self-cleaning oven; Microwave; Dishwasher; Refrigerator; Freezer; Refrigerator/ice maker
- Bedrooms: 3 bedrooms
- Flooring: Tile
- Bathrooms: 2 full bathrooms; Master bath with combo tub and shower
- Heating & cooling: Central electric heat; Central electric cooling; Cable available
- Interior features: Cable prewire; Smoke detectors; Vaulted ceiling; Walk-in closet; Open porch/lanai; Split-bedroom floor plan; Laundry in residence; Unfurnished
- Laundry & utility: Washer; Dryer; Auto garage door opener
Neighborhood map
What this means for you Summary
Snapshot
- This is a 3-bed/2.0-bath land listed at $265k.
Deal economics
- At list price, monthly cash flow is $-287 ($-3k/yr) — negative.
- To cash-flow at today's rent, offer at most $223k (15.7% below list).
- To meet the 1% rule (rent ≥ 1% of price), the offer needs to be $195k (26.3% below list).
- Recommended offer: $195k (26.3% below list) — sets the bar for 1% rule.
Location & tenants
- Location reads 59/100 on livability (#826 in FL) — a working-class tenant base; expect higher turnover. Strengths: cost of living A+, housing A+; Watch: crime C-, employment D+, schools D-.
- Lee (suburban): math 47% / reading 50% proficiency, ranked #42 of 73 in FL (top 58%) — families likely to look elsewhere, expect single-tenant / working-renter base with shorter leases.
- Market conditions: Rents falling (-4.7%/yr); 2460 active listings in the ZIP; 21 comparable units currently listed for rent nearby; rentals at typical pace (median 21d on market — plan ~3-4 weeks tenant-placement turnaround); 15,411 units permitted in Lee County in 2024 (4,686 in 5+ unit buildings).
- This rent runs 32% of the median local income ($72k/yr) — at the standard rent-burdened threshold; future hikes will face affordability resistance.
Forward outlook
- In year one you build about $28k of equity ($2k loan paydown + $26k appreciation (10.0% local appreciation)).
- Lee County population projected at +44% by 2050 — long-run rental-demand tailwind backs the buy-and-hold thesis.
- By year 2, paydown + projected appreciation supports a ~$46k cash-out refi (75% LTV) — recoverable capital for the next deal without selling this one.
Negotiation context
- It's been on market 143 days — a 12% lower offer ($233k) is reasonable based on typical stale-listing flexibility.
- 5 sale attempts since 4y ago with the ask held roughly flat each time — persistent listings suggest the price (not the market) is what's stuck; bring a comps-based counter.
- Current owner paid $17k; list at $265k implies a 1458% gain — meaningful room to come down on a strong offer.
Risks & watch-outs
- Climate carrying-cost: major flood risk; severe wind risk, 99% chance of damaging wind over 30y; moderate wildfire risk; extreme-heat days projected 7→27/yr by 2055 (HVAC capex compounding) — expect insurance premiums to compound above CPI over the hold.
Questions for the listing agent
- What do current leases actually rent for vs. the listed asking? Can we see a recent rent roll and the last 12 months of T-12 income?
- It's been on market 143 days. Have you received any prior offers? Is the seller open to a 26% concession, seller financing, or rate buy-down credit?
- Why hasn't it sold? Are there any deal-killer items the seller is aware of (foundation, flood, title, zoning, code violations)?
- Is there a deadline driving the sale (1031 exchange, divorce, estate, relocation)? That informs how much negotiation room exists.
- Schools are D-rated, which usually means shorter tenancies and higher turnover. Who's the typical renter profile here, and what's been the actual vacancy rate?
- The area grade is low — what's the realistic commute time and amenity access for the typical tenant pool here? Any planned neighborhood developments (good or bad) we should know about?
- What's the average days-on-market for RENTAL listings here right now (not sales)? A rising rental-DOM trend means longer vacancies and softer asking-rent achievability than the comps imply.
- What's the recent tenant-quality profile in this submarket — average credit score on applications, eviction rate, late-payment / NSF rate, and stable-employment percentage? A property-management company in the area should have these aggregated.
- How much new for-sale + rental construction is in the pipeline within 1–3 miles? Heavy new supply typically softens prices + rents 12–24 months out; constrained supply supports both.
Investment metrics
- 1% rule
- 0.74% ✗
- Cap rate
- 4.99%
- Cash-on-cash
- -4.65%
- DSCR
- 0.79
- GRM
- 11.3
CMA / ARV
No comps found within radius.
Projected returns pro-forma
10.0% appreciation · 0.0% rent growth · sell at horizon
- IRR
- 20.1%
- Equity multiple
- 2.62×
- Total profit
- $120,276
- Equity at exit
- $238,643
- IRR
- 17.8%
- Equity multiple
- 5.83×
- Total profit
- $358,392
- Equity at exit
- $514,642
Cash invested: $74,172 (down + closing). Projections, not guarantees.
Landlord ↔ Tenant lean methodology
- Overall (STATE)
- 87 Strongly Landlord-Friendly
- State Florida
- 87 Strongly Landlord-Friendly · R+3
- County
- — inherits STATE
- City
- — inherits STATE
ZIP-level market 33974
- Home prices YoY
- 5.8%
- Rents YoY
- -4.7%
- Active inventory
- 2460
- Price-to-rent
- 11.3×
Monthly cashflow live
- Estimated rent
- $1,954 high interval (Pro) →
- Mortgage (P&I)
- −$1,389
- Tax est. 1.5%
- −$331 /mo · $3,974/yr
- Insurance
- −$110
- HOA
- −$0
- Vacancy / Maint / Mgmt
- −$410
- Net cashflow
- $-287
Break-even live
UW: 25.0% down · 7.5% · 30yr · 1.5% tax · 5.0% vac · 8.0% maint · 8.0% mgmt
Financing live
Cash to close
- Down payment
- $66,225
- Closing costs
- $7,947
- Reserves months
- —
- Total cash needed
- —
Loan-product check · same deal, 3 products live
Conventional
25% down · 7.5% · 30yr
- Down + closing
- —
- Monthly P&I
- —
- Monthly cashflow
- —
- DSCR
- —
- Eligible?
- —
Personal DTI + credit; lowest rate.
DSCR
20% down · 8.5% · 30yr
- Down + closing
- —
- Monthly P&I
- —
- Monthly cashflow
- —
- DSCR
- —
- Eligible?
- —
No personal income docs; deal must DSCR.
Hard money
10% down · 12.0% · 12mo
- Down + closing
- —
- Monthly P&I
- —
- Monthly cashflow
- —
- DSCR
- —
- Eligible?
- —
Short-term bridge; refi at stabilization.
Rent comps 21 comps
| Address | Beds | Baths | Sqft | Rent | $/sqft | DOM | Units | Dist |
|---|---|---|---|---|---|---|---|---|
| 711 Nimitz Blvd Lehigh Acres, FL | 4.0 | 2.0 | 1571 | $2,191 | $1.39 | 3d | 1 | 0.41mi |
| 558 Nimitz Blvd Lehigh Acres, FL | 3.0 | 2.0 | 1186 | $1,595 | $1.34 | 23d | 1 | 0.45mi |
| 737 Almelia St E Lehigh Acres, FL | 3.0 | 2.0 | 1404 | $1,745 | $1.24 | 21d | 1 | 0.50mi |
| 548 Knapp St Lehigh Acres, FL | 3.0 | 2.0 | 1182 | $1,565 | $1.32 | 14d | 1 | 0.52mi |
| 736 Barcia St E Lehigh Acres, FL | 4.0 | 2.0 | 1833 | $1,775 | $0.97 | 23d | 1 | 0.57mi |
| 1092 Norton Ave S Lehigh Acres, FL | 2.0 | 1.0 | 896 | $1,450 | $1.62 | 2d | 1 | 0.64mi |
| 1076 Gunby Ave S Lehigh Acres, FL | 3.0 | 2.0 | 1258 | $2,100 | $1.67 | 23d | 1 | 0.82mi |
| 1111 Gunby Ave S Unit S Lehigh Acres, FL | 3.0 | 2.0 | 1546 | $2,200 | $1.42 | 1d | 1 | 0.85mi |
| 652 Keller St E Lehigh Acres, FL | 3.0 | 2.0 | 1417 | $1,861 | $1.31 | 21d | 1 | 0.87mi |
| 750 Newhall St E Lehigh Acres, FL | 3.0 | 2.0 | 1147 | $1,675 | $1.46 | 19d | 1 | 0.95mi |
| 750 Newhall St E Lehigh Acres, FL | 3.0 | 2.0 | 1147 | $1,675 | $1.46 | 23d | 1 | 0.95mi |
| 804 Gaylord Ave S Lehigh Acres, FL | 4.0 | 2.0 | 1833 | $1,875 | $1.02 | 23d | 1 | 0.98mi |
| 771 Gaylord Ave S Lehigh Acres, FL | 3.0 | 2.0 | 1523 | $2,000 | $1.31 | 23d | 1 | 1.03mi |
| 826 Dawhert Ave S Lehigh Acres, FL | 4.0 | 2.0 | 1365 | $1,750 | $1.28 | 3d | 1 | 1.10mi |
| 814 Crystal Ave S Lehigh Acres, FL | 3.0 | 2.0 | 1865 | $1,815 | $0.97 | 23d | 1 | 1.12mi |
| 758 Worth Ave Lehigh Acres, FL | 3.0 | 2.0 | 1360 | $2,000 | $1.47 | 15d | 1 | 1.13mi |
| 528 Raintree St E Lehigh Acres, FL | 4.0 | 3.0 | 1400 | $1,700 | $1.21 | 23d | 1 | 1.30mi |
| 1018 Garnet Ave Lehigh Acres, FL | 3.0 | 2.0 | 1381 | $1,575 | $1.14 | 23d | 1 | 1.30mi |
| 744 Oakridge Ave S Lehigh Acres, FL | 3.0 | 2.0 | 1493 | $2,000 | $1.34 | 19d | 1 | 1.31mi |
| 760 Festival Ave S Lehigh Acres, FL | 3.0 | 2.0 | 1650 | $2,000 | $1.21 | 23d | 1 | 1.41mi |
| 719 Fullerton Ave S Lehigh Acres, FL | 3.0 | 2.0 | 1650 | $2,000 | $1.21 | 19d | 1 | 1.42mi |
Listing history 25 events
-
2026-06-17days on market $264,900 Active 143 DOM
-
2026-06-16days on market $264,900 Active 142 DOM
-
2026-06-15days on market $264,900 Active 141 DOM
-
2026-06-13days on market $264,900 Active 139 DOM
-
2026-06-10days on market $264,900 Active 136 DOM
-
2026-06-09days on market $264,900 Active 135 DOM
-
2026-06-07days on market $264,900 Active 133 DOM
-
2026-06-02days on market $264,900 Active 128 DOM
-
2026-06-01days on market $264,900 Active 127 DOM
-
2026-06-01days on market $264,900 Active 126 DOM
-
2026-05-19status Active
-
2026-05-15status Pending
-
2026-03-27price $264,900
-
2026-02-17price $269,000
-
2026-01-21$274,000 Active
-
2024-01-08soldstatus $17,000
-
2024-01-05soldstatus $17,000 Closed 200-char remark
Show marketing remark (200 chars)
Location Location Locations. .. Great lot off of Hwy 82 in Lehigh Acres, 15 mins to Ft. Myers Airport and major shopping, 30 mins to beaches. Buy now in one of the fastest developing cities in the US.
-
2023-12-26status Pending 200-char remark
Show marketing remark (200 chars)
Location Location Locations. .. Great lot off of Hwy 82 in Lehigh Acres, 15 mins to Ft. Myers Airport and major shopping, 30 mins to beaches. Buy now in one of the fastest developing cities in the US.
-
2023-12-13status Active 200-char remark
Show marketing remark (200 chars)
Location Location Locations. .. Great lot off of Hwy 82 in Lehigh Acres, 15 mins to Ft. Myers Airport and major shopping, 30 mins to beaches. Buy now in one of the fastest developing cities in the US.
-
2023-11-01status Pending 200-char remark
Show marketing remark (200 chars)
Location Location Locations. .. Great lot off of Hwy 82 in Lehigh Acres, 15 mins to Ft. Myers Airport and major shopping, 30 mins to beaches. Buy now in one of the fastest developing cities in the US.
-
2023-03-17$17,000 Active 200-char remark
Show marketing remark (200 chars)
Location Location Locations. .. Great lot off of Hwy 82 in Lehigh Acres, 15 mins to Ft. Myers Airport and major shopping, 30 mins to beaches. Buy now in one of the fastest developing cities in the US.
-
2023-03-17historical
Show marketing remark (200 chars)
Location Location Locations. .. Great lot off of Hwy 82 in Lehigh Acres, 15 mins to Ft. Myers Airport and major shopping, 30 mins to beaches. Buy now in one of the fastest developing cities in the US.
-
2022-03-18$17,000 Active
-
2005-02-22soldstatus $25,500
-
2005-02-03soldstatus $25,500
ⓘ Source: listings_history table (triggers on properties + properties_extension) + one-shot
backfill from property_details.listing_events for pre-trigger history.
Climate risk First Street
- Flood 6/10 Major FEMA zone X (unshaded) · 68% chance over 30 yrs
- Wildfire 5/10 Major
- Heat 9/10 Extreme 7 d/yr ≥108°F today · 27 d/yr by 30 yrs out
- Wind 10/10 Extreme 99% chance of damaging wind over 30 yrs
- Air quality 2/10 Low 1 unhealthy d/yr today · 2 by 30 yrs out
Nearby sold comps map
Loading sold comps map…
Walkable amenities ~0.75 mi
Loading nearby amenities…
Taxation est. · year 1
- Rental income
- $23,443
- − Mortgage interest
- −$14,839
- − Property taxes
- −$3,974
- − Insurance
- −$1,324
- − Repairs & maintenance
- −$1,875
- − Management
- −$1,875
- − Depreciation
- −$7,706
- Taxable loss
- −$8,150
- Est. tax savings @ 24.0%
- +$1,956
- After-tax cash flow
- $-1,492/yr
For passive investors: Depreciation is non-cash, so a rental often shows a tax loss while cash-flowing — sheltering income. Rental losses are passive: they offset passive income freely, and up to $25,000/yr can offset ordinary (W-2) income if you actively participate and your MAGI is under $100k (phasing out to $0 by $150k); unused losses carry forward. On sale, claimed depreciation is recaptured at up to 25%, and gains may owe capital-gains tax (a 1031 exchange can defer both). Figures are a year-1 estimate at your 24.0% rate — not tax advice; consult a CPA.
Schools (NCES district)
- District
- Lee
- NCES district ID
- 1201080
- Math proficiency
- 47% ▼ -11.00%
- Reading proficiency
- 50% ▼ -4.00%
- Median HH income
- $49,518
- Composite
- 41.49/100
- National rank
- #3458
- State rank
- #42 of 73 in FL
Livability — Lehigh Acres
- Score
- 59/100
- State rank
- #826
- US rank
- #20055
Category grades
Schools grade is shown separately in the Schools card above.
Census & demographics
- Census place
- Lehigh Acres, FL
- County
- Lee County · 788,662 people
- City population
- 130,638
- Metro
- Cape Coral-Fort Myers, FL
- Population (ZIP)
- 19,927
- Household income
- $72,192
- Rent vs Own
- Severe rent burden
- 434.0
Population outlook (Lee County) Hauer SSP2
- Today (2025)
- 871,946 people
- By 2030
- 955,468 · +9.6%
- By 2040
- 1,113,587 · +27.7%
- By 2050
- 1,256,891 · +44.1%
- By 2075
- 1,560,270 · +78.9%
- By 2100
- 1,726,848 · +98.0%
Race, ethnicity, and origin ACS 2023
- Neighborhood character
- Diverse neighborhood (Simpson 0.64)
- Race & ethnicity
- Hispanic / Latino 52% Two or more races 31% White 26% Black 18%
- Hispanic origin (detail)
- Mexican 12% Puerto Rican 7% Cuban 20% Dominican 4%
- Common ancestry
- Hispanic 7% Italian 1% Portuguese 1%
- Foreign-born
- 32% · Canada, Jamaica
- Languages at home
- 48% English-only · Spanish 43% French/Haitian/Cajun 7% Other Indo-European 1%
Political lean MEDSL · Lee
- 2024 margin
- Strong R (+28.4) · D 35.5% · R 63.9%
- 2008→2024 swing
- -18.0pp toward R · 2008: -10.4pp · 2024: -28.4pp
- All cycles
- 2024: R+28.4 2020: R+19.2 2016: R+20.4 2012: R+16.6 2008: R+10.4
Not yet ingested
- Civics
- —
Market trends
- HPI YoY
- ▲ 16.53%
- Current HPI
- 303.3399
- Rent YoY
- ▼ -4.68%
- Metro
- Cape Coral-Fort Myers, FL
- State GDP YoY
- ▲ 3.28%
- F500 in state
- 36
Industry mix (Fortune 500 HQ in FL)
| Industry | F500 HQs | Revenue |
|---|---|---|
| Industrial Technology | 2 | $29B |
|
||
| Insurance | 2 | $17B |
|
||
| Retail | 1 | $60B |
|
||
| Technology Distribution | 1 | $58B |
|
||
| Homebuilding | 1 | $35B |
|
||
| Technology Manufacturing | 1 | $35B |
|
||
Price history
+938.8% since first listed15 events — show timeline
- 2026-05-19 Relisted — NAPLESMLS
- 2026-05-15 Pending — NAPLESMLS
- 2026-03-27 Price Changed $264,900 NAPLESMLS
- 2026-02-17 Price Changed $269,000 NAPLESMLS
- 2026-01-21 Listed $274,000 NAPLESMLS
- 2024-01-08 Sold (Public Records) $17,000 Public Records
- 2024-01-05 Sold (MLS) $17,000 FORTMLS
- 2023-12-26 Pending — FORTMLS
- 2023-12-13 Relisted — FORTMLS
- 2023-11-01 Pending — FORTMLS
- 2023-03-17 Listing Removed — FORTMLS
- 2023-03-17 Listed $17,000 FORTMLS
- 2022-03-18 Listed $17,000 FORTMLS
- 2005-02-22 Sold (Public Records) $25,500 Public Records
- 2005-02-03 Sold (MLS) $25,500 FORTMLS
Property tax history
+17.9%/yrLatest (2025): $447 · +25.9% YoY. Source: county tax records.
Cash-flow waterfall
monthlySold comps — $/sqft
last 12 mo · ≤1 miLoading sold comps…