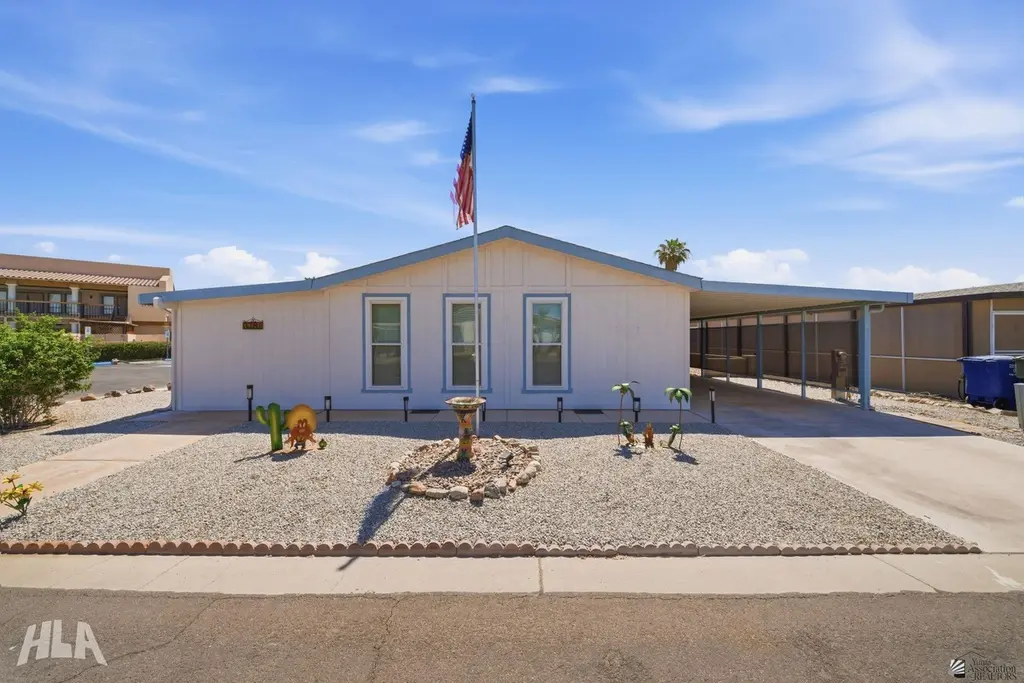
3781 S Lakeside Dr · Yuma, AZ
Flood risk 1/10 · Minimal
- FEMA flood zone
- X (shaded)
- Chance of flooding over 30 yrs
- 0.0%
- Est. flood insurance / yr
- $507 – $1,088
Fire risk 4/10 · Minor
- Est. fire insurance / yr
- $610 – $1,132
Heat risk 9/10 · Severe
- Hot days now (above 113°F)
- 7 days/yr
- Hot days in 30 yrs
- 18 days/yr
Wind risk 1/10 · Minimal
- Chance of severe wind over 30 yrs
- —
Air-quality risk 2/10 · Minimal
- Unhealthy air days now
- 2 days/yr
- Unhealthy air days in 30 yrs
- 2 days/yr
Risk factors via First Street. Map © Google.
Why this score? — see what drove the D grade
The composite is a weighted blend of 9 inputs, each scored 0–100. Each bar is that input's sub-score; the figure is the points it added to the 100-point composite (weight × sub-score).
- Cash flow +21.9/30.0
- DSCR +7.0/10.0
- 1% rule +5.1/10.0
- Livability +3.6/5.0
- Condition / age +2.5/5.0
- Rent growth +2.4/5.0
- Schools +1.3/10.0
- ARV discount +0.0/15.0
- Appreciation +0.0/10.0
$179,900
🖨 Deal sheet 📄 Offer letter ✓ Due diligence
Listing remarks MLS
Come see this beautiful, manufactured home located in a desirable 55+ community! With 2 bedrooms and 2 bathrooms, this home boasts plenty of space for comfortable living. Inside you'll find great updates- new windows throughout, remodeled showers with custom tile work, new cabinet doors with cushion shut, and a new HVAC system. Don't miss the AZ room, perfect for enjoying the beautiful weather! Conveniently located by the golf course, shopping and restaurants. HOA provides great amenities for just $65/mo.
Key facts
- Clubhouse
- Updated bathrooms
- Updated kitchen
Tags
Property features AI
Finance
- HOA & community: Homeowners association with $70 monthly fee; Located in the Desert Lakes subdivision; Senior community; Curbs in community
Exterior
- Parking: Attached carport (2 covered spaces); Total 2 parking spaces
- Utilities: Public water; Public sewer
- Home design: Single-story manufactured home; Residential property
- Construction: Mobile home / manufactured construction
- Exterior features: Covered patio; Shed(s); Paved road access
Interior
- Kitchen: Refrigerator; Microwave; Dishwasher; Electric range
- Flooring: Tile
- Bathrooms: Two full bathrooms
- Heating & cooling: Heating; Cooling
- Interior features: Double pane windows with blinds; Disposal; Water purifier; No fireplace
- Laundry & utility: Washer; Dryer
Neighborhood map
What this means for you Summary
Snapshot
- This is a 2-bed/2.0-bath manufactured listed at $180k.
Deal economics
- At list price, monthly cash flow is $282 ($3k/yr) — positive.
- The deal already cash-flows at list — no discount required.
- Meets the 1% rule at list price ($2k rent vs $180k).
- Cap rate 8.2% vs local median 3.9% in Yuma — top-decile yield for the area; either an underpriced asset or a hidden risk that comps aren't pricing in. Stress-test before assuming the spread holds.
Location & tenants
- Location reads 71/100 on livability (#30 in AZ) — a middle-class / working-renter tenant base. Strengths: cost of living A+, housing A+, health & safety A+; Watch: schools C-, crime C-, employment D.
- Yuma Union High School District (4507) (urban): math 14% / reading 16% proficiency, ranked #212 of 249 in AZ (top 85%) — low school quality limits family demand, transient renter base, plan for 1-2y turnover.
- Market conditions: Rents soft (-0.4%/yr); 472 active listings in the ZIP; 7 comparable units currently listed for rent nearby; rentals leasing fast (median 13d on market — plan ~1-2 weeks tenant-placement turnaround); 1,399 units permitted in Yuma County in 2024 (180 in 5+ unit buildings).
- This rent runs 31% of the median local income ($70k/yr) — at the standard rent-burdened threshold; future hikes will face affordability resistance.
Forward outlook
- Local home prices are declining (-3.0%/yr); year-one equity from $1k of loan paydown is wiped out by about $5k of value loss. Plan a longer hold.
- Yuma County population projected at +4% by 2050 — modest demand growth; plan on rents tracking national, not racing it.
Negotiation context
- Only 13 days on market — expect competitive offers; lowballing is unlikely to land.
- 5 sale attempts since 9y ago with the ask held roughly flat each time — persistent listings suggest the price (not the market) is what's stuck; bring a comps-based counter.
Risks & watch-outs
- Climate carrying-cost: extreme-heat days projected 7→18/yr by 2055 (HVAC capex compounding) — expect insurance premiums to compound above CPI over the hold.
Questions for the listing agent
- What does the HOA fee cover, when was the last increase, and are there any pending special assessments or reserve-fund shortfalls?
- Is there a deadline driving the sale (1031 exchange, divorce, estate, relocation)? That informs how much negotiation room exists.
- The area grade is low — what's the realistic commute time and amenity access for the typical tenant pool here? Any planned neighborhood developments (good or bad) we should know about?
- What's the average days-on-market for RENTAL listings here right now (not sales)? A rising rental-DOM trend means longer vacancies and softer asking-rent achievability than the comps imply.
- What's the recent tenant-quality profile in this submarket — average credit score on applications, eviction rate, late-payment / NSF rate, and stable-employment percentage? A property-management company in the area should have these aggregated.
- How much new for-sale + rental construction is in the pipeline within 1–3 miles? Heavy new supply typically softens prices + rents 12–24 months out; constrained supply supports both.
Investment metrics
- 1% rule
- 1.01% ✓
- Cap rate
- 8.17%
- Cash-on-cash
- 6.72%
- DSCR
- 1.30
- GRM
- 8.2
CMA / ARV
- ARV (on-the-fly)
- $148,208
- Comps found
- 12
Show comp detail 12 sales within ~0.75 mi
| Address | Dist | Beds/Ba | Sqft | Sold | Price | $/sf | Match |
|---|---|---|---|---|---|---|---|
| 3789 S Chapala Cir | 0.11mi | 2/2.0 | 1,261 (+0%) | 0mo | $179,900 | $143 | 94 |
| 3748 S Lakeside Dr | 0.05mi | 2/2.0 | 1,152 (-8%) | 4mo | $130,000 | $113 | 80 |
| 531 W Ocotillo Ln | 0.36mi | 2/2.0 | 1,248 (-1%) | 2mo | $194,000 | $155 | 80 |
| 549 W Ocotillo Ln | 0.36mi | 2/1.0 | 1,248 (-1%) | 5mo | $119,000 | $95 | 74 |
| 925 W Desert View Ln | 0.05mi | 2/2.0 | 1,392 (+11%) | 7mo | $176,500 | $127 | 74 |
| 3717 S Lakeside Cir | 0.12mi | 2/1.5 | 1,121 (-11%) | 12mo | $179,900 | $160 | 65 |
| 686 W Rainbow Ln | 0.36mi | 2/2.0 | 1,152 (-8%) | 11mo | $115,000 | $100 | 60 |
| 582 W Rainbow Ln | 0.40mi | 2/2.0 | 1,152 (-8%) | 11mo | $136,000 | $118 | 58 |
| 3460 S Redondo Rd | 0.71mi | 2/2.0 | 1,222 (-3%) | 8mo | $145,000 | $119 | 56 |
| 3452 S Redondo Rd | 0.72mi | 2/2.0 | 1,272 (+1%) | 10mo | $150,000 | $118 | 56 |
| 3592 S Jasper Ave | 0.57mi | 2/2.0 | 1,392 (+11%) | 9mo | $105,000 | $75 | 48 |
| 3570 S Canyon Ave | 0.71mi | 2/2.0 | 1,440 (+15%) | 6mo | $139,000 | $97 | 38 |
Match score weights: distance 35% · size 25% · config 20% · recency 20%. Top-matched comps best support the ARV.
Projected returns pro-forma
-3.0% appreciation · 0.0% rent growth · sell at horizon
- IRR
- -9.2%
- Equity multiple
- 0.67×
- Total profit
- $-16,555
- Equity at exit
- $26,824
- IRR
- -4.1%
- Equity multiple
- 0.76×
- Total profit
- $-12,044
- Equity at exit
- $15,554
Cash invested: $50,372 (down + closing). Projections, not guarantees.
Landlord ↔ Tenant lean methodology
- Overall (STATE)
- 87 Strongly Landlord-Friendly
- State Arizona
- 87 Strongly Landlord-Friendly · R+3
- County
- — inherits STATE
- City
- — inherits STATE
ZIP-level market 85365
- Home prices YoY
- -23.6%
- Rents YoY
- -0.4%
- Active inventory
- 472
- Price-to-rent
- 8.2×
Monthly cashflow live
- Estimated rent
- $1,825 high interval (Pro) →
- Mortgage (P&I)
- −$943
- Tax from tax record
- −$71 /mo · $856/yr
- Insurance
- −$75
- HOA
- −$70
- Vacancy / Maint / Mgmt
- −$383
- Net cashflow
- $282
Break-even live
UW: 25.0% down · 7.5% · 30yr · 1.5% tax · 5.0% vac · 8.0% maint · 8.0% mgmt
Financing live
Cash to close
- Down payment
- $44,975
- Closing costs
- $5,397
- Reserves months
- —
- Total cash needed
- —
Loan-product check · same deal, 3 products live
Conventional
25% down · 7.5% · 30yr
- Down + closing
- —
- Monthly P&I
- —
- Monthly cashflow
- —
- DSCR
- —
- Eligible?
- —
Personal DTI + credit; lowest rate.
DSCR
20% down · 8.5% · 30yr
- Down + closing
- —
- Monthly P&I
- —
- Monthly cashflow
- —
- DSCR
- —
- Eligible?
- —
No personal income docs; deal must DSCR.
Hard money
10% down · 12.0% · 12mo
- Down + closing
- —
- Monthly P&I
- —
- Monthly cashflow
- —
- DSCR
- —
- Eligible?
- —
Short-term bridge; refi at stabilization.
Rent comps 7 comps
| Address | Beds | Baths | Sqft | Rent | $/sqft | DOM | Units | Dist |
|---|---|---|---|---|---|---|---|---|
| 3533 S Cholla Dr Yuma, AZ | 2.0 | 2.0 | 1814 | $2,495 | $1.38 | 20d | 1 | 0.39mi |
| 1169 W 34th St Yuma, AZ | 3.0 | 1.5 | 1430 | $1,750 | $1.22 | 13d | 1 | 0.48mi |
| 3749 S 4th Ave Unit 224 Yuma, AZ | 2.0 | 2.0 | 960 | $1,400 | $1.46 | 20d | 1 | 0.53mi |
| 225 W Catalina Dr Yuma, AZ | 1.0–2.0 | 1.0–2.0 | 777 | $1,363 | $1.75 | 13d | 7 | 1.15mi |
| 1900 W 30th St Yuma, AZ | 2.0–3.0 | 2.0 | 1024 | $804 | $0.79 | 13d | 1 | 1.29mi |
| 1778 W 28th St Yuma, AZ | 3.0 | 2.0 | 1200 | $3,300 | $2.75 | 13d | 1 | 1.40mi |
| 143 W 27th Pl Yuma, AZ | 3.0 | 2.0 | 1277 | $1,500 | $1.17 | 20d | 1 | 1.48mi |
HOA detail
- Monthly dues
- $70 · $840/yr
Listing history 12 events
-
2026-06-19days on market $179,900 Active 13 DOM
-
2026-06-18days on market $179,900 Active 12 DOM
-
2026-06-17days on market $179,900 Active 11 DOM
-
2026-06-16days on market $179,900 Active 10 DOM
-
2026-06-15days on market $179,900 Active 9 DOM
-
2026-06-14days on market $179,900 Active 7 DOM
-
2026-06-13days on market $179,900 Active 6 DOM
-
2026-06-10days on market $179,900 Active 4 DOM
-
2026-06-09days on market $179,900 Active 3 DOM
-
2026-06-08days on market $179,900 Active 2 DOM
-
2026-06-07remarks 668-char remark
-
2026-06-07$179,900 Active 1 DOM
ⓘ Source: listings_history table (triggers on properties + properties_extension) + one-shot
backfill from property_details.listing_events for pre-trigger history.
Tax reassessment forecast AZ · Resets to sale price
- Current annual tax
- $856 · $71/mo
- Projected year-2 tax
- $1,187 · $99/mo
- Expected delta
- +$332/yr (+$28/mo · 38.7%)
ⓘ Screening estimate from a state-policy table — verify with the county assessor before closing.
Climate risk First Street
- Flood 1/10 Low FEMA zone X (shaded) · 0% chance over 30 yrs
- Wildfire 4/10 Moderate
- Heat 9/10 Extreme 7 d/yr ≥113°F today · 18 d/yr by 30 yrs out
- Wind 1/10 Low
- Air quality 2/10 Low 2 unhealthy d/yr today · 2 by 30 yrs out
Nearby sold comps map
Loading sold comps map…
Walkable amenities ~0.75 mi
Loading nearby amenities…
Taxation est. · year 1
- Rental income
- $21,901
- − Mortgage interest
- −$10,077
- − Property taxes
- −$856
- − Insurance
- −$900
- − Repairs & maintenance
- −$1,752
- − Management
- −$1,752
- − HOA
- −$840
- − Depreciation
- −$5,233
- Taxable income
- $491
- Est. tax owed @ 24.0%
- −$118
- After-tax cash flow
- $3,268/yr
For passive investors: Depreciation is non-cash, so a rental often shows a tax loss while cash-flowing — sheltering income. Rental losses are passive: they offset passive income freely, and up to $25,000/yr can offset ordinary (W-2) income if you actively participate and your MAGI is under $100k (phasing out to $0 by $150k); unused losses carry forward. On sale, claimed depreciation is recaptured at up to 25%, and gains may owe capital-gains tax (a 1031 exchange can defer both). Figures are a year-1 estimate at your 24.0% rate — not tax advice; consult a CPA.
Schools (NCES district)
- District
- Yuma Union High School District (4507)
- NCES district ID
- 0409630
- Math proficiency
- 14% ▼ -12.00%
- Reading proficiency
- 16% ▼ -10.00%
- Median HH income
- $40,512
- Composite
- 12.86/100
- National rank
- #9592
- State rank
- #212 of 249 in AZ
Livability — Yuma
- Score
- 71/100
- State rank
- #30
- US rank
- #6635
Category grades
Schools grade is shown separately in the Schools card above.
Census & demographics
- Census place
- Yuma, AZ
- County
- Yuma County · 149,809 people
- City population
- 149,809
- Metro
- Yuma, AZ
- Population (ZIP)
- 54,775
- Household income
- $70,331
- Rent vs Own
- Severe rent burden
- 766.0
Population outlook (Yuma County) Hauer SSP2
- Today (2025)
- 211,633 people
- By 2030
- 214,114 · +1.2%
- By 2040
- 217,856 · +2.9%
- By 2050
- 220,276 · +4.1%
- By 2075
- 222,359 · +5.1%
- By 2100
- 198,880 · -6.0%
Race, ethnicity, and origin ACS 2023
- Neighborhood character
- Diverse neighborhood (Simpson 0.58)
- Race & ethnicity
- Hispanic / Latino 47% White 44% Two or more races 23% Black 2% Asian 1% Native American 1%
- Hispanic origin (detail)
- Mexican 43%
- Common ancestry
- Lithuanian 2% Italian 1% Romanian 1%
- Foreign-born
- 17% · Canada
- Languages at home
- 62% English-only · Spanish 36% Tagalog/Filipino 1% Other Asian/Pacific 1%
Political lean MEDSL · Yuma
- 2024 margin
- Strong R (+20.4) · D 39.3% · R 59.8%
- 2008→2024 swing
- -6.6pp toward R · 2008: -13.8pp · 2024: -20.4pp
- All cycles
- 2024: R+20.4 2020: R+6.2 2016: R+5.5 2012: R+16.1 2008: R+13.8
Not yet ingested
- Civics
- —
Market trends
- HPI YoY
- ▼ -75.03%
- Current HPI
- 242.8651
- Rent YoY
- ▼ -0.38%
- Metro
- Yuma, AZ
- State GDP YoY
- ▲ 4.54%
- F500 in state
- 20
Industry mix (Fortune 500 HQ in AZ)
| Industry | F500 HQs | Revenue |
|---|---|---|
| Technology | 2 | $13B |
|
||
| Mining / Metals | 1 | $23B |
|
||
| Environmental Services | 1 | $16B |
|
||
| Metals / Steel | 1 | $14B |
|
||
| Technology Distribution | 1 | $9B |
|
||
| Homebuilding | 1 | $8B |
|
||
Price history
+63.5% since first listed15 events — show timeline
- 2026-06-06 Listed $179,900 YAR
- 2023-06-22 Sold (Public Records) $165,000 Public Records
- 2023-06-22 Sold (MLS) $165,000 YAR
- 2023-05-31 Contingent — YAR
- 2023-05-11 Relisted — YAR
- 2023-05-07 Contingent — YAR
- 2023-05-01 Price Changed $170,000 YAR
- 2023-04-14 Listed $175,000 YAR
- 2018-05-16 Sold (Public Records) $84,000 Public Records
- 2018-05-16 Sold (MLS) $84,000 YAR
- 2018-03-14 Listed $89,900 YAR
- 2018-01-24 Sold (MLS) $45,000 YAR
- 2017-07-12 Listed $49,900 YAR
- 2009-11-02 Sold (Public Records) $112,500 Public Records
- 2005-06-17 Sold (Public Records) $110,000 Public Records
Property tax history
+2.9%/yrLatest (2025): $856 · -9.7% YoY. Source: county tax records.
Cash-flow waterfall
monthlySold comps — $/sqft
last 12 mo · ≤1 miLoading sold comps…