20140 NE Sandy Blvd #96 · Gresham, OR
Flood risk 4/10 · Minor
- FEMA flood zone
- X (unshaded)
- Chance of flooding over 30 yrs
- 0.22%
- Est. flood insurance / yr
- $507 – $1,088
Fire risk 1/10 · Minimal
- Est. fire insurance / yr
- $498 – $926
Heat risk 3/10 · Minor
- Hot days now (above 93°F)
- 7 days/yr
- Hot days in 30 yrs
- 15 days/yr
Wind risk 1/10 · Minimal
- Chance of severe wind over 30 yrs
- —
Air-quality risk 10/10 · Severe
- Unhealthy air days now
- 23 days/yr
- Unhealthy air days in 30 yrs
- 27 days/yr
Risk factors via First Street. Map © Google.
Why this score? — see what drove the C+ grade
The composite is a weighted blend of 9 inputs, each scored 0–100. Each bar is that input's sub-score; the figure is the points it added to the 100-point composite (weight × sub-score).
- Cash flow +30.0/30.0
- DSCR +10.0/10.0
- 1% rule +9.8/10.0
- Livability +4.0/5.0
- Schools +2.7/10.0
- Condition / age +2.5/5.0
- Rent growth +2.3/5.0
- ARV discount +0.0/15.0
- Appreciation +0.0/10.0
$130,000
🖨 Deal sheet 📄 Offer letter ✓ Due diligence
Listing remarks MLS
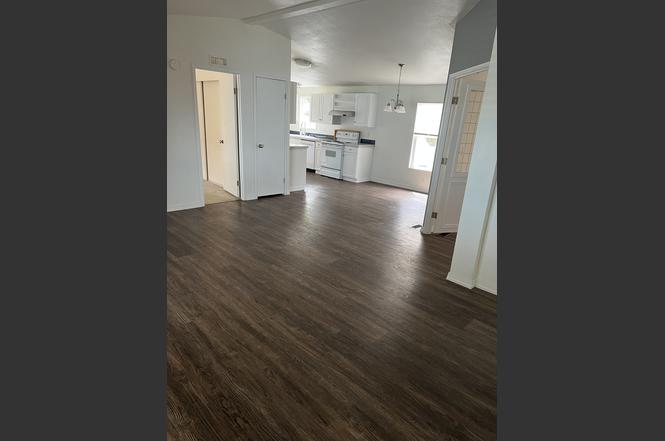
Don't miss this opportunity to own a home in the prime location of Fairview! 1999 Fleetwood manufactured home in all-ages park. Very near lots of conveniences--grocery stores, shopping, and right on the bus line if you don't have a car! New roof in 2016 with snow and ice membrane, Heat pump, luxury vinyl plank flooring in most areas, berber carpet in bedrooms, fresh paint throughout, 2 storage sheds, carport, and a deck on back of home with awning for year round bbq.
Key facts
- Heat pump
- Luxury vinyl plank
- Bonus room
Tags
Property features AI
Exterior
- Home design: Built in 1999
- Construction: Living area approximately 1400
- Exterior features: Located in the N Gresham/Fairview subdivision
Interior
- Kitchen: Dishwasher
- Interior features: Deck
Neighborhood map
What this means for you Summary
Snapshot
- This is a 3-bed/2.0-bath manufactured listed at $130k.
Deal economics
- At list price, monthly cash flow is $740 ($9k/yr) — positive.
- The deal already cash-flows at list — no discount required.
- Meets the 1% rule at list price ($2k rent vs $130k).
- Cap rate 13.1% vs local median 2.8% in Gresham — top-decile yield for the area; either an underpriced asset or a hidden risk that comps aren't pricing in. Stress-test before assuming the spread holds.
Location & tenants
- Location reads 81/100 on livability (#51 in OR, #1,537 nationally) — a professional / high-income tenant draw. Strengths: amenities A+, commute A+, health & safety A+; Watch: schools C-, cost of living D, crime D-.
- Reynolds SD 7 (suburban): math 21% / reading 36% proficiency, ranked #162 of 183 in OR (top 88%) — low school quality limits family demand, transient renter base, plan for 1-2y turnover; 66% free/reduced lunch — lower-income household profile, screen leases tightly.
- Market conditions: Rents soft (-1.0%/yr); 53 active listings in the ZIP; 24 comparable units currently listed for rent nearby; rentals at typical pace (median 20d on market — plan ~3-4 weeks tenant-placement turnaround); 2,041 units permitted in Multnomah County in 2024 (905 in 5+ unit buildings).
- This rent runs 33% of the median local income ($70k/yr) — at the standard rent-burdened threshold; future hikes will face affordability resistance.
Forward outlook
- Local home prices are declining (-3.0%/yr); year-one equity from $899 of loan paydown is wiped out by about $4k of value loss. Plan a longer hold.
- Multnomah County population projected at +33% by 2050 — long-run rental-demand tailwind backs the buy-and-hold thesis.
- At projected returns (-3.0% appreciation + 0.0% rent growth), your $36k cash investment doubles in ~6 years — after that, you're playing with house money.
Negotiation context
- Only 7 days on market — expect competitive offers; lowballing is unlikely to land.
- 2 sale attempts with the ask held roughly flat each time — persistent listings suggest the price (not the market) is what's stuck; bring a comps-based counter.
Questions for the listing agent
- Is there a deadline driving the sale (1031 exchange, divorce, estate, relocation)? That informs how much negotiation room exists.
- Crime grade is D in this area — have there been break-ins, vandalism, or insurance claims at this property in the last 3 years? What carrier currently insures it and at what premium?
- What's the average days-on-market for RENTAL listings here right now (not sales)? A rising rental-DOM trend means longer vacancies and softer asking-rent achievability than the comps imply.
- What's the recent tenant-quality profile in this submarket — average credit score on applications, eviction rate, late-payment / NSF rate, and stable-employment percentage? A property-management company in the area should have these aggregated.
- How much new for-sale + rental construction is in the pipeline within 1–3 miles? Heavy new supply typically softens prices + rents 12–24 months out; constrained supply supports both.
Investment metrics
- 1% rule
- 1.48% ✓
- Cap rate
- 13.12%
- Cash-on-cash
- 24.38%
- DSCR
- 2.08
- GRM
- 5.6
CMA / ARV
- ARV (on-the-fly)
- $100,800
- Comps found
- 12
Show comp detail 12 sales within ~0.75 mi
| Address | Dist | Beds/Ba | Sqft | Sold | Price | $/sf | Match |
|---|---|---|---|---|---|---|---|
| 2500 NE 201st Ave #26 | 0.17mi | 3/2.0 | 1,404 (+0%) | 2mo | $67,000 | $48 | 90 |
| 2632 NE 201st Ave #30 | 0.13mi | 3/2.0 | 1,404 (+0%) | 12mo | $120,000 | $85 | 83 |
| 2600 NE 205th Ave #20 | 0.12mi | 3/2.0 | 1,456 (+4%) | 8mo | $164,518 | $113 | 81 |
| 20140 NE Sandy Blvd #24 | 0.00mi | 4/2.0 (+1) | 1,552 (+11%) | 11mo | $164,000 | $106 | 68 |
| 3150 NE 206th Pl | 0.26mi | 3/2.0 | 1,533 (+10%) | 9mo | $355,000 | $232 | 65 |
| 21100 NE Sandy Blvd #79 | 0.49mi | 3/2.0 | 1,432 (+2%) | 10mo | $83,000 | $58 | 65 |
| 20140 NE Sandy Blvd | 0.14mi | 4/2.0 (+1) | 1,552 (+11%) | 11mo | $164,000 | $106 | 61 |
| 21100 NE Sandy Blvd #127 | 0.41mi | 2/2.0 (-1) | 1,344 (-4%) | 13mo | $84,500 | $63 | 58 |
| 21100 NE Sandy Blvd #59 | 0.46mi | 3/2.0 | 1,584 (+13%) | 5mo | $89,900 | $57 | 52 |
| 21100 NE Sandy Blvd #39 | 0.46mi | 2/2.0 (-1) | 1,224 (-13%) | 2mo | $75,000 | $61 | 51 |
| 21100 NE Sandy Blvd #2 | 0.37mi | 2/2.0 (-1) | 1,236 (-12%) | 10mo | $49,000 | $40 | 50 |
| 21100 NE Sandy Blvd | 0.45mi | 2/2.0 (-1) | 1,248 (-11%) | 11mo | $90,000 | $72 | 47 |
Match score weights: distance 35% · size 25% · config 20% · recency 20%. Top-matched comps best support the ARV.
Projected returns pro-forma
-3.0% appreciation · 0.0% rent growth · sell at horizon
- IRR
- 14.5%
- Equity multiple
- 1.56×
- Total profit
- $20,348
- Equity at exit
- $19,383
- IRR
- 21.0%
- Equity multiple
- 2.55×
- Total profit
- $56,361
- Equity at exit
- $11,240
Cash invested: $36,400 (down + closing). Projections, not guarantees.
Landlord ↔ Tenant lean methodology
- Overall (STATE)
- 28 Tenant-Leaning
- State Oregon
- 28 Tenant-Leaning · D+6
- County
- — inherits STATE
- City
- — inherits STATE
ZIP-level market 97024
- Home prices YoY
- -20.3%
- Rents YoY
- -1.0%
- Active inventory
- 53
- Price-to-rent
- 5.6×
Monthly cashflow live
- Estimated rent
- $1,929 high interval (Pro) →
- Mortgage (P&I)
- −$682
- Tax from tax record
- −$49 /mo · $584/yr
- Insurance
- −$54
- HOA
- −$0
- Vacancy / Maint / Mgmt
- −$405
- Net cashflow
- $740
Break-even live
UW: 25.0% down · 7.5% · 30yr · 1.5% tax · 5.0% vac · 8.0% maint · 8.0% mgmt
Financing live
Cash to close
- Down payment
- $32,500
- Closing costs
- $3,900
- Reserves months
- —
- Total cash needed
- —
Loan-product check · same deal, 3 products live
Conventional
25% down · 7.5% · 30yr
- Down + closing
- —
- Monthly P&I
- —
- Monthly cashflow
- —
- DSCR
- —
- Eligible?
- —
Personal DTI + credit; lowest rate.
DSCR
20% down · 8.5% · 30yr
- Down + closing
- —
- Monthly P&I
- —
- Monthly cashflow
- —
- DSCR
- —
- Eligible?
- —
No personal income docs; deal must DSCR.
Hard money
10% down · 12.0% · 12mo
- Down + closing
- —
- Monthly P&I
- —
- Monthly cashflow
- —
- DSCR
- —
- Eligible?
- —
Short-term bridge; refi at stabilization.
Rent comps 24 comps
| Address | Beds | Baths | Sqft | Rent | $/sqft | DOM | Units | Dist |
|---|---|---|---|---|---|---|---|---|
| 2667 NE 205th Ave Fairview, OR | 3.0 | 2.0 | 1115 | $1,950 | $1.75 | 23d | 1 | 0.05mi |
| 20454 NE Sandy Blvd Fairview, OR | 2.0 | 2.0 | 950 | $1,450 | $1.53 | 3d | 4 | 0.05mi |
| 20454 NE Sandy Blvd Apt B26 Fairview, OR | 2.0 | 2.0 | 950 | $1,722 | $1.81 | 20d | 7 | 0.09mi |
| 3794 NE Fairview Lake Way Fairview, OR | 3.0 | 2.0 | 1611 | $2,795 | $1.73 | 21d | 1 | 0.40mi |
| 21123 NE Osburn Loop Unit 21123 Fairview, OR | 3.0 | 2.5 | 1586 | $2,595 | $1.64 | 4d | 1 | 0.50mi |
| 20347 NE Halsey St Fairview, OR | 2.0 | 2.0 | 985 | $1,614 | $1.64 | 3d | 2 | 0.58mi |
| 19927 NE Halsey St Unit 103 Portland, OR | 3.0 | 2.5 | 1225 | $1,895 | $1.55 | 43d | 1 | 0.67mi |
| 19849 NE Halsey St Unit 110 Portland, OR | 3.0 | 2.0 | 895 | $1,870 | $2.09 | 17d | 1 | 0.68mi |
| 19511 NE Halsey St Portland, OR | 2.0 | 1.0 | 917 | $1,395 | $1.52 | 3d | 1 | 0.75mi |
| 22199 NE Sandy Blvd Fairview, OR | 2.0 | 1.0–2.0 | 707 | $2,200 | $3.11 | 3d | 27 | 0.83mi |
| 609 Lincoln St Unit 609 Fairview, OR | 3.0 | 2.5 | 1100 | $2,250 | $2.05 | 43d | 1 | 0.87mi |
| 320 Lincoln St Fairview, OR | 2.0 | 1.0 | 950 | $1,395 | $1.47 | 43d | 1 | 0.99mi |
| 22100 NE Halsey St Fairview, OR | 1.0–3.0 | 1.0–2.0 | 1003 | $2,395 | $2.39 | 3d | 10 | 1.02mi |
| 1497 NE Market Dr Fairview, OR | 2.0 | 2.0 | 1136 | $1,750 | $1.54 | 43d | 1 | 1.02mi |
| 21933 NE Chinook Way Fairview, OR | 1.0–3.0 | 1.0–2.5 | 874 | $2,315 | $2.65 | 1d | 8 | 1.03mi |
| 22025 NE Halsey St Fairview, OR | 1.0–2.0 | 1.0–2.0 | 841 | $1,795 | $2.13 | 10d | 1 | 1.05mi |
| 22032 NE Chinook Way Unit B Fairview, OR | 2.0 | 2.5 | 1150 | $2,045 | $1.78 | 7d | 1 | 1.13mi |
| 22032 NE Chinook Way Apt A Fairview, OR | 2.0 | 2.5 | 1150 | $1,995 | $1.73 | 43d | 1 | 1.13mi |
| 22620 NE Hancock St Fairview, OR | 2.0 | 2.0 | 1196 | $1,995 | $1.67 | 21d | 1 | 1.19mi |
| 22701 NE Halsey St Unit FO222 Fairview, OR | 2.0 | 2.0 | 965 | $1,511 | $1.57 | 43d | 1 | 1.29mi |
| 22701 NE Halsey St Unit FO1101 Fairview, OR | 2.0 | 2.0 | 965 | $1,511 | $1.57 | 23d | 1 | 1.29mi |
| 1210 NE 181st Ave Portland, OR | 2.0 | 1.5 | 945 | $1,250 | $1.32 | 43d | 1 | 1.37mi |
| 1136 NE 181st Ave Portland, OR | 1.0–2.0 | 1.0 | 762 | $1,475 | $1.93 | 7d | 2 | 1.39mi |
| 17838 NE Multnomah Dr Unit 16 Portland, OR | 2.0 | 1.0 | 950 | $1,200 | $1.26 | 4d | 1 | 1.43mi |
Listing history 7 events
-
2026-06-18days on market $130,000 Active 7 DOM
-
2026-06-17days on market $130,000 Active 6 DOM
-
2026-06-16days on market $130,000 Active 5 DOM
-
2026-06-15days on market $130,000 Active 4 DOM
-
2026-06-13days on market $130,000 Active 2 DOM
-
2026-06-13remarks 487-char remark
-
2026-06-13$130,000 Active 1 DOM
ⓘ Source: listings_history table (triggers on properties + properties_extension) + one-shot
backfill from property_details.listing_events for pre-trigger history.
Tax reassessment forecast OR · Resets to sale price
- Current annual tax
- $584 · $49/mo
- Projected year-2 tax
- $1,261 · $105/mo
- Expected delta
- +$677/yr (+$56/mo · 115.9%)
ⓘ Screening estimate from a state-policy table — verify with the county assessor before closing.
Climate risk First Street
- Flood 4/10 Moderate FEMA zone X (unshaded) · 22% chance over 30 yrs
- Wildfire 1/10 Low
- Heat 3/10 Moderate 7 d/yr ≥93°F today · 15 d/yr by 30 yrs out
- Wind 1/10 Low
- Air quality 10/10 Extreme 23 unhealthy d/yr today · 27 by 30 yrs out
Nearby sold comps map
Loading sold comps map…
Walkable amenities ~0.75 mi
Loading nearby amenities…
Taxation est. · year 1
- Rental income
- $23,153
- − Mortgage interest
- −$7,282
- − Property taxes
- −$584
- − Insurance
- −$650
- − Repairs & maintenance
- −$1,852
- − Management
- −$1,852
- − Depreciation
- −$3,782
- Taxable income
- $7,150
- Est. tax owed @ 24.0%
- −$1,716
- After-tax cash flow
- $7,160/yr
For passive investors: Depreciation is non-cash, so a rental often shows a tax loss while cash-flowing — sheltering income. Rental losses are passive: they offset passive income freely, and up to $25,000/yr can offset ordinary (W-2) income if you actively participate and your MAGI is under $100k (phasing out to $0 by $150k); unused losses carry forward. On sale, claimed depreciation is recaptured at up to 25%, and gains may owe capital-gains tax (a 1031 exchange can defer both). Figures are a year-1 estimate at your 24.0% rate — not tax advice; consult a CPA.
Schools (NCES district)
- District
- Reynolds SD 7
- NCES district ID
- 4110520
- Math proficiency
- 21% ▬ 0.00%
- Reading proficiency
- 36% ▬ 0.00%
- Median HH income
- $45,502
- Composite
- 27.4/100
- National rank
- #12399
- State rank
- #162 of 183 in OR
Livability — Gresham
- Score
- 81/100
- State rank
- #51
- US rank
- #1537
Category grades
Schools grade is shown separately in the Schools card above.
Census & demographics
- Census place
- Gresham, OR
- County
- Multnomah County · 786,692 people
- City population
- 86,119
- Metro
- Portland-Vancouver-Hillsboro, OR-WA
- Population (ZIP)
- 12,007
- Household income
- $69,679
- Rent vs Own
- Severe rent burden
- 552.0
Population outlook (Multnomah County) Hauer SSP2
- Today (2025)
- 930,825 people
- By 2030
- 996,904 · +7.1%
- By 2040
- 1,121,379 · +20.5%
- By 2050
- 1,242,124 · +33.4%
- By 2075
- 1,464,431 · +57.3%
- By 2100
- 1,576,181 · +69.3%
Race, ethnicity, and origin ACS 2023
- Neighborhood character
- Diverse neighborhood (Simpson 0.68)
- Race & ethnicity
- White 48% Hispanic / Latino 27% Two or more races 15% Black 12% Pacific Islander 3% Native American 2% Asian 1%
- Hispanic origin (detail)
- Mexican 24%
- Common ancestry
- Portuguese 3% Italian 3% Lithuanian 3%
- Foreign-born
- 16% · Canada, Guatemala, Vietnam
- Languages at home
- 69% English-only · Spanish 23% Other Asian/Pacific 3% Russian/Polish/Slavic 1%
Political lean MEDSL · Multnomah
- 2024 margin
- Solid D (+62.1) · D 79.3% · R 17.2% · Other 3.5%
- 2008→2024 swing
- +6.0pp toward D · 2008: 56.1pp · 2024: 62.1pp
- All cycles
- 2024: D+62.1 2020: D+61.3 2016: D+58.3 2012: D+54.9 2008: D+56.1
Not yet ingested
- Civics
- —
Market trends
- HPI YoY
- ▼ -72.88%
- Current HPI
- 286.4915
- Rent YoY
- ▼ -0.99%
- Metro
- Portland-Vancouver-Hillsboro, OR-WA
- State GDP YoY
- ▲ 2.05%
- F500 in state
- 2
Industry mix (Fortune 500 HQ in OR)
| Industry | F500 HQs | Revenue |
|---|---|---|
| Consumer Goods | 1 | $51B |
|
||
Price history
+0.0% since first listed2 events — show timeline
- 2026-06-11 Listed $130,000 FSBO.com
- 2026-06-11 Listed $130,000 FSBO.com
Property tax history
-0.9%/yrLatest (2025): $584 · +11.0% YoY. Source: county tax records.
Cash-flow waterfall
monthlySold comps — $/sqft
last 12 mo · ≤1 miLoading sold comps…