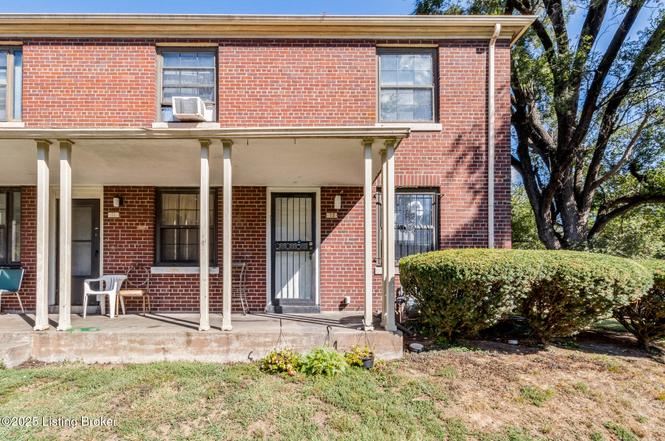
12 College Ct · Louisville, KY
Flood risk 5/10 · Moderate
- FEMA flood zone
- X (unshaded)
- Chance of flooding over 30 yrs
- 0.51%
- Est. flood insurance / yr
- $507 – $1,088
Fire risk 1/10 · Minimal
- Est. fire insurance / yr
- $839 – $1,559
Heat risk 5/10 · Moderate
- Hot days now (above 104°F)
- 7 days/yr
- Hot days in 30 yrs
- 20 days/yr
Wind risk 2/10 · Minimal
- Chance of severe wind over 30 yrs
- 1.0%
Air-quality risk 2/10 · Minimal
- Unhealthy air days now
- 1 days/yr
- Unhealthy air days in 30 yrs
- 3 days/yr
Risk factors via First Street. Map © Google.
Why this score? — see what drove the B- grade
The composite is a weighted blend of 9 inputs, each scored 0–100. Each bar is that input's sub-score; the figure is the points it added to the 100-point composite (weight × sub-score).
- Cash flow +30.0/30.0
- DSCR +10.0/10.0
- 1% rule +8.8/10.0
- ARV discount +7.5/15.0
- Rent growth +3.4/5.0
- Livability +3.2/5.0
- Condition / age +2.5/5.0
- Schools +2.3/10.0
- Appreciation +0.0/10.0
$80,000
🖨 Deal sheet 📄 Offer letter ✓ Due diligence
Listing remarks
Investor special in Louisville, KY! This 2 bedroom, 1 bathroom condo is now vacant and ready for your next move—whether that's placing your own tenant, house hacking, or moving in yourself. Previously rented at $1,200/month, this property offers strong cash flow potential and easily meets the 1% rule at just $85,000, making it an ideal entry point for new investors or a high-yield addition to an existing portfolio. The condo features a functional layout with two spacious bedrooms, a bright living area, and convenient access to major employers—supporting consistent rental demand in a strong Louisville market. With the tenant just moved out, you have the flexibility to: set new ma
Key facts
- $21 HOA
- Built 1988
- Listed 234 days
Property features AI
Finance
- HOA & community: Association present with monthly maintenance fee (about 246)
Exterior
- Utilities: Electricity connected; Natural gas service
- Home design: Residential property; Two stories; Built in 1988; Shingle roof; Crawl space foundation
- Construction: Built in 1988; Shingle roof; Crawl space foundation
- Exterior features: No fencing; Lot described in acres
Interior
- Kitchen: Kitchen located on the first floor
- Bedrooms: Two bedrooms located on the second floor
- Bathrooms: One full bathroom on the second floor; One half bathroom on the first floor
- Heating & cooling: Natural gas heating; Central air conditioning
- Interior features: Four total rooms; Five closets; No basement; Living room on the first floor
- Laundry & utility: First-floor laundry
Neighborhood map
What this means for you Summary
Snapshot
- This is a 2-bed/1.5-bath condo listed at $80k.
Deal economics
- At list price, monthly cash flow is $351 ($4k/yr) — positive.
- The deal already cash-flows at list — no discount required.
- Meets the 1% rule at list price ($1k rent vs $80k).
- Recommended offer: $70k (12.0% below list) — sets the bar for market timing.
- Cap rate 11.6% vs local median 5.0% in Louisville — top-decile yield for the area; either an underpriced asset or a hidden risk that comps aren't pricing in. Stress-test before assuming the spread holds.
Location & tenants
- Location reads 63/100 on livability (#333 in KY) — a middle-class / working-renter tenant base. Strengths: cost of living A+, housing A+; Watch: employment C-, health & safety D+, schools D-.
- Jefferson County (urban): math 19% / reading 35% proficiency, ranked #121 of 165 in KY (top 73%) — low school quality limits family demand, transient renter base, plan for 1-2y turnover.
- Market conditions: Rents rising (+3.7%/yr); 114 active listings in the ZIP; 40 comparable units currently listed for rent nearby; rentals at typical pace (median 24d on market — plan ~3-4 weeks tenant-placement turnaround); lower-income renter base — watch delinquency; 2,836 units permitted in Jefferson County in 2024 (1,558 in 5+ unit buildings).
- This rent runs 43% of the median local income ($31k/yr) — at the standard rent-burdened threshold; future hikes will face affordability resistance.
Forward outlook
- Local home prices are declining (-3.0%/yr); year-one equity from $553 of loan paydown is wiped out by about $2k of value loss. Plan a longer hold.
- Jefferson County population projected at +13% by 2050 — modest demand growth; plan on rents tracking national, not racing it.
- At projected returns (-3.0% appreciation + 3.7% rent growth), your $22k cash investment doubles in ~7 years — after that, you're playing with house money.
Negotiation context
- It's been on market 234 days — a 12% lower offer ($70k) is reasonable based on typical stale-listing flexibility.
- 8 sale attempts since 7y ago; this cycle's ask is 6078% above the opening price — seller raised mid-cycle; expect resistance to lowballs.
- Current owner paid $68k; 19% above their basis — modest negotiation headroom, anchor on the comps not their cost.
Risks & watch-outs
- Climate carrying-cost: moderate flood risk; extreme-heat days projected 7→20/yr by 2055 (HVAC capex compounding) — expect insurance premiums to compound above CPI over the hold.
Questions for the listing agent
- It's been on market 234 days. Have you received any prior offers? Is the seller open to a 12% concession, seller financing, or rate buy-down credit?
- What does the HOA fee cover, when was the last increase, and are there any pending special assessments or reserve-fund shortfalls?
- Any open or pending special assessments — roof, HVAC, plumbing, elevator, façade? What's the per-unit balance and payoff schedule, and is the seller paying it off at close or rolling it to the buyer?
- Why hasn't it sold? Are there any deal-killer items the seller is aware of (foundation, flood, title, zoning, code violations)?
- Is there a deadline driving the sale (1031 exchange, divorce, estate, relocation)? That informs how much negotiation room exists.
- Schools are D-rated, which usually means shorter tenancies and higher turnover. Who's the typical renter profile here, and what's been the actual vacancy rate?
- Crime grade is F in this area — have there been break-ins, vandalism, or insurance claims at this property in the last 3 years? What carrier currently insures it and at what premium?
- What's the average days-on-market for RENTAL listings here right now (not sales)? A rising rental-DOM trend means longer vacancies and softer asking-rent achievability than the comps imply.
- What's the recent tenant-quality profile in this submarket — average credit score on applications, eviction rate, late-payment / NSF rate, and stable-employment percentage? A property-management company in the area should have these aggregated.
- How much new apartment / multifamily construction is in the pipeline within 1–3 miles? Heavy new supply (>2% of stock underway) typically softens rents 12–24 months out; light construction supports rent growth.
Investment metrics
- 1% rule
- 1.38% ✓
- Cap rate
- 11.57%
- Cash-on-cash
- 18.83%
- DSCR
- 1.84
- GRM
- 6.0
CMA / ARV
No comps found within radius.
Projected returns pro-forma
-3.0% appreciation · 3.73% rent growth · sell at horizon
- IRR
- 11.4%
- Equity multiple
- 1.46×
- Total profit
- $10,240
- Equity at exit
- $11,928
- IRR
- 21.0%
- Equity multiple
- 2.84×
- Total profit
- $41,142
- Equity at exit
- $6,917
Cash invested: $22,400 (down + closing). Projections, not guarantees.
Landlord ↔ Tenant lean methodology
- Overall (STATE)
- 83 Strongly Landlord-Friendly
- State Kentucky
- 83 Strongly Landlord-Friendly · R+16
- County
- — inherits STATE
- City
- — inherits STATE
ZIP-level market 40203
- Home prices YoY
- -13.8%
- Rents YoY
- 3.7%
- Active inventory
- 114
- Price-to-rent
- 6.0×
Monthly cashflow live
- Estimated rent
- $1,106 high interval (Pro) →
- Mortgage (P&I)
- −$420
- Tax from tax record
- −$48 /mo · $580/yr
- Insurance
- −$33
- HOA
- −$21
- Vacancy / Maint / Mgmt
- −$232
- Net cashflow
- $351
Break-even live
UW: 25.0% down · 7.5% · 30yr · 1.5% tax · 5.0% vac · 8.0% maint · 8.0% mgmt
Financing live
Cash to close
- Down payment
- $20,000
- Closing costs
- $2,400
- Reserves months
- —
- Total cash needed
- —
Loan-product check · same deal, 3 products live
Conventional
25% down · 7.5% · 30yr
- Down + closing
- —
- Monthly P&I
- —
- Monthly cashflow
- —
- DSCR
- —
- Eligible?
- —
Personal DTI + credit; lowest rate.
DSCR
20% down · 8.5% · 30yr
- Down + closing
- —
- Monthly P&I
- —
- Monthly cashflow
- —
- DSCR
- —
- Eligible?
- —
No personal income docs; deal must DSCR.
Hard money
10% down · 12.0% · 12mo
- Down + closing
- —
- Monthly P&I
- —
- Monthly cashflow
- —
- DSCR
- —
- Eligible?
- —
Short-term bridge; refi at stabilization.
Rent comps 40 comps
| Address | Beds | Baths | Sqft | Rent | $/sqft | DOM | Units | Dist |
|---|---|---|---|---|---|---|---|---|
| 21 College Ct Louisville, KY | 1.0 | 1.0 | 900 | $880 | $0.98 | 10d | 1 | 0.04mi |
| 607 Saint Catherine St Unit 2 Louisville, KY | 1.0 | 1.0 | 1100 | $1,025 | $0.93 | 23d | 1 | 0.23mi |
| 510 Saint Catherine St Apt B Louisville, KY | 1.0 | 1.0 | 552 | $895 | $1.62 | 3d | 1 | 0.33mi |
| 1146 S 6th St Unit 2B Louisville, KY | 1.0 | 1.0 | 700 | $1,300 | $1.86 | 23d | 1 | 0.36mi |
| 747 S 5th St Unit 12 Louisville, KY | 1.0 | 2.0 | 1005 | $1,300 | $1.29 | 23d | 1 | 0.36mi |
| 1121 Garvin Pl Unit 1121 Garvin Place-1 Louisville, KY | 1.0 | 1.0 | 660 | $900 | $1.36 | 14d | 1 | 0.37mi |
| 800 S 4th St Louisville, KY | 2.0 | 1.0–2.0 | 837 | $1,467 | $1.75 | 1d | 18 | 0.38mi |
| 1200 S 6th St Apt 4 Louisville, KY | 3.0 | 1.0 | 900 | $1,125 | $1.25 | 23d | 1 | 0.40mi |
| 508 W Oak St Unit 2 Louisville, KY | 2.0 | 1.0 | 1000 | $1,195 | $1.20 | 23d | 1 | 0.43mi |
| 1009 S 3rd St #302 Louisville, KY | 1.0 | 1.0 | 700 | $750 | $1.07 | 23d | 1 | 0.44mi |
| 205 W Breckinridge St Apt 8 Louisville, KY | 2.0 | 1.0 | 650 | $1,600 | $2.46 | 1d | 1 | 0.49mi |
| 205 W Breckinridge St Apt 1 Louisville, KY | 1.0 | 1.0 | 600 | $950 | $1.58 | 1d | 1 | 0.49mi |
| 848 S 2nd St Apt 2 Louisville, KY | 1.0 | 1.0 | 600 | $950 | $1.58 | 1d | 1 | 0.50mi |
| 848 S 2nd St Apt 3 Louisville, KY | 2.0 | 1.0 | 1100 | $1,500 | $1.36 | 1d | 1 | 0.50mi |
| 1231 S 4th St Unit 1 Louisville, KY | 1.0 | 1.0 | 650 | $925 | $1.42 | 21d | 1 | 0.56mi |
| 1231 S 4th St Unit 1 Louisville, KY | 1.0 | 1.0 | 650 | $925 | $1.42 | 23d | 1 | 0.56mi |
| 1310 S 6th St Unit 1310 S 6th-3 Louisville, KY | 1.0 | 1.0 | 679 | $825 | $1.22 | 3d | 1 | 0.58mi |
| 1312 S 6th St Unit 609 FT-1B Louisville, KY | 1.0 | 1.0 | 525 | $825 | $1.57 | 23d | 1 | 0.58mi |
| 1245 S 4th St Louisville, KY | 1.0–2.0 | 1.0 | 900 | $1,100 | $1.22 | 3d | 5 | 0.58mi |
| 512 W Ormsby Ave Louisville, KY | 2.0 | 1.0 | 573 | $1,795 | $3.13 | 1d | 1 | 0.59mi |
| 1001 S 1st St Unit 3 Louisville, KY | 1.0 | 1.0 | 550 | $725 | $1.32 | 23d | 1 | 0.61mi |
| 233 W Broadway Unit 705 Louisville, KY | 2.0 | 2.0 | 865 | $1,260 | $1.46 | 1d | 1 | 0.61mi |
| 108 E Kentucky St Unit 1 Louisville, KY | 2.0 | 1.0 | 900 | $1,195 | $1.33 | 23d | 1 | 0.62mi |
| 657 S 3rd St Louisville, KY | 1.0–2.0 | 1.0–2.0 | 933 | $1,275 | $1.37 | 1d | 42 | 0.63mi |
| 1105 S 1st St Unit 4 Louisville, KY | 2.0 | 2.0 | 1076 | $1,400 | $1.30 | 1d | 1 | 0.64mi |
| 1105 S 1st St Unit 4 Louisville, KY | 2.0 | 2.0 | 1076 | $1,400 | $1.30 | 14d | 1 | 0.64mi |
| 427 Park Ave Unit 6 Louisville, KY | 1.0 | 1.0 | 700 | $1,195 | $1.71 | 23d | 1 | 0.65mi |
| 1135 S 1st St #7 Louisville, KY | 2.0 | 1.0 | 837 | $1,500 | $1.79 | 23d | 1 | 0.67mi |
| 1233 S 2nd St Apt 1 Louisville, KY | 1.0 | 1.0 | 950 | $875 | $0.92 | 2d | 1 | 0.68mi |
| 604 S 3rd St #810 Louisville, KY | 2.0 | 2.0 | 1036 | $3,200 | $3.09 | 23d | 1 | 0.69mi |
| 208 W Ormsby Ave Unit 4 Louisville, KY | 1.0 | 1.0 | 700 | $850 | $1.21 | 23d | 1 | 0.71mi |
| 555 S 4th St Louisville, KY | 3.0 | 1.0–2.0 | 1037 | $2,297 | $2.21 | 1d | 22 | 0.72mi |
| 122 E Oak St #2 Louisville, KY | 2.0 | 1.0 | 864 | $1,250 | $1.45 | 23d | 1 | 0.75mi |
| 124 E Oak St #4 Louisville, KY | 2.0 | 1.0 | 904 | $1,550 | $1.71 | 23d | 1 | 0.76mi |
| 1319 S 2nd St Unit 3 Louisville, KY | 1.0 | 1.0 | 600 | $895 | $1.49 | 23d | 1 | 0.77mi |
| 1245 S 1st St Unit 4 Louisville, KY | 1.0 | 1.0 | 650 | $925 | $1.42 | 3d | 1 | 0.77mi |
| 1228 S Brook St Unit 2 Louisville, KY | 1.0 | 1.0 | 700 | $825 | $1.18 | 23d | 1 | 0.80mi |
| 224 E Oak St Unit 5 Louisville, KY | 1.0 | 1.0 | 650 | $900 | $1.38 | 23d | 1 | 0.83mi |
| 980 W Liberty St Louisville, KY | 1.0–3.0 | 1.0–1.5 | 1026 | $1,198 | $1.17 | 23d | 133 | 0.86mi |
| 318 E Saint Catherine St Louisville, KY | 1.0–2.0 | 1.0 | 750 | $1,150 | $1.53 | 23d | 2 | 0.88mi |
HOA detail condo
- Monthly dues
- $21 · $252/yr
- Assessments
- None detected in remarks — confirm with the listing agent.
Listing history 38 events
-
2026-06-18days on market $80,000 Active 234 DOM
-
2026-06-17days on market $80,000 Active 233 DOM
-
2026-06-16days on market $80,000 Active 232 DOM
-
2026-06-15days on market $80,000 Active 231 DOM
-
2026-06-13days on market $80,000 Active 229 DOM
-
2026-06-10days on market $80,000 Active 226 DOM
-
2026-06-09days on market $80,000 Active 225 DOM
-
2026-06-08days on market $80,000 Active 224 DOM
-
2026-06-07days on market $80,000 Active 223 DOM
-
2026-06-03days on market $80,000 Active 219 DOM
-
2026-06-02days on market $80,000 Active 218 DOM
-
2026-06-01days on market $80,000 Active 217 DOM
-
2026-05-31pricedays on market $80,000 Active 216 DOM
-
2026-03-31status Active
-
2026-03-31price $85,000
-
2026-03-16historical $1,295
-
2026-03-10$1,295
-
2026-03-06historical
-
2025-12-05price $75,000
-
2025-10-27price $80,000
-
2025-10-02$85,000 Active
-
2025-07-10soldstatus $67,500
-
2024-01-06status Active
-
2023-11-13status Pending
-
2023-11-12status Pending
-
2023-11-12historical
-
2023-10-09historical
-
2023-10-09$80,000 Active
-
2023-09-25$90,000 Active
-
2021-11-24status Pending
-
2021-11-03soldstatus $46,000
-
2021-11-02soldstatus $46,000 Closed
-
2021-10-11historical Active Under Contract
-
2021-10-04$55,000 Active
-
2019-11-05soldstatus $32,250
-
2019-10-30soldstatus $32,250 Closed
-
2019-09-26status Pending
-
2019-09-16$40,000 Active
ⓘ Source: listings_history table (triggers on properties + properties_extension) + one-shot
backfill from property_details.listing_events for pre-trigger history.
Tax reassessment forecast KY · Resets to sale price
- Current annual tax
- $580 · $48/mo
- Projected year-2 tax
- $688 · $57/mo
- Expected delta
- +$108/yr (+$9/mo · 18.7%)
ⓘ Screening estimate from a state-policy table — verify with the county assessor before closing.
Climate risk First Street
- Flood 5/10 Major FEMA zone X (unshaded) · 51% chance over 30 yrs
- Wildfire 1/10 Low
- Heat 5/10 Major 7 d/yr ≥104°F today · 20 d/yr by 30 yrs out
- Wind 2/10 Low 100% chance of damaging wind over 30 yrs
- Air quality 2/10 Low 1 unhealthy d/yr today · 3 by 30 yrs out
Nearby sold comps map
Loading sold comps map…
Walkable amenities ~0.75 mi
Loading nearby amenities…
Taxation est. · year 1
- Rental income
- $13,271
- − Mortgage interest
- −$4,481
- − Property taxes
- −$580
- − Insurance
- −$400
- − Repairs & maintenance
- −$1,062
- − Management
- −$1,062
- − HOA
- −$252
- − Depreciation
- −$2,327
- Taxable income
- $3,107
- Est. tax owed @ 24.0%
- −$746
- After-tax cash flow
- $3,472/yr
For passive investors: Depreciation is non-cash, so a rental often shows a tax loss while cash-flowing — sheltering income. Rental losses are passive: they offset passive income freely, and up to $25,000/yr can offset ordinary (W-2) income if you actively participate and your MAGI is under $100k (phasing out to $0 by $150k); unused losses carry forward. On sale, claimed depreciation is recaptured at up to 25%, and gains may owe capital-gains tax (a 1031 exchange can defer both). Figures are a year-1 estimate at your 24.0% rate — not tax advice; consult a CPA.
Schools (NCES district)
- District
- Jefferson County
- NCES district ID
- 2102990
- Math proficiency
- 19% ▼ -17.00%
- Reading proficiency
- 35% ▼ -11.00%
- Median HH income
- $47,885
- Composite
- 23.45/100
- National rank
- #7884
- State rank
- #121 of 165 in KY
Livability — Louisville
- Score
- 63/100
- State rank
- #333
- US rank
- #15887
Category grades
Schools grade is shown separately in the Schools card above.
Census & demographics
- Census place
- Louisville, KY
- County
- Jefferson County · 790,184 people
- City population
- 769,292
- Metro
- Louisville/Jefferson County, KY-IN
- Population (ZIP)
- 17,742
- Household income
- $30,794
- Rent vs Own
- Severe rent burden
- 1603.0
Population outlook (Jefferson County) Hauer SSP2
- Today (2025)
- 823,112 people
- By 2030
- 849,343 · +3.2%
- By 2040
- 895,696 · +8.8%
- By 2050
- 933,630 · +13.4%
- By 2075
- 1,028,262 · +24.9%
- By 2100
- 1,072,675 · +30.3%
Race, ethnicity, and origin ACS 2023
- Neighborhood character
- Diverse neighborhood (Simpson 0.56)
- Race & ethnicity
- Black 49% White 44% Two or more races 4% Hispanic / Latino 3%
- Common ancestry
- Slovak 2% Lithuanian 2% Romanian 1%
- Foreign-born
- 3% · Canada
- Languages at home
- 97% English-only · Spanish 2%
Political lean MEDSL · Jefferson
- 2024 margin
- D (+16.6) · D 57.4% · R 40.9% · Other 1.7%
- 2008→2024 swing
- +4.5pp toward D · 2008: 12.0pp · 2024: 16.6pp
- All cycles
- 2024: D+16.6 2020: D+20.1 2016: D+13.3 2012: D+11.1 2008: D+12.0
Not yet ingested
- Civics
- —
Market trends
- HPI YoY
- ▼ -64.74%
- Current HPI
- 405.1872
- Rent YoY
- ▲ 3.73%
- Metro
- Louisville/Jefferson County, KY-IN
- State GDP YoY
- ▲ 1.81%
- F500 in state
- 4
Industry mix (Fortune 500 HQ in KY)
| Industry | F500 HQs | Revenue |
|---|---|---|
| Healthcare | 1 | $118B |
|
||
| Food / Beverage | 1 | $7B |
|
||
Price history
+112.5% since first listed25 events — show timeline
- 2026-03-31 Relisted — Metro Search MLS
- 2026-03-31 Price Changed $85,000 Metro Search MLS
- 2026-03-16 Rental Removed $1,295 MSMLS
- 2026-03-10 Listed for Rent $1,295 MSMLS
- 2026-03-06 Listing Removed — Metro Search MLS
- 2025-12-05 Price Changed $75,000 Metro Search MLS
- 2025-10-27 Price Changed $80,000 Metro Search MLS
- 2025-10-02 Listed $85,000 Metro Search MLS
- 2025-07-10 Sold (Public Records) $67,500 Public Records
- 2024-01-06 Relisted — Metro Search MLS
- 2023-11-13 Pending — Metro Search MLS
- 2023-11-12 Pending — Metro Search MLS
- 2023-11-12 Listing Removed — Metro Search MLS
- 2023-10-09 Listed $80,000 Metro Search MLS
- 2023-10-09 Listing Removed — Metro Search MLS
- 2023-09-25 Listed $90,000 Metro Search MLS
- 2021-11-24 Pending — Metro Search MLS
- 2021-11-03 Sold (Public Records) $46,000 Public Records
- 2021-11-02 Sold (MLS) $46,000 Metro Search MLS
- 2021-10-11 Contingent — Metro Search MLS
- 2021-10-04 Listed $55,000 Metro Search MLS
- 2019-11-05 Sold (Public Records) $32,250 Public Records
- 2019-10-30 Sold (MLS) $32,250 Metro Search MLS
- 2019-09-26 Pending — Metro Search MLS
- 2019-09-16 Listed $40,000 Metro Search MLS
Property tax history
+11.8%/yrLatest (2025): $580 · -1.9% YoY. Source: county tax records.
Cash-flow waterfall
monthlySold comps — $/sqft
last 12 mo · ≤1 miLoading sold comps…