 Duplex
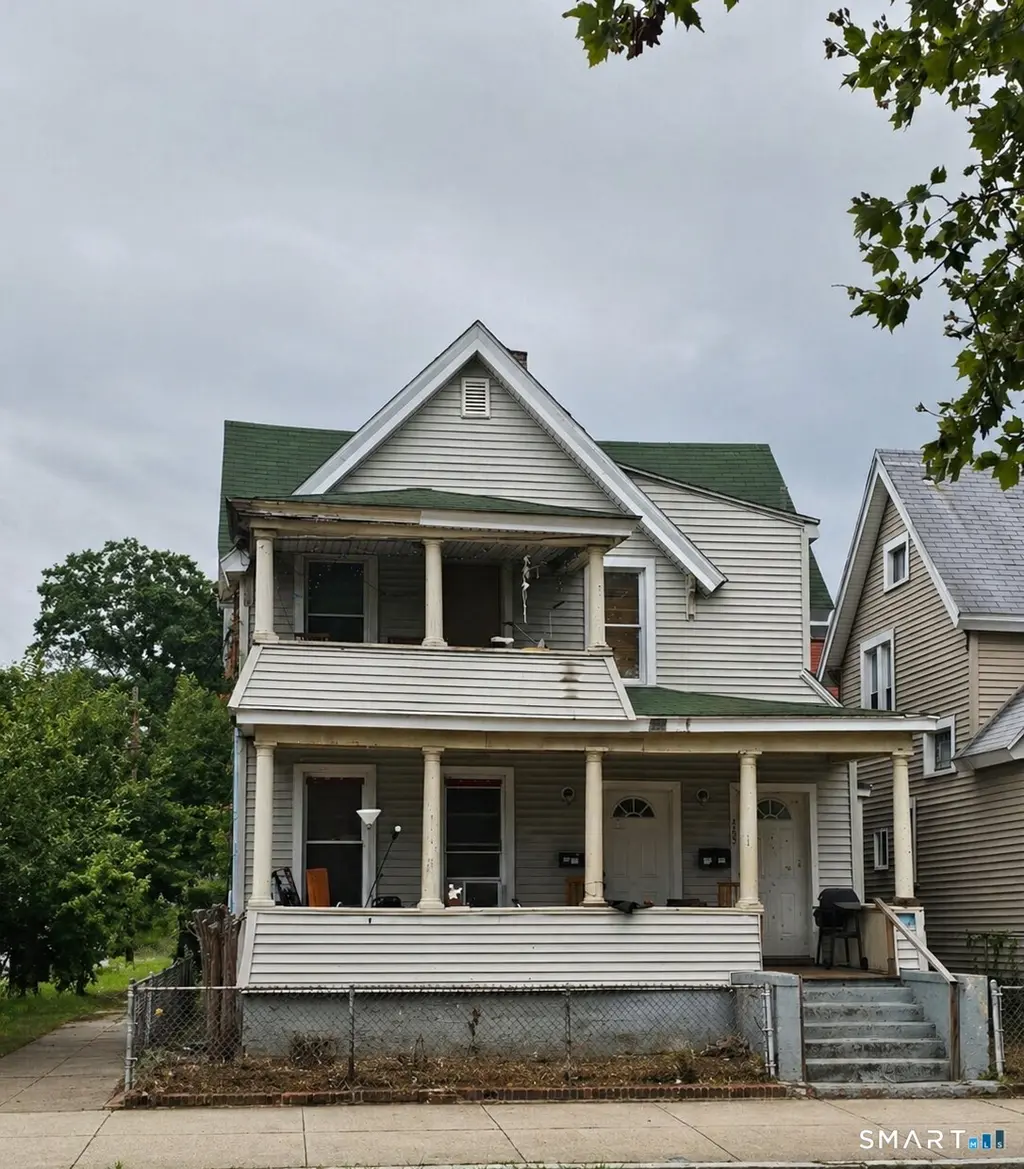
431 Greenwich Ave · New Haven, CT
Flood risk 1/10 · Minimal
- FEMA flood zone
- X (unshaded)
- Chance of flooding over 30 yrs
- 0.0%
- Est. flood insurance / yr
- $473 – $860
Fire risk 1/10 · Minimal
- Est. fire insurance / yr
- $829 – $1,539
Heat risk 7/10 · Major
- Hot days now (above 99°F)
- 7 days/yr
- Hot days in 30 yrs
- 16 days/yr
Wind risk 6/10 · Moderate
- Chance of severe wind over 30 yrs
- 56.0%
Air-quality risk 5/10 · Moderate
- Unhealthy air days now
- 6 days/yr
- Unhealthy air days in 30 yrs
- 8 days/yr
Risk factors via First Street. Map © Google.
Why this score? — see what drove the B- grade
The composite is a weighted blend of 9 inputs, each scored 0–100. Each bar is that input's sub-score; the figure is the points it added to the 100-point composite (weight × sub-score).
- Cash flow +25.2/30.0
- Appreciation +9.9/10.0
- DSCR +8.3/10.0
- 1% rule +6.6/10.0
- ARV discount +6.5/15.0
- Livability +4.0/5.0
- Rent growth +3.3/5.0
- Condition / age +2.5/5.0
- Schools +1.5/10.0
$419,900
🖨 Deal sheet 📄 Offer letter ✓ Due diligence
Multi-family units
County records classify this as Multi-Family (2-4 Unit). Listing-text estimate: 2 units. confirmed
Listing remarks
Well-maintained 2-family property located in the desirable Hill neighborhood of New Haven. This property features one 3-bedroom unit and one 4-bedroom unit, offering strong rental potential and flexibility for both investors and owner-occupants. The second-floor unit has been fully renovated and showcases oak kitchen cabinetry, vinyl plank flooring throughout, and a beautifully updated bathroom with marble-look tile, refinished tub, and new vanity. Additional upgrades include all new lighting fixtures and appliances, along with fresh paint throughout. The first-floor unit offers solid layout and space, with opportunity for value-add improvements. Tenants pay their own utilities, helping to
Key facts
- Fully renovated
- Marble-look tile
- Refinished tub
Tags
Property features AI
Exterior
- Utilities: Public water connected; Public sewer connected
- Home design: Multi-family property (2-family)
- Construction: Frame construction; Concrete foundation; Gray exterior color
- Exterior features: Level lot; Vinyl siding; Gable roof
Interior
- Bedrooms: 7 bedrooms total (across units)
- Bathrooms: 2 full bathrooms
- Heating & cooling: Hot air heating; Natural gas fuel; 40-gallon hot water tank
- Interior features: Full basement; Attic with hatch access; Total of 10 rooms (multi-family total rooms: 10)
Neighborhood map
What this means for you Summary
Snapshot
- This is a 1×3bd/1.0ba + 1×4bd/1.0ba units multifamily listed at $420k.
Deal economics
- At list price, monthly cash flow is $936 ($11k/yr) — positive. Per door: $468/mo.
- The deal already cash-flows at list — no discount required.
- Meets the 1% rule at list price ($5k rent vs $420k).
- Recommended offer: $407k (3.0% below list) — sets the bar for market timing.
- Cap rate 9.0% vs local median 4.8% in New Haven — top-decile yield for the area; either an underpriced asset or a hidden risk that comps aren't pricing in. Stress-test before assuming the spread holds.
Location & tenants
- Location reads 79/100 on livability (#31 in CT, #2,190 nationally) — a middle-class / working-renter tenant base. Strengths: amenities A+, commute A+, health & safety A+; Watch: schools D+, employment D, crime F.
- New Haven School District (urban): math 12% / reading 25% proficiency, ranked #147 of 153 in CT (top 96%) — low school quality limits family demand, transient renter base, plan for 1-2y turnover; 66% free/reduced lunch — lower-income household profile, screen leases tightly.
- Market conditions: Rents rising (+3.3%/yr); 46 active listings in the ZIP; 26 comparable units currently listed for rent nearby; rentals at typical pace (median 24d on market — plan ~3-4 weeks tenant-placement turnaround); 1,059 units permitted in South Central Connecticut Planning Region in 2024 (779 in 5+ unit buildings).
- At $4,854/mo this rent would consume 117% of the median local household income ($50k/yr) (locally 1321% of renters already pay >50% of income on rent) — very limited rent-growth headroom before tenants either downsize or default.
Forward outlook
- In year one you build about $44k of equity ($3k loan paydown + $41k appreciation (9.8% local appreciation)).
- At projected returns (9.8% appreciation + 3.3% rent growth), your $118k cash investment doubles in ~3 years — after that, you're playing with house money.
- By year 2, paydown + projected appreciation supports a ~$71k cash-out refi (75% LTV) — recoverable capital for the next deal without selling this one.
Negotiation context
- It's been on market 40 days — a 3% lower offer ($407k) is reasonable based on typical stale-listing flexibility.
- 6 sale attempts since 11y ago; this cycle's ask is 5% above the opening price — seller raised mid-cycle; expect resistance to lowballs.
- Current owner paid $126k; list at $420k implies a 233% gain — meaningful room to come down on a strong offer.
Risks & watch-outs
- Watch-outs: built in 1910 — expect roof / HVAC / electrical / plumbing capex.
- Climate carrying-cost: major wind risk, 56% chance of damaging wind over 30y; extreme-heat days projected 7→16/yr by 2055 (HVAC capex compounding) — expect insurance premiums to compound above CPI over the hold.
Questions for the listing agent
- It's been on market 40 days. Have you received any prior offers? Is the seller open to a 3% concession, seller financing, or rate buy-down credit?
- Can we see the unit-by-unit rent roll, current vacancy, and any below-market leases? What's the average tenancy length?
- What capital expenditures (roof, boiler, parking lot, exteriors) have been made in the last 5 years, and what's planned in the next 2?
- Built in 1910 — when were the roof, HVAC, electrical panel, plumbing, and water heater last replaced?
- Is there a deadline driving the sale (1031 exchange, divorce, estate, relocation)? That informs how much negotiation room exists.
- Schools are D-rated, which usually means shorter tenancies and higher turnover. Who's the typical renter profile here, and what's been the actual vacancy rate?
- Crime grade is F in this area — have there been break-ins, vandalism, or insurance claims at this property in the last 3 years? What carrier currently insures it and at what premium?
- What's the average days-on-market for RENTAL listings here right now (not sales)? A rising rental-DOM trend means longer vacancies and softer asking-rent achievability than the comps imply.
- What's the recent tenant-quality profile in this submarket — average credit score on applications, eviction rate, late-payment / NSF rate, and stable-employment percentage? A property-management company in the area should have these aggregated.
- How much new apartment / multifamily construction is in the pipeline within 1–3 miles? Heavy new supply (>2% of stock underway) typically softens rents 12–24 months out; light construction supports rent growth.
Investment metrics
- 1% rule
- 1.16% ✓
- Cap rate
- 8.97%
- Cash-on-cash
- 9.55%
- DSCR
- 1.43
- GRM
- 7.2
CMA / ARV
- ARV (median comp)
- $410,748
- List price
- $419,900
- Delta
- 2.23%
- Verdict
- FAIR
- Comps
- 20 within 1.0 mi
Show comp detail 12 sales within ~0.75 mi
| Address | Dist | Beds/Ba | Sqft | Sold | Price | $/sf | Match |
|---|---|---|---|---|---|---|---|
| 222 Howard Ave | 0.20mi | 5/3.0 (+1) | 2,311 (+4%) | 11mo | $470,000 | $203 | 71 |
| 37 Morris St | 0.28mi | 4/2.0 | 2,236 (+0%) | 17mo | $360,000 | $161 | 69 |
| 46 Liberty St | 0.48mi | 4/2.0 | 2,110 (-6%) | 2mo | $320,000 | $152 | 63 |
| 21 Edgar St | 0.38mi | 5/2.5 (+1) | 2,226 (-0%) | 17mo | $315,000 | $142 | 60 |
| 201 Howard Ave | 0.24mi | 4/2.0 | 2,402 (+8%) | 14mo | $320,000 | $133 | 60 |
| 173 Rosette St | 0.32mi | 5/2.0 (+1) | 2,312 (+4%) | 13mo | $212,625 | $92 | 60 |
| 121 Plymouth St | 0.13mi | 5/2.0 (+1) | 2,539 (+14%) | 10mo | $355,000 | $140 | 54 |
| 220 Greenwich Ave | 0.30mi | 5/2.0 (+1) | 1,980 (-11%) | 12mo | $350,000 | $177 | 48 |
| 216 Greenwich Ave | 0.31mi | 5/3.0 (+1) | 1,980 (-11%) | 17mo | $310,000 | $157 | 48 |
| 189 Putnam St | 0.40mi | 5/3.0 (+1) | 2,450 (+10%) | 15mo | $320,000 | $131 | 47 |
| 171 Frank St | 0.54mi | 5/3.0 (+1) | 1,975 (-12%) | 10mo | $340,000 | $172 | 43 |
| 194 Frank St | 0.53mi | 4/2.0 | 1,918 (-14%) | 17mo | $285,000 | $149 | 34 |
Match score weights: distance 35% · size 25% · config 20% · recency 20%. Top-matched comps best support the ARV.
Projected returns pro-forma
9.81% appreciation · 3.3% rent growth · sell at horizon
- IRR
- 31.0%
- Equity multiple
- 3.42×
- Total profit
- $284,375
- Equity at exit
- $372,459
- IRR
- 27.0%
- Equity multiple
- 7.74×
- Total profit
- $792,281
- Equity at exit
- $797,107
Cash invested: $117,572 (down + closing). Projections, not guarantees.
Landlord ↔ Tenant lean methodology
- Overall (STATE)
- 27 Tenant-Leaning
- State Connecticut
- 27 Tenant-Leaning · D+7
- County
- — inherits STATE
- City
- — inherits STATE
ZIP-level market 06519
- Home prices YoY
- 2.7%
- Rents YoY
- 3.3%
- Active inventory
- 46
- Price-to-rent
- 15.2×
Monthly cashflow live
- Estimated rent
- $4,854 high interval (Pro) →
- Mortgage (P&I)
- −$2,202
- Tax from tax record
- −$522 /mo · $6,260/yr
- Insurance
- −$175
- HOA
- −$0
- Vacancy / Maint / Mgmt
- −$1,019
- Net cashflow
- $936
Break-even live
2-unit breakdown (identical units grouped — click to expand)
| Units | Beds | Baths | Est. rent |
|---|---|---|---|
| 1× unit | 3 | 1 | $2,299 |
| 1× unit | 4 | 1 | $2,555 |
| Total (2 units) | $4,854 | ||
UW: 25.0% down · 7.5% · 30yr · 1.5% tax · 5.0% vac · 8.0% maint · 8.0% mgmt
Financing live
Cash to close
- Down payment
- $104,975
- Closing costs
- $12,597
- Reserves months
- —
- Total cash needed
- —
Loan-product check · same deal, 3 products live
Conventional
25% down · 7.5% · 30yr
- Down + closing
- —
- Monthly P&I
- —
- Monthly cashflow
- —
- DSCR
- —
- Eligible?
- —
Personal DTI + credit; lowest rate.
DSCR
20% down · 8.5% · 30yr
- Down + closing
- —
- Monthly P&I
- —
- Monthly cashflow
- —
- DSCR
- —
- Eligible?
- —
No personal income docs; deal must DSCR.
Hard money
10% down · 12.0% · 12mo
- Down + closing
- —
- Monthly P&I
- —
- Monthly cashflow
- —
- DSCR
- —
- Eligible?
- —
Short-term bridge; refi at stabilization.
Rent comps 26 comps
| Address | Beds | Baths | Sqft | Rent | $/sqft | DOM | Units | Dist |
|---|---|---|---|---|---|---|---|---|
| 36 Cassius St New Haven, CT | 4.0 | 1.5 | 1872 | $2,300 | $1.23 | 43d | 1 | 0.16mi |
| 34 Cassius St Unit 36 New Haven, CT | 5.0 | 2.0 | 1872 | $2,300 | $1.23 | 43d | 1 | 0.16mi |
| 461 Howard Ave Unit 3 New Haven, CT | 4.0 | 1.0 | 1450 | $1,950 | $1.34 | 44d | 1 | 0.26mi |
| 84 Morris St Unit 2nd Fl New Haven, CT | 5.0 | 2.0 | 1410 | $1,825 | $1.29 | 2d | 1 | 0.35mi |
| 69 Adeline St Unit D New Haven, CT | 3.0 | 1.5 | 2600 | $2,250 | $0.87 | 23d | 1 | 0.59mi |
| 9 Tower Ln New Haven, CT | 3.0 | 1.0–2.0 | 1054 | $5,394 | $5.12 | 2d | 74 | 0.73mi |
| 50 Wood St West Haven, CT | 3.0 | 1.0 | 2314 | $2,400 | $1.04 | 2d | 1 | 0.88mi |
| 37 Center St Unit 2 West Haven, CT | 5.0 | 2.0 | 2500 | $3,300 | $1.32 | 2d | 1 | 0.95mi |
| 69 Center St West Haven, CT | 3.0 | 2.0 | 1530 | $2,000 | $1.31 | 14d | 1 | 1.02mi |
| 87 Union St New Haven, CT | 4.0 | 1.0–4.0 | 959 | $5,543 | $5.78 | 3d | 16 | 1.09mi |
| 813 Chapel St Unit 817-2B New Haven, CT | 3.0 | 2.0 | 1446 | $2,745 | $1.90 | 43d | 1 | 1.18mi |
| 203 Main St Unit 2nd fl West Haven, CT | 4.0 | 1.0 | 1967 | $2,400 | $1.22 | 23d | 1 | 1.23mi |
| 408 Legion Ave Unit 2 New Haven, CT | 3.0 | 1.0 | 1610 | $2,000 | $1.24 | 43d | 1 | 1.27mi |
| 41 Howe St New Haven, CT | 4.0 | 2.0 | 1795 | $3,750 | $2.09 | 43d | 1 | 1.27mi |
| 41 Howe St Apt 2 New Haven, CT | 3.0 | 1.0 | 1795 | $3,200 | $1.78 | 23d | 1 | 1.27mi |
| 41 Howe St Apt 2 New Haven, CT | 3.0 | 1.0 | 1795 | $3,200 | $1.78 | 43d | 1 | 1.27mi |
| 526 Chapel St Unit B New Haven, CT | 3.0 | 2.0 | 1450 | $3,500 | $2.41 | 21d | 1 | 1.28mi |
| 5 Oak Pl West Haven, CT | 3.0 | 1.0 | 2300 | $1,900 | $0.83 | 2d | 1 | 1.28mi |
| 43 Howe St New Haven, CT | 4.0 | 2.0 | 1995 | $4,995 | $2.50 | 14d | 1 | 1.28mi |
| 271 Elm St Unit 2 West Haven, CT | 4.0 | 2.0 | 1435 | $3,000 | $2.09 | 23d | 1 | 1.34mi |
| 17 Treadwell St West Haven, CT | 4.0 | 1.0 | 2814 | $2,450 | $0.87 | 23d | 1 | 1.35mi |
| 120 Dwight St New Haven, CT | 3.0 | 2.0 | 1750 | $3,175 | $1.81 | 21d | 2 | 1.35mi |
| 82 Gilbert St West Haven, CT | 3.0 | 1.0 | 2641 | $2,400 | $0.91 | 43d | 1 | 1.37mi |
| 441 Chapel St Unit 2A1 (shared) New Haven, CT | 4.0 | 4.0 | 2151 | $3,600 | $1.67 | 2d | 1 | 1.43mi |
| 65 Edgewood Ave New Haven, CT | 3.0 | 2.0 | 1400 | $2,695 | $1.93 | 14d | 1 | 1.46mi |
| 280 3rd Ave Unit 2nd fl West Haven, CT | 4.0 | 2.0 | 1819 | $2,500 | $1.37 | 2d | 1 | 1.50mi |
Listing history 24 events
-
2026-06-10status $419,900 Under Contract 40 DOM
-
2026-06-09days on market $419,900 Active 40 DOM
-
2026-06-08days on market $419,900 Active 39 DOM
-
2026-06-07days on market $419,900 Active 38 DOM
-
2026-06-05days on market $419,900 Active 35 DOM
-
2026-06-03days on market $419,900 Active 34 DOM
-
2026-06-03days on market $419,900 Active 33 DOM
-
2026-06-01days on market $419,900 Active 32 DOM
-
2026-05-31days on market $419,900 Active 31 DOM
-
2026-04-29$399,000 Active 1104-char remark
-
2024-10-06historical
-
2024-10-04$320,000 Active
-
2024-08-21historical
-
2024-08-01status Active
-
2024-08-01historical
-
2024-07-02status Active
-
2024-07-01historical
-
2024-04-21price $320,000
-
2023-12-29$330,000 Active
-
2022-03-22price $1,695
-
2015-12-21soldstatus $126,000
-
2015-11-25historical
-
2015-11-18$124,900
-
2008-12-02soldstatus $125,000
ⓘ Source: listings_history table (triggers on properties + properties_extension) + one-shot
backfill from property_details.listing_events for pre-trigger history.
Tax reassessment forecast CT · Partial reset (capped growth)
- Current annual tax
- $6,260 · $522/mo
- Projected year-2 tax
- $7,623 · $635/mo
- Expected delta
- +$1,363/yr (+$114/mo · 21.8%)
ⓘ Screening estimate from a state-policy table — verify with the county assessor before closing.
Climate risk First Street
- Flood 1/10 Low FEMA zone X (unshaded) · 0% chance over 30 yrs
- Wildfire 1/10 Low
- Heat 7/10 Severe 7 d/yr ≥99°F today · 16 d/yr by 30 yrs out
- Wind 6/10 Major 56% chance of damaging wind over 30 yrs
- Air quality 5/10 Major 6 unhealthy d/yr today · 8 by 30 yrs out
Nearby sold comps map
Loading sold comps map…
Walkable amenities ~0.75 mi
Loading nearby amenities…
Taxation est. · year 1
- Rental income
- $58,248
- − Mortgage interest
- −$23,521
- − Property taxes
- −$6,260
- − Insurance
- −$2,100
- − Repairs & maintenance
- −$4,660
- − Management
- −$4,660
- − Depreciation
- −$12,215
- Taxable income
- $4,833
- Est. tax owed @ 24.0%
- −$1,160
- After-tax cash flow
- $10,073/yr
For passive investors: Depreciation is non-cash, so a rental often shows a tax loss while cash-flowing — sheltering income. Rental losses are passive: they offset passive income freely, and up to $25,000/yr can offset ordinary (W-2) income if you actively participate and your MAGI is under $100k (phasing out to $0 by $150k); unused losses carry forward. On sale, claimed depreciation is recaptured at up to 25%, and gains may owe capital-gains tax (a 1031 exchange can defer both). Figures are a year-1 estimate at your 24.0% rate — not tax advice; consult a CPA.
Schools (NCES district)
- District
- New Haven School District
- NCES district ID
- 0902790
- Math proficiency
- 12% ▼ -10.00%
- Reading proficiency
- 25% ▼ -10.00%
- Median HH income
- $38,058
- Composite
- 15.48/100
- National rank
- #9308
- State rank
- #147 of 153 in CT
Livability — New Haven
- Score
- 79/100
- State rank
- #31
- US rank
- #2190
Category grades
Schools grade is shown separately in the Schools card above.
Census & demographics
- Census place
- New Haven, CT
- County
- New Haven County · 688,236 people
- City population
- 132,813
- Metro
- New Haven-Milford, CT
- Population (ZIP)
- 15,605
- Household income
- $49,619
- Rent vs Own
- Severe rent burden
- 1321.0
Population outlook (South Central Connecticut County) Hauer SSP2
- By 2040
- 608,362
Race, ethnicity, and origin ACS 2023
- Neighborhood character
- Diverse neighborhood (Simpson 0.67)
- Race & ethnicity
- Hispanic / Latino 49% Black 26% White 15% Two or more races 13% Asian 4% Native American 1%
- Hispanic origin (detail)
- Mexican 15% Puerto Rican 25% Dominican 3%
- Common ancestry
- Romanian 1% Lithuanian 1%
- Foreign-born
- 25% · Canada, Jamaica, China
- Languages at home
- 50% English-only · Spanish 42% Other Indo-European 4% Arabic 1%
Political lean MEDSL · South Central Connecticut
- 2024 margin
- Strong D (+20.1) · D 59.0% · R 38.9% · Other 2.1%
- All cycles
- 2024: D+20.1
Not yet ingested
- Civics
- —
Market trends
- HPI YoY
- ▲ 9.81%
- Current HPI
- 377.4885
- Rent YoY
- ▲ 3.30%
- Metro
- New Haven-Milford, CT
- State GDP YoY
- ▲ 1.06%
- F500 in state
- 38
Industry mix (Fortune 500 HQ in CT)
| Industry | F500 HQs | Revenue |
|---|---|---|
| Industrial Machinery | 4 | $38B |
|
||
| Insurance | 3 | $71B |
|
||
| Financial Services | 2 | $25B |
|
||
| Transportation / Logistics | 2 | $18B |
|
||
| Healthcare | 1 | $247B |
|
||
| Telecommunications | 1 | $55B |
|
||
Price history
+235.9% since first listed17 events — show timeline
- 2026-06-09 Pending — Smart MLS
- 2026-05-29 Price Changed $419,900 Smart MLS
- 2026-04-29 Listed $399,000 Smart MLS
- 2024-10-06 Listing Removed — Smart MLS
- 2024-10-04 Listed $320,000 Smart MLS
- 2024-08-21 Listing Removed — Smart MLS
- 2024-08-01 Relisted — Smart MLS
- 2024-08-01 Listing Removed — Smart MLS
- 2024-07-02 Relisted — Smart MLS
- 2024-07-01 Listing Removed — Smart MLS
- 2024-04-21 Price Changed $320,000 Smart MLS
- 2023-12-29 Listed $330,000 Smart MLS
- 2022-03-22 Price Changed $1,695 RENT.
- 2015-12-21 Sold (MLS) $126,000 Smart MLS
- 2015-11-25 Listing Removed — Smart MLS
- 2015-11-18 Listed $124,900 Smart MLS
- 2008-12-02 Sold (Public Records) $125,000 Public Records
Property tax history
+4.8%/yrLatest (2023): $6,260 · -6.4% YoY. Source: county tax records.
Cash-flow waterfall
monthlySold comps — $/sqft
last 12 mo · ≤1 miLoading sold comps…