 5-Plex
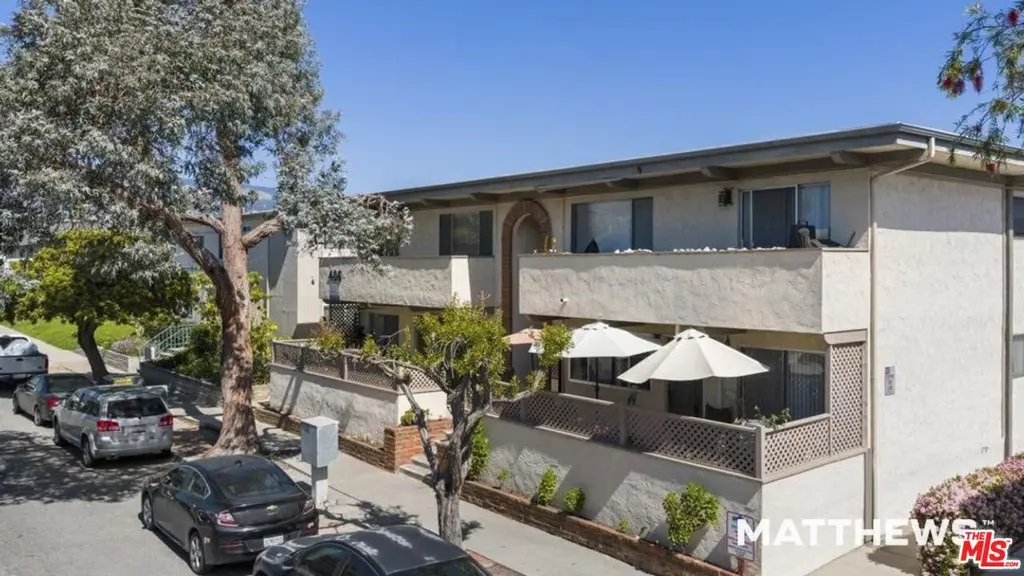
406 Ellwood Beach Dr · Goleta, CA
Flood risk 1/10 · Minimal
- FEMA flood zone
- X (unshaded)
- Chance of flooding over 30 yrs
- 0.0%
- Est. flood insurance / yr
- $507 – $1,088
Fire risk 5/10 · Moderate
- Est. fire insurance / yr
- $659 – $1,223
Heat risk 5/10 · Moderate
- Hot days now (above 83°F)
- 7 days/yr
- Hot days in 30 yrs
- 19 days/yr
Wind risk 1/10 · Minimal
- Chance of severe wind over 30 yrs
- —
Air-quality risk 6/10 · Moderate
- Unhealthy air days now
- 10 days/yr
- Unhealthy air days in 30 yrs
- 10 days/yr
Risk factors via First Street. Map © Google.
Why this score? — see what drove the D grade
The composite is a weighted blend of 9 inputs, each scored 0–100. Each bar is that input's sub-score; the figure is the points it added to the 100-point composite (weight × sub-score).
- Cash flow +11.0/30.0
- ARV discount +7.5/15.0
- Schools +5.6/10.0
- Rent growth +4.1/5.0
- Livability +4.0/5.0
- DSCR +3.2/10.0
- 1% rule +3.0/10.0
- Condition / age +2.5/5.0
- Appreciation +0.0/10.0
$3,600,000
🖨 Deal sheet 📄 Offer letter ✓ Due diligence
Multi-family units
County records classify this as Multi-Family (5+ Unit). Listing-text estimate: 5 units. confirmed
5+ unit building — per-unit beds/baths from public records are typically unavailable; the breakdown below (if shown) is an estimate from the listing text.
Listing remarks
-Prime Coastal Location: Located steps from Ellwood Beach in the highly sought-after Goleta submarket of Santa Barbara County, benefiting from strong renter demand driven by proximity to UCSB, Isla Vista spillover, and major South Coast employment centers. -Desirable Unit Mix: Two-bedroom layouts align with strong local demand from students, young professionals, and shared living arrangements common in the UCSB-adjacent rental market. -Clear Rental Upside: Current rents average $2,845 for two-bedroom/one-bath units and $3,031 for two-bedroom/two-bath units, while renovated units achieve $3,200 per month, demonstrating immediate mark-to-market potential. -Proven Renovation Strategy: Upgrades
Key facts
- 0.26 acre lot
- Parking
- Listed 73 days
Property features AI
Finance
- Other: Unit rent examples: Four units at $2,845 (actual $11,380 total for that group), four units at $3,031 (actual $12,125 total for that group); Projected rents listed (example: $14,000 and $14,800 for unit groups)
- Financial info: Gross income: $282,060; Gross operating income: $273,957; Net operating income: $183,252; Total annual expenses: $90,705; Cap rate: 5.09%; Gross rent multiplier: 12.76; Vacancy rate: 3%; Income status: Scheduled
- HOA & community: Total of 8 units in the complex
Exterior
- Parking: Other garage/parking type
- Security: No security details provided
- Utilities: No water, sewer, or power details provided
- Home design: Residential income property; Single building; Single-story total floors with multiple levels indicated
- Construction: No construction material, foundation, or year built provided
- Exterior features: Other exterior structures; Lot approximately 0.26 acres
Interior
- Kitchen: No specific kitchen appliance details provided
- Bedrooms: Four 2-bedroom units; Four 2-bedroom units (second unit type)
- Flooring: No flooring details provided
- Bathrooms: Four 1-bath units; Four 2-bath units
- Heating & cooling: Other heating; Other cooling
- Interior features: Apartment units; Multi-level building
- Laundry & utility: No laundry/utility details provided
Neighborhood map
What this means for you Summary
Snapshot
- This is a 5 × 3-bed/2.4-bath units multifamily listed at $3.60M.
Deal economics
- At list price, monthly cash flow is $-1k ($-18k/yr) — negative. Per door: $-297/mo.
- To cash-flow at today's rent, offer at most $3.34M (7.3% below list).
- To meet the 1% rule (rent ≥ 1% of price), the offer needs to be $2.87M (20.4% below list).
- Recommended offer: $2.87M (20.4% below list) — sets the bar for 1% rule.
- Cap rate 5.8% vs local median 2.9% in Goleta — top-decile yield for the area; either an underpriced asset or a hidden risk that comps aren't pricing in. Stress-test before assuming the spread holds.
Location & tenants
- Location reads 81/100 on livability (#40 in CA, #1,510 nationally) — a professional / high-income tenant draw. Strengths: amenities A+, commute A+, employment A+; Watch: cost of living F.
- Goleta Union Elementary (suburban): math 59% / reading 65% proficiency, ranked #195 of 1,400 in CA (top 14%) — acceptable for families but not a draw, mixed tenant base, ~2y average lease.
- Market conditions: Rents rising fast (+6.5%/yr); 70 active listings in the ZIP; solid renter incomes; 719 units permitted in Santa Barbara County in 2024 (217 in 5+ unit buildings).
- At $28,663/mo this rent would consume 382% of the median local household income ($90k/yr) (locally 4402% of renters already pay >50% of income on rent) — very limited rent-growth headroom before tenants either downsize or default.
Forward outlook
- Local home prices are declining (-3.0%/yr); year-one equity from $25k of loan paydown is wiped out by about $108k of value loss. Plan a longer hold.
- Santa Barbara County population projected at +20% by 2050 — long-run rental-demand tailwind backs the buy-and-hold thesis.
Negotiation context
- It's been on market 73 days — a 6% lower offer ($3.38M) is reasonable based on typical stale-listing flexibility.
- 2 sale attempts with the ask held roughly flat each time — persistent listings suggest the price (not the market) is what's stuck; bring a comps-based counter.
Risks & watch-outs
- Climate carrying-cost: moderate wildfire risk; extreme-heat days projected 7→19/yr by 2055 (HVAC capex compounding) — expect insurance premiums to compound above CPI over the hold.
Questions for the listing agent
- What do current leases actually rent for vs. the listed asking? Can we see a recent rent roll and the last 12 months of T-12 income?
- It's been on market 73 days. Have you received any prior offers? Is the seller open to a 20% concession, seller financing, or rate buy-down credit?
- Can we see the unit-by-unit rent roll, current vacancy, and any below-market leases? What's the average tenancy length?
- What capital expenditures (roof, boiler, parking lot, exteriors) have been made in the last 5 years, and what's planned in the next 2?
- Why hasn't it sold? Are there any deal-killer items the seller is aware of (foundation, flood, title, zoning, code violations)?
- Is there a deadline driving the sale (1031 exchange, divorce, estate, relocation)? That informs how much negotiation room exists.
- The area grade is low — what's the realistic commute time and amenity access for the typical tenant pool here? Any planned neighborhood developments (good or bad) we should know about?
- What's the average days-on-market for RENTAL listings here right now (not sales)? A rising rental-DOM trend means longer vacancies and softer asking-rent achievability than the comps imply.
- What's the recent tenant-quality profile in this submarket — average credit score on applications, eviction rate, late-payment / NSF rate, and stable-employment percentage? A property-management company in the area should have these aggregated.
- How much new apartment / multifamily construction is in the pipeline within 1–3 miles? Heavy new supply (>2% of stock underway) typically softens rents 12–24 months out; light construction supports rent growth.
Investment metrics
- 1% rule
- 0.80% ✗
- Cap rate
- 5.80%
- Cash-on-cash
- -1.77%
- DSCR
- 0.92
- GRM
- 10.5
CMA / ARV
No comps found within radius.
Projected returns pro-forma
-3.0% appreciation · 6.49% rent growth · sell at horizon
- IRR
- -15.5%
- Equity multiple
- 0.43×
- Total profit
- $-573,762
- Equity at exit
- $536,772
- IRR
- -2.1%
- Equity multiple
- 0.84×
- Total profit
- $-162,173
- Equity at exit
- $311,262
Cash invested: $1,008,000 (down + closing). Projections, not guarantees.
Landlord ↔ Tenant lean methodology
- Overall (STATE)
- 18 Strongly Tenant-Friendly
- State California
- 18 Strongly Tenant-Friendly · D+13
- County
- — inherits STATE
- City
- — inherits STATE
ZIP-level market 93117
- Rents YoY
- 6.5%
- Active inventory
- 70
- Price-to-rent
- 52.3×
Monthly cashflow live
- Estimated rent
- $28,663 medium interval (Pro) →
- Mortgage (P&I)
- −$18,879
- Tax from tax record
- −$3,749 /mo · $44,994/yr
- Insurance
- −$1,500
- HOA
- −$0
- Vacancy / Maint / Mgmt
- −$6,019
- Net cashflow
- $-1,485
Break-even live
5-unit breakdown (identical units grouped — click to expand)
| Units | Beds | Baths | Est. rent |
|---|---|---|---|
| 5× units | 3 | 2.4 | $28,665 |
| #1 | 3 | 2.4 | $5,733 |
| #2 | 3 | 2.4 | $5,733 |
| #3 | 3 | 2.4 | $5,733 |
| #4 | 3 | 2.4 | $5,733 |
| #5 | 3 | 2.4 | $5,733 |
| Total (5 units) | $28,663 | ||
UW: 25.0% down · 7.5% · 30yr · 1.5% tax · 5.0% vac · 8.0% maint · 8.0% mgmt
Financing live
Cash to close
- Down payment
- $900,000
- Closing costs
- $108,000
- Reserves months
- —
- Total cash needed
- —
Loan-product check · same deal, 3 products live
Conventional
25% down · 7.5% · 30yr
- Down + closing
- —
- Monthly P&I
- —
- Monthly cashflow
- —
- DSCR
- —
- Eligible?
- —
Personal DTI + credit; lowest rate.
DSCR
20% down · 8.5% · 30yr
- Down + closing
- —
- Monthly P&I
- —
- Monthly cashflow
- —
- DSCR
- —
- Eligible?
- —
No personal income docs; deal must DSCR.
Hard money
10% down · 12.0% · 12mo
- Down + closing
- —
- Monthly P&I
- —
- Monthly cashflow
- —
- DSCR
- —
- Eligible?
- —
Short-term bridge; refi at stabilization.
Listing history 7 events
-
2026-06-02status $3,600,000 Pending 73 DOM
-
2026-06-01days on market $3,600,000 Active 73 DOM
-
2026-05-31days on market $3,600,000 Active 72 DOM
-
2026-05-30days on market $3,600,000 Active 71 DOM
-
2026-04-13status Active
-
2026-03-26historical Backup Offers Accepted
-
2026-03-16$3,600,000 Active
ⓘ Source: listings_history table (triggers on properties + properties_extension) + one-shot
backfill from property_details.listing_events for pre-trigger history.
Tax reassessment forecast CA · Resets to sale price
- Current annual tax
- $44,994 · $3,749/mo
- Projected year-2 tax
- $44,994 · $3,749/mo
- Expected delta
- $0/yr ($0/mo · 0.0%)
ⓘ Screening estimate from a state-policy table — verify with the county assessor before closing.
Climate risk First Street
- Flood 1/10 Low FEMA zone X (unshaded) · 0% chance over 30 yrs
- Wildfire 5/10 Major
- Heat 5/10 Major 7 d/yr ≥83°F today · 19 d/yr by 30 yrs out
- Wind 1/10 Low
- Air quality 6/10 Major 10 unhealthy d/yr today · 10 by 30 yrs out
Nearby sold comps map
Loading sold comps map…
Walkable amenities ~0.75 mi
Loading nearby amenities…
Taxation est. · year 1
- Rental income
- $343,956
- − Mortgage interest
- −$201,656
- − Property taxes
- −$44,994
- − Insurance
- −$18,000
- − Repairs & maintenance
- −$27,516
- − Management
- −$27,516
- − Depreciation
- −$104,727
- Taxable loss
- −$80,454
- Est. tax savings @ 24.0%
- +$19,309
- After-tax cash flow
- $1,495/yr
For passive investors: Depreciation is non-cash, so a rental often shows a tax loss while cash-flowing — sheltering income. Rental losses are passive: they offset passive income freely, and up to $25,000/yr can offset ordinary (W-2) income if you actively participate and your MAGI is under $100k (phasing out to $0 by $150k); unused losses carry forward. On sale, claimed depreciation is recaptured at up to 25%, and gains may owe capital-gains tax (a 1031 exchange can defer both). Figures are a year-1 estimate at your 24.0% rate — not tax advice; consult a CPA.
Schools (NCES district)
- District
- Goleta Union Elementary
- NCES district ID
- 0615510
- Math proficiency
- 59% ▲ 1.00%
- Reading proficiency
- 65% ▲ 3.00%
- Median HH income
- $70,375
- Composite
- 56.2/100
- National rank
- #2513
- State rank
- #195 of 1400 in CA
Livability — Goleta
- Score
- 81/100
- State rank
- #40
- US rank
- #1510
Category grades
Schools grade is shown separately in the Schools card above.
Census & demographics
- Census place
- Goleta, CA
- County
- Santa Barbara County · 410,380 people
- City population
- 52,934
- Metro
- Santa Maria-Santa Barbara, CA
- Population (ZIP)
- 52,934
- Household income
- $90,037
- Rent vs Own
- Severe rent burden
- 4402.0
Population outlook (Santa Barbara County) Hauer SSP2
- Today (2025)
- 484,679 people
- By 2030
- 505,323 · +4.3%
- By 2040
- 545,783 · +12.6%
- By 2050
- 584,263 · +20.5%
- By 2075
- 682,586 · +40.8%
- By 2100
- 723,188 · +49.2%
Race, ethnicity, and origin ACS 2023
- Neighborhood character
- Diverse neighborhood (Simpson 0.66)
- Race & ethnicity
- White 47% Hispanic / Latino 31% Two or more races 15% Asian 14% Black 3%
- Hispanic origin (detail)
- Mexican 27%
- Common ancestry
- Italian 2% Slovak 2% Lithuanian 1%
- Foreign-born
- 19% · Canada, China, South Korea
- Languages at home
- 66% English-only · Spanish 19% Chinese 6% Other Indo-European 2%
Political lean MEDSL · Santa Barbara
- 2024 margin
- Strong D (+26.7) · D 61.8% · R 35.1% · Other 3.1%
- 2008→2024 swing
- +3.8pp toward D · 2008: 22.9pp · 2024: 26.7pp
- All cycles
- 2024: D+26.7 2020: D+32.1 2016: D+28.2 2012: D+17.1 2008: D+22.9
Not yet ingested
- Civics
- —
Market trends
- HPI YoY
- ▼ -1327.27%
- Current HPI
- 301.0456
- Rent YoY
- ▲ 6.49%
- Metro
- Santa Maria-Santa Barbara, CA
- State GDP YoY
- ▲ 3.21%
- F500 in state
- 116
Industry mix (Fortune 500 HQ in CA)
| Industry | F500 HQs | Revenue |
|---|---|---|
| Technology | 27 | $1,492B |
|
||
| Financial Services | 3 | $174B |
|
||
| Retail | 3 | $44B |
|
||
| Insurance | 3 | $26B |
|
||
| Media / Entertainment | 2 | $115B |
|
||
| Pharmaceuticals / Biotech | 2 | $62B |
|
||
Price history
3 events — show timeline
- 2026-04-13 Relisted — TheMLS
- 2026-03-26 Contingent — TheMLS
- 2026-03-16 Listed $3,600,000 TheMLS
Property tax history
+12.8%/yrLatest (2025): $44,994 · +401.5% YoY. Source: county tax records.
Cash-flow waterfall
monthlySold comps — $/sqft
last 12 mo · ≤1 miLoading sold comps…