1653 NW 58th Ave #14 · Lauderhill, FL
Flood risk 1/10 · Minimal
- FEMA flood zone
- X (shaded)
- Chance of flooding over 30 yrs
- 0.0%
- Est. flood insurance / yr
- $507 – $1,088
Fire risk 1/10 · Minimal
- Est. fire insurance / yr
- $947 – $1,759
Heat risk 10/10 · Severe
- Hot days now (above 105°F)
- 7 days/yr
- Hot days in 30 yrs
- 27 days/yr
Wind risk 10/10 · Severe
- Chance of severe wind over 30 yrs
- 99.0%
Air-quality risk 2/10 · Minimal
- Unhealthy air days now
- 2 days/yr
- Unhealthy air days in 30 yrs
- 2 days/yr
Risk factors via First Street. Map © Google.
Why this score? — see what drove the C- grade
The composite is a weighted blend of 9 inputs, each scored 0–100. Each bar is that input's sub-score; the figure is the points it added to the 100-point composite (weight × sub-score).
- Cash flow +19.1/30.0
- ARV discount +7.5/15.0
- DSCR +6.0/10.0
- 1% rule +5.2/10.0
- Schools +4.1/10.0
- Livability +4.0/5.0
- Rent growth +2.6/5.0
- Condition / age +2.5/5.0
- Appreciation +0.0/10.0
$259,000
🖨 Deal sheet 📄 Offer letter ✓ Due diligence
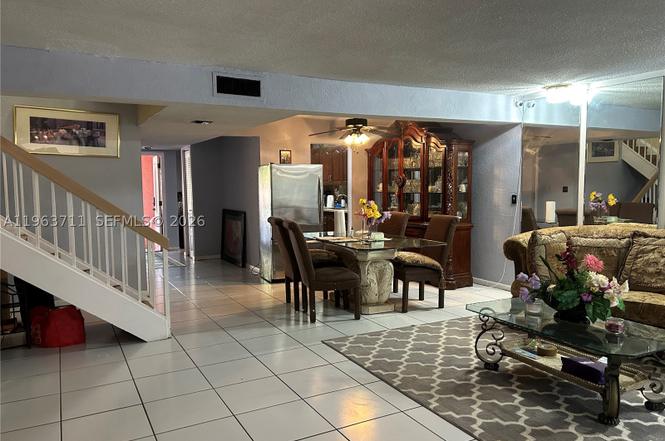
Listing remarks
Rare opportunity for a ~~spacious ~~ townhome at a great price! Step inside this centrally located 2-story townhouse in a welcoming neighborhood. This home offers 3 large bedrooms and 3 full bathrooms, plus a converted garage currently used as a 4th bedroom that can easily be returned to a garage. The large primary suite features space for a home office, an oversized walk-in closet, and a generous bathroom with Roman tub and separate shower. Enjoy granite kitchen countertops, ceramic tile in main living areas, laminate flooring in bedrooms, a wet bar off the living room, and an open living/dining great room. Relax on the screened patio overlooking a spacious backyard. Community amenities in
Key facts
- Screened patio
- Laminate flooring
- Wet bar
Tags
Property features AI
Finance
- Financial info: Pets allowed with restrictions
- HOA & community: Monthly association fee of $255; Association covers recreation facilities, reserve fund, and roof; Community amenities include basketball and tennis courts
Exterior
- Parking: Attached garage; Garage with two or more spaces; 1 covered space
- Home design: Attached property; 2 stories; Entry on level 1
- Construction: Block construction; Resale property
- Exterior features: Balcony; Deck; Open porch/patio
Interior
- Kitchen: Dishwasher; Electric range; Microwave; Refrigerator
- Bedrooms: Primary bedroom on upper level
- Flooring: Laminate; Tile
- Bathrooms: 3 full bathrooms; 1 half bathroom
- Heating & cooling: Central electric air conditioning
- Interior features: Wet bar; Dual sinks; Garden tub / Roman tub; Separate shower; First-floor entry; Main living area on entry level; Upper-level primary bedroom; Unfurnished
- Laundry & utility: Laundry room; Utility room
Neighborhood map
What this means for you Summary
Snapshot
- This is a 3-bed/3.0-bath condo listed at $259k.
Deal economics
- At list price, monthly cash flow is $277 ($3k/yr) — positive.
- The deal already cash-flows at list — no discount required.
- Meets the 1% rule at list price ($3k rent vs $259k).
- Recommended offer: $228k (12.0% below list) — sets the bar for market timing.
- Cap rate 7.6% vs local median 4.3% in Lauderhill — top-decile yield for the area; either an underpriced asset or a hidden risk that comps aren't pricing in. Stress-test before assuming the spread holds.
Location & tenants
- Location reads 79/100 on livability (#139 in FL, #2,059 nationally) — a middle-class / working-renter tenant base. Strengths: commute A+, cost of living A+, housing A+; Watch: schools D, employment D, amenities F.
- Broward (suburban): math 42% / reading 53% proficiency, ranked #46 of 73 in FL (top 63%) — families likely to look elsewhere, expect single-tenant / working-renter base with shorter leases.
- Market conditions: Rents flat; 656 active listings in the ZIP; 40 comparable units currently listed for rent nearby; rentals at typical pace (median 24d on market — plan ~3-4 weeks tenant-placement turnaround); 2,111 units permitted in Broward County in 2024 (1,265 in 5+ unit buildings).
- At $2,645/mo this rent would consume 69% of the median local household income ($46k/yr) (locally 5692% of renters already pay >50% of income on rent) — very limited rent-growth headroom before tenants either downsize or default.
Forward outlook
- Local home prices are declining (-3.0%/yr); year-one equity from $2k of loan paydown is wiped out by about $8k of value loss. Plan a longer hold.
- Broward County population projected at +34% by 2050 — long-run rental-demand tailwind backs the buy-and-hold thesis.
Negotiation context
- It's been on market 127 days — a 12% lower offer ($228k) is reasonable based on typical stale-listing flexibility.
- Current owner paid $85k; list at $259k implies a 205% gain — meaningful room to come down on a strong offer.
Risks & watch-outs
- Climate carrying-cost: severe wind risk, 99% chance of damaging wind over 30y; extreme-heat days projected 7→27/yr by 2055 (HVAC capex compounding) — expect insurance premiums to compound above CPI over the hold.
Questions for the listing agent
- It's been on market 127 days. Have you received any prior offers? Is the seller open to a 12% concession, seller financing, or rate buy-down credit?
- Built in 1974 — when were the roof, HVAC, electrical panel, plumbing, and water heater last replaced?
- What does the HOA fee cover, when was the last increase, and are there any pending special assessments or reserve-fund shortfalls?
- Any open or pending special assessments — roof, HVAC, plumbing, elevator, façade? What's the per-unit balance and payoff schedule, and is the seller paying it off at close or rolling it to the buyer?
- Why hasn't it sold? Are there any deal-killer items the seller is aware of (foundation, flood, title, zoning, code violations)?
- Is there a deadline driving the sale (1031 exchange, divorce, estate, relocation)? That informs how much negotiation room exists.
- Schools are D-rated, which usually means shorter tenancies and higher turnover. Who's the typical renter profile here, and what's been the actual vacancy rate?
- What's the average days-on-market for RENTAL listings here right now (not sales)? A rising rental-DOM trend means longer vacancies and softer asking-rent achievability than the comps imply.
- What's the recent tenant-quality profile in this submarket — average credit score on applications, eviction rate, late-payment / NSF rate, and stable-employment percentage? A property-management company in the area should have these aggregated.
- How much new apartment / multifamily construction is in the pipeline within 1–3 miles? Heavy new supply (>2% of stock underway) typically softens rents 12–24 months out; light construction supports rent growth.
Investment metrics
- 1% rule
- 1.02% ✓
- Cap rate
- 7.58%
- Cash-on-cash
- 4.59%
- DSCR
- 1.20
- GRM
- 8.2
CMA / ARV
No comps found within radius.
Projected returns pro-forma
-3.0% appreciation · 0.26% rent growth · sell at horizon
- IRR
- -12.3%
- Equity multiple
- 0.57×
- Total profit
- $-31,365
- Equity at exit
- $38,618
- IRR
- -8.0%
- Equity multiple
- 0.56×
- Total profit
- $-31,943
- Equity at exit
- $22,394
Cash invested: $72,520 (down + closing). Projections, not guarantees.
Landlord ↔ Tenant lean methodology
- Overall (STATE)
- 87 Strongly Landlord-Friendly
- State Florida
- 87 Strongly Landlord-Friendly · R+3
- County
- — inherits STATE
- City
- — inherits STATE
ZIP-level market 33313
- Rents YoY
- 0.3%
- Active inventory
- 656
- Price-to-rent
- 8.2×
Monthly cashflow live
- Estimated rent
- $2,645 high interval (Pro) →
- Mortgage (P&I)
- −$1,358
- Tax from tax record
- −$92 /mo · $1,099/yr
- Insurance
- −$108
- HOA
- −$255
- Vacancy / Maint / Mgmt
- −$556
- Net cashflow
- $277
Break-even live
UW: 25.0% down · 7.5% · 30yr · 1.5% tax · 5.0% vac · 8.0% maint · 8.0% mgmt
Financing live
Cash to close
- Down payment
- $64,750
- Closing costs
- $7,770
- Reserves months
- —
- Total cash needed
- —
Loan-product check · same deal, 3 products live
Conventional
25% down · 7.5% · 30yr
- Down + closing
- —
- Monthly P&I
- —
- Monthly cashflow
- —
- DSCR
- —
- Eligible?
- —
Personal DTI + credit; lowest rate.
DSCR
20% down · 8.5% · 30yr
- Down + closing
- —
- Monthly P&I
- —
- Monthly cashflow
- —
- DSCR
- —
- Eligible?
- —
No personal income docs; deal must DSCR.
Hard money
10% down · 12.0% · 12mo
- Down + closing
- —
- Monthly P&I
- —
- Monthly cashflow
- —
- DSCR
- —
- Eligible?
- —
Short-term bridge; refi at stabilization.
Rent comps 40 comps
| Address | Beds | Baths | Sqft | Rent | $/sqft | DOM | Units | Dist |
|---|---|---|---|---|---|---|---|---|
| 5861 NW 16th Pl #307 Sunrise, FL | 3.0 | 2.0 | 1321 | $2,500 | $1.89 | 7d | 1 | 0.15mi |
| 5861 NW 16th Pl #307 Sunrise, FL | 3.0 | 2.0 | 1321 | $2,500 | $1.89 | 20d | 1 | 0.15mi |
| 5641 NW 15th St Unit 3 Lauderhill, FL | 2.0 | 1.0 | 2260 | $2,200 | $0.97 | 24d | 1 | 0.15mi |
| 5640 NW 15th St Unit 3 Lauderhill, FL | 2.0 | 1.0 | 2215 | $1,950 | $0.88 | 24d | 1 | 0.18mi |
| 1817 NW 58th Ave #22 Lauderhill, FL | 3.0 | 2.5 | 2100 | $3,190 | $1.52 | 15d | 1 | 0.24mi |
| 5820 NW 14th Ct Unit 1 Lauderhill, FL | 2.0 | 1.0 | 1821 | $1,950 | $1.07 | 24d | 1 | 0.25mi |
| 1815 NW 56th Ter #15 Lauderhill, FL | 3.0 | 2.5 | 2100 | $3,200 | $1.52 | 24d | 1 | 0.26mi |
| 5941 NW 14th Ct Sunrise, FL | 3.0 | 2.0 | 2617 | $3,500 | $1.34 | 4d | 1 | 0.27mi |
| 5941 NW 14th Ct Unit 1 Sunrise, FL | 3.0 | 2.0 | 2617 | $3,500 | $1.34 | 10d | 1 | 0.27mi |
| 5804 NW 14th St Sunrise, FL | 3.0 | 2.0 | 1682 | $3,450 | $2.05 | 24d | 1 | 0.29mi |
| 5971 NW 17th Pl Sunrise, FL | 1.0–3.0 | 1.0–2.0 | 1325 | $2,650 | $2.00 | 14d | 10 | 0.31mi |
| 1788 NW 55th Ave Lauderhill, FL | 3.0 | 2.5 | 1413 | $2,500 | $1.77 | 24d | 1 | 0.33mi |
| 1788 NW 55th Ave #204 Lauderhill, FL | 3.0 | 2.5 | 1249 | $2,400 | $1.92 | 24d | 1 | 0.33mi |
| 1788 NW 55th Ave #203 Lauderhill, FL | 3.0 | 2.5 | 1413 | $2,200 | $1.56 | 24d | 1 | 0.33mi |
| 1801 NW 54th Ter Lauderhill, FL | 3.0 | 2.0 | 1300 | $2,450 | $1.88 | 24d | 1 | 0.34mi |
| 1752 NW 55th Ave #203 Lauderhill, FL | 3.0 | 2.5 | 1249 | $2,700 | $2.16 | 7d | 1 | 0.34mi |
| 1752 NW 55th Ave #203 Lauderhill, FL | 3.0 | 2.5 | 1249 | $2,750 | $2.20 | 24d | 1 | 0.34mi |
| 5400 NW 18th St Unit 3N Lauderhill, FL | 3.0 | 2.0 | 1350 | $2,475 | $1.83 | 24d | 1 | 0.35mi |
| 1848 NW 55th Ave Unit 4X Lauderhill, FL | 3.0 | 2.0 | 1350 | $2,495 | $1.85 | 24d | 1 | 0.36mi |
| 5332 NW 18th St Unit 3-X Lauderhill, FL | 3.0 | 2.0 | 1350 | $2,495 | $1.85 | 24d | 1 | 0.37mi |
| 5300 NW 18th Ct Unit 4I Lauderhill, FL | 3.0 | 2.0 | 1350 | $2,200 | $1.63 | 22d | 1 | 0.42mi |
| 1630 NW 52nd Ave Lauderhill, FL | 2.0 | 1.0 | 2265 | $2,000 | $0.88 | 24d | 1 | 0.44mi |
| 5940 NW 20th St Unit 44 Lauderhill, FL | 2.0 | 1.0 | 2562 | $1,795 | $0.70 | 24d | 1 | 0.47mi |
| 5960 NW 20th St Unit 5960 Lauderhill, FL | 3.0 | 2.0 | 1389 | $2,700 | $1.94 | 7d | 1 | 0.48mi |
| 1101 NW 55th Ave Lauderhill, FL | 4.0 | 2.0 | 2443 | $2,800 | $1.15 | 20d | 1 | 0.53mi |
| 1321 NW 50th Ave Lauderhill, FL | 3.0 | 2.0 | 2030 | $2,700 | $1.33 | 5d | 1 | 0.63mi |
| 2208 NW 63rd Ave Sunrise, FL | 3.0 | 2.0 | 1625 | $3,449 | $2.12 | 24d | 1 | 0.72mi |
| 5844 Blueberry Ct #68 Lauderhill, FL | 4.0 | 2.5 | 1492 | $2,800 | $1.88 | 24d | 1 | 0.79mi |
| 5841 Blueberry Ct #77 Lauderhill, FL | 3.0 | 2.5 | 1428 | $2,500 | $1.75 | 7d | 1 | 0.80mi |
| 5841 Blueberry Ct #77 Lauderhill, FL | 3.0 | 2.5 | 1428 | $2,500 | $1.75 | 24d | 1 | 0.80mi |
| 2240 NW 51st Ave Lauderhill, FL | 2.0 | 2.0 | 1385 | $3,400 | $2.45 | 20d | 1 | 0.85mi |
| 5817 Blueberry Ct #92 Lauderhill, FL | 3.0 | 2.5 | 1298 | $2,450 | $1.89 | 24d | 1 | 0.85mi |
| 5817 Blueberry Ct #92 Lauderhill, FL | 3.0 | 2.5 | 1298 | $2,450 | $1.89 | 7d | 1 | 0.85mi |
| 2240 NW 51st Ave Unit N/A Lauderhill, FL | 4.0 | 3.0 | 1385 | $3,400 | $2.45 | 24d | 1 | 0.86mi |
| 6821-6825 NW 11th Pl Unit 6825 Plantation, FL | 3.0 | 2.0 | 1481 | $2,900 | $1.96 | 11d | 1 | 0.88mi |
| 6856 NW 12th St Plantation, FL | 4.0 | 2.0 | 1600 | $2,850 | $1.78 | 24d | 1 | 0.90mi |
| 6901 W Sunrise Blvd Plantation, FL | 1.0–3.0 | 1.0–2.0 | 1037 | $2,942 | $2.84 | 3d | 42 | 0.94mi |
| 1530 NW 47th Ave Lauderhill, FL | 3.0 | 2.0 | 1439 | $3,000 | $2.08 | 24d | 1 | 0.94mi |
| 5950 NW 25th Pl #233 Sunrise, FL | 4.0 | 2.5 | 1520 | $3,000 | $1.97 | 5d | 1 | 0.95mi |
| 5950 NW 25th Pl #233 Sunrise, FL | 4.0 | 2.5 | 1520 | $3,000 | $1.97 | 14d | 1 | 0.95mi |
HOA detail condo
- Monthly dues
- $255 · $3,060/yr
- Assessments
- None detected in remarks — confirm with the listing agent.
Listing history 17 events
-
2026-06-18days on market $259,000 Active 127 DOM
-
2026-06-17days on market $259,000 Active 126 DOM
-
2026-06-16days on market $259,000 Active 125 DOM
-
2026-06-15days on market $259,000 Active 124 DOM
-
2026-06-13days on market $259,000 Active 122 DOM
-
2026-06-09days on market $259,000 Active 118 DOM
-
2026-06-07statusdays on market $259,000 Active 116 DOM
-
2026-06-04days on market $259,000 Active Under Contract 113 DOM
-
2026-06-03days on market $259,000 Active Under Contract 112 DOM
-
2026-06-02days on market $259,000 Active Under Contract 111 DOM
-
2026-06-02status $259,000 Active Under Contract 110 DOM
-
2026-06-01days on market $259,000 Active 110 DOM
-
2026-05-31days on market $259,000 Active 109 DOM
-
2026-02-11$259,000 Active
-
2002-05-23soldstatus $85,000
-
1992-07-30soldstatus $54,000
-
1973-06-01soldstatus $39,500
ⓘ Source: listings_history table (triggers on properties + properties_extension) + one-shot
backfill from property_details.listing_events for pre-trigger history.
Tax reassessment forecast FL · Resets to sale price
- Current annual tax
- $1,099 · $92/mo
- Projected year-2 tax
- $2,150 · $179/mo
- Expected delta
- +$1,050/yr (+$88/mo · 95.5%)
ⓘ Screening estimate from a state-policy table — verify with the county assessor before closing.
Climate risk First Street
- Flood 1/10 Low FEMA zone X (shaded) · 0% chance over 30 yrs
- Wildfire 1/10 Low
- Heat 10/10 Extreme 7 d/yr ≥105°F today · 27 d/yr by 30 yrs out
- Wind 10/10 Extreme 99% chance of damaging wind over 30 yrs
- Air quality 2/10 Low 2 unhealthy d/yr today · 2 by 30 yrs out
Nearby sold comps map
Loading sold comps map…
Walkable amenities ~0.75 mi
Loading nearby amenities…
Taxation est. · year 1
- Rental income
- $31,745
- − Mortgage interest
- −$14,508
- − Property taxes
- −$1,099
- − Insurance
- −$1,295
- − Repairs & maintenance
- −$2,540
- − Management
- −$2,540
- − HOA
- −$3,060
- − Depreciation
- −$7,535
- Taxable loss
- −$831
- Est. tax savings @ 24.0%
- +$200
- After-tax cash flow
- $3,525/yr
For passive investors: Depreciation is non-cash, so a rental often shows a tax loss while cash-flowing — sheltering income. Rental losses are passive: they offset passive income freely, and up to $25,000/yr can offset ordinary (W-2) income if you actively participate and your MAGI is under $100k (phasing out to $0 by $150k); unused losses carry forward. On sale, claimed depreciation is recaptured at up to 25%, and gains may owe capital-gains tax (a 1031 exchange can defer both). Figures are a year-1 estimate at your 24.0% rate — not tax advice; consult a CPA.
Schools (NCES district)
- District
- Broward
- NCES district ID
- 1200180
- Math proficiency
- 42% ▼ -18.00%
- Reading proficiency
- 53% ▼ -5.00%
- Median HH income
- $52,139
- Composite
- 40.88/100
- National rank
- #3621
- State rank
- #46 of 73 in FL
Livability — Lauderhill
- Score
- 79/100
- State rank
- #139
- US rank
- #2059
Category grades
Schools grade is shown separately in the Schools card above.
Census & demographics
- Census place
- Lauderhill, FL
- County
- Broward County · 1,963,430 people
- City population
- 62,807
- Metro
- Miami-Fort Lauderdale-Pompano Beach, FL
- Population (ZIP)
- 62,807
- Household income
- $46,305
- Rent vs Own
- Severe rent burden
- 5692.0
Population outlook (Broward County) Hauer SSP2
- Today (2025)
- 2,207,033 people
- By 2030
- 2,360,704 · +7.0%
- By 2040
- 2,661,208 · +20.6%
- By 2050
- 2,946,698 · +33.5%
- By 2075
- 3,602,273 · +63.2%
- By 2100
- 3,970,984 · +79.9%
Race, ethnicity, and origin ACS 2023
- Neighborhood character
- Predominantly Black (77%)
- Race & ethnicity
- Black 77% Hispanic / Latino 12% Two or more races 8% White 7% Asian 2%
- Hispanic origin (detail)
- Puerto Rican 2% Cuban 3% Dominican 1%
- Common ancestry
- Hispanic 20%
- Foreign-born
- 39% · Canada, Jamaica, Dominican Republic
- Languages at home
- 66% English-only · French/Haitian/Cajun 22% Spanish 10%
Political lean MEDSL · Broward
- 2024 margin
- D (+17.0) · D 58.0% · R 41.0%
- 2008→2024 swing
- -17.8pp toward R · 2008: 34.7pp · 2024: 17.0pp
- All cycles
- 2024: D+17.0 2020: D+29.8 2016: D+35.0 2012: D+34.9 2008: D+34.7
Not yet ingested
- Civics
- —
Market trends
- HPI YoY
- ▼ -338.15%
- Current HPI
- 288.9345
- Rent YoY
- ▲ 0.26%
- Metro
- Miami-Fort Lauderdale-Pompano Beach, FL
- State GDP YoY
- ▲ 3.28%
- F500 in state
- 36
Industry mix (Fortune 500 HQ in FL)
| Industry | F500 HQs | Revenue |
|---|---|---|
| Industrial Technology | 2 | $29B |
|
||
| Insurance | 2 | $17B |
|
||
| Retail | 1 | $60B |
|
||
| Technology Distribution | 1 | $58B |
|
||
| Homebuilding | 1 | $35B |
|
||
| Technology Manufacturing | 1 | $35B |
|
||
Price history
+555.7% since first listed4 events — show timeline
- 2026-02-11 Listed $259,000 MARMLS
- 2002-05-23 Sold (Public Records) $85,000 Public Records
- 1992-07-30 Sold (Public Records) $54,000 Public Records
- 1973-06-01 Sold (Public Records) $39,500 Public Records
Property tax history
+4.3%/yrLatest (2025): $1,099 · +1.6% YoY. Source: county tax records.
Cash-flow waterfall
monthlySold comps — $/sqft
last 12 mo · ≤1 miLoading sold comps…