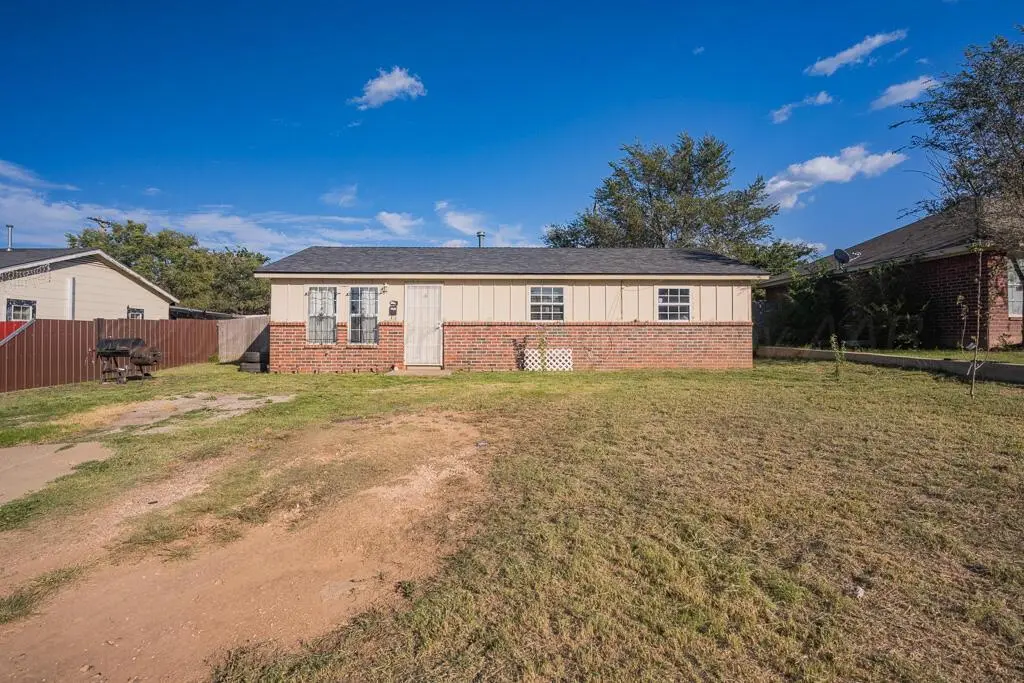
2714 Oak Dr · Amarillo, TX
Flood risk 1/10 · Minimal
- FEMA flood zone
- X (unshaded)
- Chance of flooding over 30 yrs
- 0.0%
- Est. flood insurance / yr
- $507 – $1,088
Fire risk 5/10 · Moderate
- Est. fire insurance / yr
- $1,222 – $2,270
Heat risk 5/10 · Moderate
- Hot days now (above 97°F)
- 7 days/yr
- Hot days in 30 yrs
- 20 days/yr
Wind risk 2/10 · Minimal
- Chance of severe wind over 30 yrs
- —
Air-quality risk 2/10 · Minimal
- Unhealthy air days now
- 1 days/yr
- Unhealthy air days in 30 yrs
- 1 days/yr
Risk factors via First Street. Map © Google.
Why this score? — see what drove the D+ grade
The composite is a weighted blend of 9 inputs, each scored 0–100. Each bar is that input's sub-score; the figure is the points it added to the 100-point composite (weight × sub-score).
- Cash flow +18.6/30.0
- ARV discount +7.5/15.0
- DSCR +5.9/10.0
- 1% rule +5.3/10.0
- Schools +3.6/10.0
- Livability +3.3/5.0
- Rent growth +2.5/5.0
- Condition / age +2.5/5.0
- Appreciation +0.0/10.0
$119,900
🖨 Deal sheet (PDF) 📄 Offer letter ✓ Due diligence
Listing remarks MLS
This 3-bedroom, 2-bath home offers a functional layout with comfortable living space, making it a great option for first-time buyers or an excellent investor opportunity. The home features a practical kitchen, cozy living area, and plenty of potential to personalize and make it your own. Situated on a spacious lot, the large backyard provides plenty of room for outdoor activities, pets, gardening, or future improvements. Whether you're looking for an affordable home to start your homeownership journey or searching for a property with great potential to add to your investment portfolio, this property is worth a look. Schedule your showing today!
Key facts
- Large backyard
- Cozy living area
- Practical kitchen
Tags
Neighborhood map
What this means for you Summary
Snapshot
- This is a 3-bed/2.0-bath single-family listed at $120k.
Deal economics
- At list price, monthly cash flow is $117 ($1k/yr) — positive.
- The deal already cash-flows at list — no discount required.
- Meets the 1% rule at list price ($1k rent vs $120k).
- Recommended offer: $109k (9.0% below list) — sets the bar for market timing.
Location & tenants
- Location reads 66/100 on livability (#624 in TX) — a middle-class / working-renter tenant base. Strengths: cost of living A+, housing A+; Watch: amenities C-, crime F, commute F.
- Amarillo ISD (urban): math 44% / reading 41% proficiency, ranked #336 of 826 in TX (top 41%) — families likely to look elsewhere, expect single-tenant / working-renter base with shorter leases.
- Zoned schools: George Washington Carver Early Childhood Academy (338 students, 68% FRL); Mann Middle (math 36% / reading 29%, grade F, #947 of 1,662 statewide, top 58%, 458 students, 92% FRL); Amtech Career Academy (3 students, 0% FRL) — zoned schools at 54% FRL track the district average.
- Market conditions: 120 active listings in the ZIP; 6 comparable units currently listed for rent nearby; rentals at typical pace (median 23d on market — plan ~3-4 weeks tenant-placement turnaround); lower-income renter base — watch delinquency; 1,214 units permitted in Potter County in 2024 (650 in 5+ unit buildings).
- This rent runs 36% of the median local income ($41k/yr) — at the standard rent-burdened threshold; future hikes will face affordability resistance.
Forward outlook
- Local home prices are declining (-3.0%/yr); year-one equity from $829 of loan paydown is wiped out by about $4k of value loss. Plan a longer hold.
Negotiation context
- It's been on market 105 days — a 9% lower offer ($109k) is reasonable based on typical stale-listing flexibility.
- 2 sale attempts since 3y ago with the ask held roughly flat each time — persistent listings suggest the price (not the market) is what's stuck; bring a comps-based counter.
Risks & watch-outs
- Climate carrying-cost: moderate wildfire risk; extreme-heat days projected 7→20/yr by 2055 (HVAC capex compounding) — expect insurance premiums to compound above CPI over the hold.
Questions for the listing agent
- It's been on market 105 days. Have you received any prior offers? Is the seller open to a 9% concession, seller financing, or rate buy-down credit?
- Why hasn't it sold? Are there any deal-killer items the seller is aware of (foundation, flood, title, zoning, code violations)?
- Is there a deadline driving the sale (1031 exchange, divorce, estate, relocation)? That informs how much negotiation room exists.
- Schools are D-rated, which usually means shorter tenancies and higher turnover. Who's the typical renter profile here, and what's been the actual vacancy rate?
- Crime grade is F in this area — have there been break-ins, vandalism, or insurance claims at this property in the last 3 years? What carrier currently insures it and at what premium?
- The area grade is low — what's the realistic commute time and amenity access for the typical tenant pool here? Any planned neighborhood developments (good or bad) we should know about?
- What's the average days-on-market for RENTAL listings here right now (not sales)? A rising rental-DOM trend means longer vacancies and softer asking-rent achievability than the comps imply.
- What's the recent tenant-quality profile in this submarket — average credit score on applications, eviction rate, late-payment / NSF rate, and stable-employment percentage? A property-management company in the area should have these aggregated.
- How much new for-sale + rental construction is in the pipeline within 1–3 miles? Heavy new supply typically softens prices + rents 12–24 months out; constrained supply supports both.
Investment metrics
- 1% rule
- 1.03% ✓
- Cap rate
- 7.46%
- Cash-on-cash
- 4.17%
- DSCR
- 1.19
- GRM
- 8.1
CMA / ARV
- ARV (median comp)
- $65,000
- List price
- $119,900
- Delta
- 84.46%
- Verdict
- OVERPRICED
- Comps
- 5 within 2.0 mi
Projected returns pro-forma
-3.0% appreciation · 3.0% rent growth · sell at horizon
- IRR
- -9.8%
- Equity multiple
- 0.64×
- Total profit
- $-11,969
- Equity at exit
- $17,877
- IRR
- -0.3%
- Equity multiple
- 0.98×
- Total profit
- $-718
- Equity at exit
- $10,367
Cash invested: $33,572 (down + closing). Projections, not guarantees.
Landlord ↔ Tenant lean methodology
- Overall (STATE)
- 87 Strongly Landlord-Friendly
- State Texas
- 87 Strongly Landlord-Friendly · R+5
- County
- — inherits STATE
- City
- — inherits STATE
ZIP-level market 79107
- Home prices YoY
- -20.9%
- Active inventory
- 120
- Price-to-rent
- 8.1×
Monthly cashflow live
- Estimated rent
- $1,232 high interval (Pro) →
- Mortgage (P&I)
- −$629
- Tax from tax record
- −$178 /mo · $2,133/yr
- Insurance
- −$50
- HOA
- −$0
- Vacancy / Maint / Mgmt
- −$259
- Net cashflow
- $117
Break-even live
Sensitivity live
| Price | -10% $184 | -5% $151 | +0% $117 | +5% $83 | +10% $49 |
|---|---|---|---|---|---|
| Rent | -10% $19 | -5% $68 | +0% $117 | +5% $165 | +10% $214 |
| Rate | -1.0pp $177 | -0.5pp $147 | base $117 | +0.5pp $85 | +1.0pp $54 |
UW: 25.0% down · 7.5% · 30yr · 1.5% tax · 5.0% vac · 8.0% maint · 8.0% mgmt
Financing live
Cash to close
- Down payment
- $29,975
- Closing costs
- $3,597
- Reserves months
- —
- Total cash needed
- —
Loan-product check · same deal, 3 products live
Conventional
25% down · 7.5% · 30yr
- Down + closing
- —
- Monthly P&I
- —
- Monthly cashflow
- —
- DSCR
- —
- Eligible?
- —
Personal DTI + credit; lowest rate.
DSCR
20% down · 8.5% · 30yr
- Down + closing
- —
- Monthly P&I
- —
- Monthly cashflow
- —
- DSCR
- —
- Eligible?
- —
No personal income docs; deal must DSCR.
Hard money
10% down · 12.0% · 12mo
- Down + closing
- —
- Monthly P&I
- —
- Monthly cashflow
- —
- DSCR
- —
- Eligible?
- —
Short-term bridge; refi at stabilization.
Rent comps 6 comps
| Address | Beds | Baths | Sqft | Rent | $/sqft | DOM | Units | Dist |
|---|---|---|---|---|---|---|---|---|
| 2800 Redwood St Amarillo, TX | 3.0 | 1.0 | 926 | $1,350 | $1.46 | 45d | 1 | 0.12mi |
| 509 Jason Ave Amarillo, TX | 1.0–2.0 | 1.0–2.0 | 931 | $962 | $1.03 | 14d | 1 | 0.43mi |
| 2904 N Mirror St Amarillo, TX | 2.0 | 1.0 | 608 | $1,050 | $1.73 | 23d | 1 | 0.54mi |
| 4005 Hilltop Dr Apt C Amarillo, TX | 2.0 | 1.0 | 784 | $850 | $1.08 | 23d | 1 | 0.82mi |
| 4005 Hilltop Dr Apt D Amarillo, TX | 3.0 | 2.0 | 924 | $1,250 | $1.35 | 23d | 1 | 0.82mi |
| 1819 Darden St Amarillo, TX | 3.0 | 1.0 | 1114 | $1,095 | $0.98 | 45d | 1 | 1.32mi |
Listing history 31 events
-
2026-06-21days on market $119,900 Active 105 DOM
-
2026-06-18days on market $119,900 Active 102 DOM
-
2026-06-17days on market $119,900 Active 101 DOM
-
2026-06-16days on market $119,900 Active 100 DOM
-
2026-06-15days on market $119,900 Active 99 DOM
-
2026-06-14days on market $119,900 Active 97 DOM
-
2026-06-13days on market $119,900 Active 96 DOM
-
2026-06-10days on market $119,900 Active 94 DOM
-
2026-06-09days on market $119,900 Active 93 DOM
-
2026-06-08days on market $119,900 Active 92 DOM
-
2026-06-07days on market $119,900 Active 91 DOM
-
2026-06-03days on market $119,900 Active 87 DOM
-
2026-06-02days on market $119,900 Active 86 DOM
-
2026-06-01days on market $119,900 Active 85 DOM
-
2026-05-31days on market $119,900 Active 84 DOM
-
2026-05-30days on market $119,900 Active 83 DOM
-
2026-03-09$119,900 Active 652-char remark
Show marketing remark (652 chars)
This 3-bedroom, 2-bath home offers a functional layout with comfortable living space, making it a great option for first-time buyers or an excellent investor opportunity. The home features a practical kitchen, cozy living area, and plenty of potential to personalize and make it your own. Situated on a spacious lot, the large backyard provides plenty of room for outdoor activities, pets, gardening, or future improvements. Whether you're looking for an affordable home to start your homeownership journey or searching for a property with great potential to add to your investment portfolio, this property is worth a look. Schedule your showing today!
-
2025-12-19price $119,900
-
2025-10-20price $125,000
-
2024-04-25soldstatus
-
2024-04-24soldstatus Closed
-
2024-04-09status Pending
-
2024-03-30historical Active Under Contract
-
2024-03-21price $94,900
-
2024-02-19price $99,900
-
2024-02-06price $109,500
-
2023-10-24$119,500 Active
-
2012-04-30soldstatus
-
2007-08-02soldstatus
-
2005-02-03soldstatus
-
2004-11-02soldstatus
ⓘ Source: listings_history table (triggers on properties + properties_extension) + one-shot
backfill from property_details.listing_events for pre-trigger history.
Tax reassessment forecast TX · Resets to sale price
- Current annual tax
- $2,133 · $178/mo
- Projected year-2 tax
- $2,194 · $183/mo
- Expected delta
- +$61/yr (+$5/mo · 2.9%)
ⓘ Screening estimate from a state-policy table — verify with the county assessor before closing.
Climate risk First Street
- Flood 1/10 Low FEMA zone X (unshaded) · 0% chance over 30 yrs
- Wildfire 5/10 Major
- Heat 5/10 Major 7 d/yr ≥97°F today · 20 d/yr by 30 yrs out
- Wind 2/10 Low
- Air quality 2/10 Low 1 unhealthy d/yr today · 1 by 30 yrs out
Nearby sold comps map
Loading sold comps map…
Walkable amenities ~0.75 mi
Loading nearby amenities…
Taxation est. · year 1
- Rental income
- $14,781
- − Mortgage interest
- −$6,716
- − Property taxes
- −$2,133
- − Insurance
- −$600
- − Repairs & maintenance
- −$1,182
- − Management
- −$1,182
- − Depreciation
- −$3,488
- Taxable loss
- −$521
- Est. tax savings @ 24.0%
- +$125
- After-tax cash flow
- $1,524/yr
For passive investors: Depreciation is non-cash, so a rental often shows a tax loss while cash-flowing — sheltering income. Rental losses are passive: they offset passive income freely, and up to $25,000/yr can offset ordinary (W-2) income if you actively participate and your MAGI is under $100k (phasing out to $0 by $150k); unused losses carry forward. On sale, claimed depreciation is recaptured at up to 25%, and gains may owe capital-gains tax (a 1031 exchange can defer both). Figures are a year-1 estimate at your 24.0% rate — not tax advice; consult a CPA.
Schools (NCES district)
- District
- Amarillo ISD
- NCES district ID
- 4808130
- Math proficiency
- 44% ▼ -9.00%
- Reading proficiency
- 41% ▼ -3.00%
- Median HH income
- $43,478
- Composite
- 35.96/100
- National rank
- #4798
- State rank
- #336 of 826 in TX
Livability — Amarillo
- Score
- 66/100
- State rank
- #624
- US rank
- #11876
Category grades
Schools grade is shown separately in the Schools card above.
Census & demographics
- Census place
- Amarillo, TX
- County
- Potter County · 72,216 people
- City population
- 185,802
- Metro
- Amarillo, TX
- Population (ZIP)
- 36,662
- Household income
- $40,671
- Rent vs Own
- Severe rent burden
- 1019.0
Population outlook (Potter County) Hauer SSP2
- Today (2025)
- 121,296 people
- By 2030
- 120,883 · -0.3%
- By 2040
- 119,668 · -1.3%
- By 2050
- 117,788 · -2.9%
- By 2075
- 110,250 · -9.1%
- By 2100
- 92,923 · -23.4%
Race, ethnicity, and origin ACS 2023
- Neighborhood character
- Diverse neighborhood (Simpson 0.70)
- Race & ethnicity
- Hispanic / Latino 45% Black 25% Two or more races 17% White 16% Asian 10%
- Hispanic origin (detail)
- Mexican 41%
- Common ancestry
- Ukrainian 1% Lithuanian 1%
- Foreign-born
- 27% · Canada, Philippines, Vietnam
- Languages at home
- 50% English-only · Spanish 35% Other Asian/Pacific 7% Vietnamese 2%
Political lean MEDSL · Potter
- 2024 margin
- Solid R (+44.4) · D 27.3% · R 71.7% · Other 1.1%
- 2008→2024 swing
- -5.0pp toward R · 2008: -39.4pp · 2024: -44.4pp
- All cycles
- 2024: R+44.4 2020: R+38.7 2016: R+41.9 2012: R+44.6 2008: R+39.4
Not yet ingested
- Civics
- —
Market trends
- HPI YoY
- ▼ -57.01%
- Current HPI
- 215.7976
- Rent YoY
- —
- Metro
- Amarillo, TX
- State GDP YoY
- ▲ 3.95%
- F500 in state
- 110
Industry mix (Fortune 500 HQ in TX)
| Industry | F500 HQs | Revenue |
|---|---|---|
| Energy | 16 | $1,198B |
|
||
| Technology | 5 | $198B |
|
||
| Engineering / Construction | 4 | $72B |
|
||
| Energy Services | 3 | $60B |
|
||
| Utilities | 3 | $41B |
|
||
| Healthcare | 2 | $330B |
|
||
Price history
+0.3% since first listed15 events — show timeline
- 2026-03-09 Listed $119,900 AARMLS
- 2025-12-19 Price Changed $119,900 AARMLS
- 2025-10-20 Price Changed $125,000 AARMLS
- 2024-04-25 Sold (Public Records) — Public Records
- 2024-04-24 Sold (MLS) — AARMLS
- 2024-04-09 Pending — AARMLS
- 2024-03-30 Contingent — AARMLS
- 2024-03-21 Price Changed $94,900 AARMLS
- 2024-02-19 Price Changed $99,900 AARMLS
- 2024-02-06 Price Changed $109,500 AARMLS
- 2023-10-24 Listed $119,500 AARMLS
- 2012-04-30 Sold (Public Records) — Public Records
- 2007-08-02 Sold (Public Records) — Public Records
- 2005-02-03 Sold (Public Records) — Public Records
- 2004-11-02 Sold (Public Records) — Public Records
Property tax history
+7.4%/yrLatest (2025): $2,133 · -0.3% YoY. Source: county tax records.
Cash-flow waterfall
monthlySold comps — $/sqft
last 12 mo · ≤1 miLoading sold comps…