6978 Paul Howard Dr · Jacksonville, FL
Flood risk 1/10 · Minimal
- FEMA flood zone
- X (unshaded)
- Chance of flooding over 30 yrs
- 0.0%
- Est. flood insurance / yr
- $507 – $1,088
Fire risk 5/10 · Moderate
- Est. fire insurance / yr
- $947 – $1,759
Heat risk 8/10 · Major
- Hot days now (above 107°F)
- 7 days/yr
- Hot days in 30 yrs
- 20 days/yr
Wind risk 10/10 · Severe
- Chance of severe wind over 30 yrs
- 99.0%
Air-quality risk 3/10 · Minor
- Unhealthy air days now
- 3 days/yr
- Unhealthy air days in 30 yrs
- 4 days/yr
Risk factors via First Street. Map © Google.
Why this score? — see what drove the B- grade
The composite is a weighted blend of 9 inputs, each scored 0–100. Each bar is that input's sub-score; the figure is the points it added to the 100-point composite (weight × sub-score).
- Cash flow +23.7/30.0
- ARV discount +15.0/15.0
- DSCR +7.6/10.0
- 1% rule +5.5/10.0
- Livability +4.2/5.0
- Schools +3.9/10.0
- Rent growth +3.2/5.0
- Condition / age +2.5/5.0
- Appreciation +0.0/10.0
$175,000
🖨 Deal sheet 📄 Offer letter ✓ Due diligence
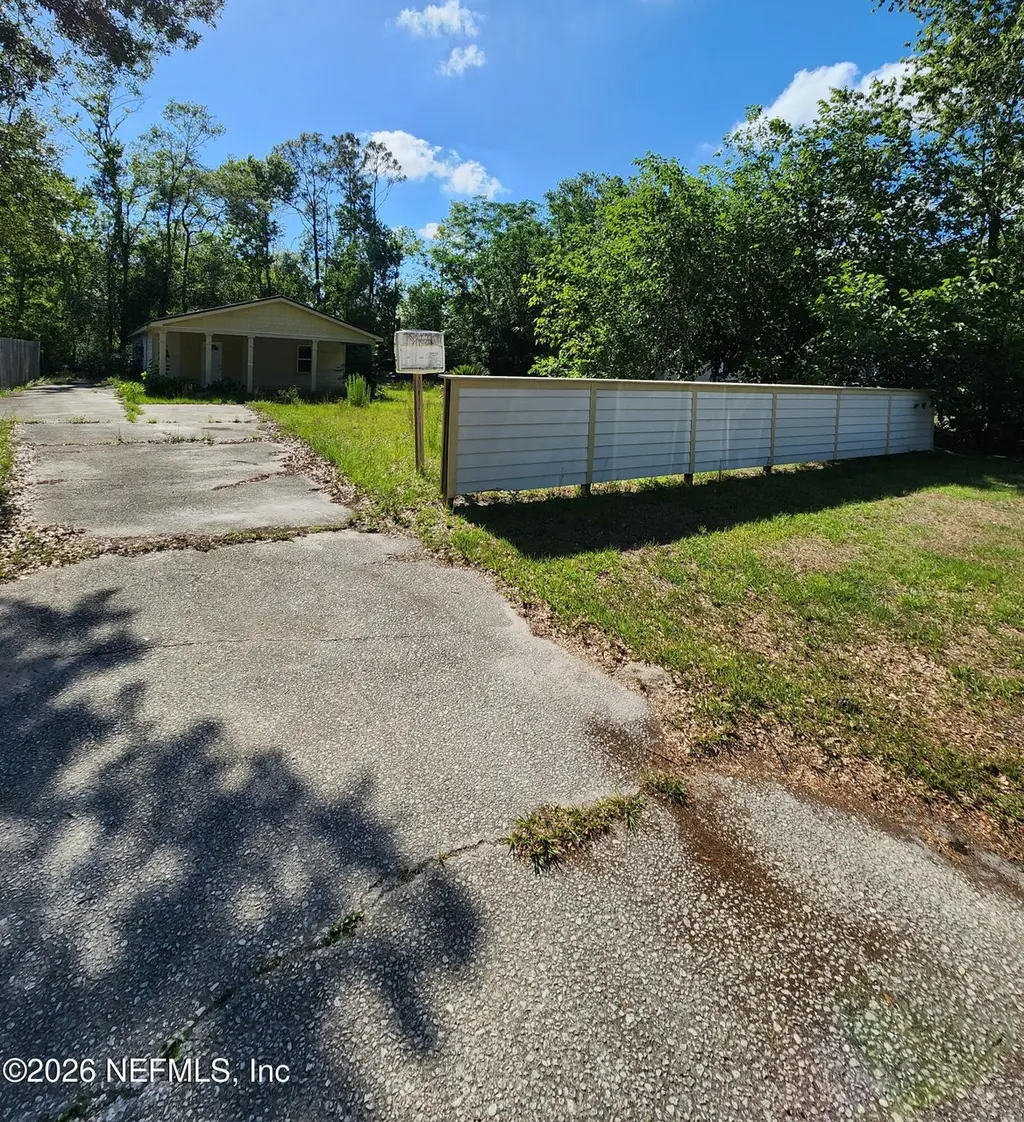
Listing remarks
Attention investors and cash buyers! Great opportunity to complete and customize this property to your vision. The project is partially completed and offers excellent potential for investment. Excellent opportunity for someone looking to add value and finish the work already started. Conveniently located in Jacksonville with easy access to shopping, dining, and major roads. Property is being sold as-is.
Key facts
- 0.24 acre lot
- Built 1986
- Listed 30 days
Property features AI
Exterior
- Parking: Other parking type
- Utilities: Sewer: unknown; Other utilities listed
- Home design: Single family home; One story; Residential use
- Construction: Frame construction
- Exterior features: City street frontage; Asphalt road surface; Lot of about 0.24 acres
Interior
- Bedrooms: 3 bedrooms
- Bathrooms: 2 full bathrooms
- Heating & cooling: No heating system listed; No cooling system listed
- Interior features: No fireplaces; No built-in appliances listed
Neighborhood map
What this means for you Summary
Snapshot
- This is a 3-bed/2.0-bath single-family listed at $175k.
Deal economics
- At list price, monthly cash flow is $334 ($4k/yr) — positive.
- The deal already cash-flows at list — no discount required.
- Meets the 1% rule at list price ($2k rent vs $175k).
- Recommended offer: $172k (1.5% below list) — sets the bar for market timing.
- Cap rate 8.6% vs local median 4.0% in Jacksonville — top-decile yield for the area; either an underpriced asset or a hidden risk that comps aren't pricing in. Stress-test before assuming the spread holds.
Location & tenants
- Location reads 83/100 on livability (#50 in FL, #911 nationally) — a professional / high-income tenant draw. Strengths: amenities A+, commute A+, housing A+.
- Duval (urban): math 46% / reading 45% proficiency, ranked #48 of 73 in FL (top 66%) — families likely to look elsewhere, expect single-tenant / working-renter base with shorter leases.
- Market conditions: Rents rising (+2.6%/yr); 137 active listings in the ZIP; 16 comparable units currently listed for rent nearby; rentals leasing fast (median 14d on market — plan ~1-2 weeks tenant-placement turnaround); solid renter incomes; 6,503 units permitted in Duval County in 2024 (1,131 in 5+ unit buildings).
Forward outlook
- Local home prices are declining (-3.0%/yr); year-one equity from $1k of loan paydown is wiped out by about $5k of value loss. Plan a longer hold.
- Duval County population projected at +19% by 2050 — long-run rental-demand tailwind backs the buy-and-hold thesis.
Negotiation context
- It's been on market 30 days — a 2% lower offer ($172k) is reasonable based on typical stale-listing flexibility.
- 2 sale attempts since 8y ago; this cycle's ask has dropped $10k (5%) from the opening price — seller is motivated, your offer sets the floor, not the list.
- Current owner paid $55k; list at $175k implies a 218% gain — meaningful room to come down on a strong offer.
Risks & watch-outs
- Climate carrying-cost: severe wind risk, 99% chance of damaging wind over 30y; moderate wildfire risk; extreme-heat days projected 7→20/yr by 2055 (HVAC capex compounding) — expect insurance premiums to compound above CPI over the hold.
Questions for the listing agent
- Is there a deadline driving the sale (1031 exchange, divorce, estate, relocation)? That informs how much negotiation room exists.
- Schools are B-rated — typically a magnet for longer-tenancy family renters. What's the average tenant stay here, and is there a school-zone premium baked into asking?
- What's the average days-on-market for RENTAL listings here right now (not sales)? A rising rental-DOM trend means longer vacancies and softer asking-rent achievability than the comps imply.
- What's the recent tenant-quality profile in this submarket — average credit score on applications, eviction rate, late-payment / NSF rate, and stable-employment percentage? A property-management company in the area should have these aggregated.
- How much new for-sale + rental construction is in the pipeline within 1–3 miles? Heavy new supply typically softens prices + rents 12–24 months out; constrained supply supports both.
Investment metrics
- 1% rule
- 1.05% ✓
- Cap rate
- 8.58%
- Cash-on-cash
- 8.17%
- DSCR
- 1.36
- GRM
- 8.0
CMA / ARV
- ARV (on-the-fly)
- $245,856
- Comps found
- 12
Show comp detail 12 sales within ~0.75 mi
| Address | Dist | Beds/Ba | Sqft | Sold | Price | $/sf | Match |
|---|---|---|---|---|---|---|---|
| 6993 Huntington Woods Cir W | 0.23mi | 3/2.0 | 1,226 (-2%) | 8mo | $220,000 | $179 | 80 |
| 7218 Camfield St | 0.35mi | 3/2.0 | 1,198 (-4%) | 6mo | $199,900 | $167 | 72 |
| 7146 Catina Ct | 0.64mi | 3/2.0 | 1,211 (-3%) | 4mo | $267,500 | $221 | 62 |
| 7162 Catina Ct | 0.65mi | 3/2.0 | 1,192 (-4%) | 4mo | $210,000 | $176 | 59 |
| 9205 Brandi Ct | 0.61mi | 3/2.0 | 1,266 (+1%) | 14mo | $250,000 | $197 | 58 |
| 9268 Hipps Rd | 0.70mi | 2/1.0 (-1) | 1,235 (-1%) | 2mo | $275,000 | $223 | 55 |
| 7000 Huntington Woods Cir E | 0.27mi | 3/2.0 | 1,119 (-10%) | 20mo | $270,000 | $241 | 54 |
| 7227 Bunion Dr | 0.36mi | 3/2.0 | 1,112 (-11%) | 14mo | $240,000 | $216 | 53 |
| 7149 Loves Dr | 0.58mi | 3/2.0 | 1,420 (+14%) | 2mo | $265,000 | $187 | 48 |
| 7146 Loves Dr | 0.58mi | 3/2.0 | 1,368 (+10%) | 14mo | $264,000 | $193 | 45 |
| 7133 Loves Dr | 0.54mi | 3/2.0 | 1,421 (+14%) | 11mo | $300,000 | $211 | 43 |
| 9115 Hipps Rd | 0.38mi | 4/2.0 (+1) | 1,415 (+13%) | 16mo | $230,000 | $163 | 42 |
Match score weights: distance 35% · size 25% · config 20% · recency 20%. Top-matched comps best support the ARV.
Projected returns pro-forma
-3.0% appreciation · 2.62% rent growth · sell at horizon
- IRR
- -4.3%
- Equity multiple
- 0.84×
- Total profit
- $-7,842
- Equity at exit
- $26,093
- IRR
- 5.0%
- Equity multiple
- 1.36×
- Total profit
- $17,557
- Equity at exit
- $15,131
Cash invested: $49,000 (down + closing). Projections, not guarantees.
Landlord ↔ Tenant lean methodology
- Overall (STATE)
- 87 Strongly Landlord-Friendly
- State Florida
- 87 Strongly Landlord-Friendly · R+3
- County
- — inherits STATE
- City
- — inherits STATE
ZIP-level market 32222
- Home prices YoY
- -20.0%
- Rents YoY
- 2.6%
- Active inventory
- 137
- Price-to-rent
- 8.0×
Monthly cashflow live
- Estimated rent
- $1,831 high interval (Pro) →
- Mortgage (P&I)
- −$918
- Tax from tax record
- −$122 /mo · $1,466/yr
- Insurance
- −$73
- HOA
- −$0
- Vacancy / Maint / Mgmt
- −$384
- Net cashflow
- $334
Break-even live
UW: 25.0% down · 7.5% · 30yr · 1.5% tax · 5.0% vac · 8.0% maint · 8.0% mgmt
Financing live
Cash to close
- Down payment
- $43,750
- Closing costs
- $5,250
- Reserves months
- —
- Total cash needed
- —
Loan-product check · same deal, 3 products live
Conventional
25% down · 7.5% · 30yr
- Down + closing
- —
- Monthly P&I
- —
- Monthly cashflow
- —
- DSCR
- —
- Eligible?
- —
Personal DTI + credit; lowest rate.
DSCR
20% down · 8.5% · 30yr
- Down + closing
- —
- Monthly P&I
- —
- Monthly cashflow
- —
- DSCR
- —
- Eligible?
- —
No personal income docs; deal must DSCR.
Hard money
10% down · 12.0% · 12mo
- Down + closing
- —
- Monthly P&I
- —
- Monthly cashflow
- —
- DSCR
- —
- Eligible?
- —
Short-term bridge; refi at stabilization.
Rent comps 16 comps
| Address | Beds | Baths | Sqft | Rent | $/sqft | DOM | Units | Dist |
|---|---|---|---|---|---|---|---|---|
| 8903 Hipps Rd Jacksonville, FL | 2.0 | 1.0 | 935 | $1,400 | $1.50 | 23d | 1 | 0.21mi |
| 7529 Falcon Trace Dr W Jacksonville, FL | 3.0 | 2.0 | 1484 | $1,850 | $1.25 | 2d | 1 | 1.00mi |
| 7573 Falcon Trace Ct Jacksonville, FL | 3.0 | 2.0 | 1385 | $1,750 | $1.26 | 13d | 1 | 1.12mi |
| 8326 Walden Rd E Jacksonville, FL | 3.0 | 2.0 | 1020 | $1,515 | $1.49 | 2d | 1 | 1.15mi |
| 8368 Geoffrey Ct Jacksonville, FL | 3.0 | 1.5 | 1104 | $1,730 | $1.57 | 23d | 1 | 1.19mi |
| 7650 Dover Cliff Dr S Jacksonville, FL | 3.0 | 2.0 | 1248 | $1,880 | $1.51 | 4d | 1 | 1.19mi |
| 7540 Collins Ct Jacksonville, FL | 3.0 | 2.0 | 1472 | $1,785 | $1.21 | 23d | 1 | 1.23mi |
| 8144 Colonnade Ct W Jacksonville, FL | 3.0 | 2.5 | 1307 | $1,745 | $1.34 | 23d | 1 | 1.25mi |
| 7539 Walden Rd E Jacksonville, FL | 3.0 | 2.0 | 956 | $1,850 | $1.94 | 7d | 1 | 1.30mi |
| 8137 Leafcrest Dr Jacksonville, FL | 3.0 | 2.0 | 1427 | $1,855 | $1.30 | 7d | 1 | 1.36mi |
| 8522 Sugartree Dr Jacksonville, FL | 3.0 | 2.0 | 1437 | $1,895 | $1.32 | 3d | 1 | 1.38mi |
| 8131 Cumberland Gap Trl Jacksonville, FL | 3.0 | 2.0 | 1298 | $1,624 | $1.25 | 14d | 1 | 1.40mi |
| 8077 Cumberland Gap Trl Jacksonville, FL | 3.0 | 2.5 | 1307 | $1,750 | $1.34 | 23d | 1 | 1.41mi |
| 8472 Fury Dr Jacksonville, FL | 4.0 | 2.0 | 1326 | $1,780 | $1.34 | 23d | 1 | 1.44mi |
| 7952 118th St Jacksonville, FL | 4.0 | 2.5 | 1407 | $1,895 | $1.35 | 10d | 1 | 1.48mi |
| 7952 118th St Jacksonville, FL | 4.0 | 2.5 | 1407 | $1,895 | $1.35 | 7d | 1 | 1.48mi |
Listing history 20 events
-
2026-06-18days on market $175,000 Active 30 DOM
-
2026-06-17days on market $175,000 Active 29 DOM
-
2026-06-16days on market $175,000 Active 28 DOM
-
2026-06-15days on market $175,000 Active 27 DOM
-
2026-06-13days on market $175,000 Active 25 DOM
-
2026-06-13days on market $175,000 Active 24 DOM
-
2026-06-10pricedays on market $175,000 Active 21 DOM
-
2026-06-08days on market $185,000 Active 20 DOM
-
2026-06-07days on market $185,000 Active 19 DOM
-
2026-06-05days on market $185,000 Active 16 DOM
-
2026-06-03days on market $185,000 Active 15 DOM
-
2026-06-02days on market $185,000 Active 14 DOM
-
2026-06-01days on market $185,000 Active 13 DOM
-
2026-05-31days on market $185,000 Active 12 DOM
-
2026-05-15$185,000 Active
-
2020-08-13soldstatus $55,000
-
2018-12-24status Pending
-
2018-12-24historical
-
2018-12-22price $39,900
-
2018-12-13$49,900 Active
ⓘ Source: listings_history table (triggers on properties + properties_extension) + one-shot
backfill from property_details.listing_events for pre-trigger history.
Tax reassessment forecast FL · Resets to sale price
- Current annual tax
- $1,466 · $122/mo
- Projected year-2 tax
- $1,466 · $122/mo
- Expected delta
- $0/yr ($0/mo · 0.0%)
ⓘ Screening estimate from a state-policy table — verify with the county assessor before closing.
Climate risk First Street
- Flood 1/10 Low FEMA zone X (unshaded) · 0% chance over 30 yrs
- Wildfire 5/10 Major
- Heat 8/10 Severe 7 d/yr ≥107°F today · 20 d/yr by 30 yrs out
- Wind 10/10 Extreme 99% chance of damaging wind over 30 yrs
- Air quality 3/10 Moderate 3 unhealthy d/yr today · 4 by 30 yrs out
Nearby sold comps map
Loading sold comps map…
Walkable amenities ~0.75 mi
Loading nearby amenities…
Taxation est. · year 1
- Rental income
- $21,970
- − Mortgage interest
- −$9,803
- − Property taxes
- −$1,466
- − Insurance
- −$875
- − Repairs & maintenance
- −$1,758
- − Management
- −$1,758
- − Depreciation
- −$5,091
- Taxable income
- $1,220
- Est. tax owed @ 24.0%
- −$293
- After-tax cash flow
- $3,710/yr
For passive investors: Depreciation is non-cash, so a rental often shows a tax loss while cash-flowing — sheltering income. Rental losses are passive: they offset passive income freely, and up to $25,000/yr can offset ordinary (W-2) income if you actively participate and your MAGI is under $100k (phasing out to $0 by $150k); unused losses carry forward. On sale, claimed depreciation is recaptured at up to 25%, and gains may owe capital-gains tax (a 1031 exchange can defer both). Figures are a year-1 estimate at your 24.0% rate — not tax advice; consult a CPA.
Schools (NCES district)
- District
- Duval
- NCES district ID
- 1200480
- Math proficiency
- 46% ▼ -11.00%
- Reading proficiency
- 45% ▼ -4.00%
- Median HH income
- $48,987
- Composite
- 38.97/100
- National rank
- #4076
- State rank
- #48 of 73 in FL
Livability — Jacksonville
- Score
- 83/100
- State rank
- #50
- US rank
- #911
Category grades
Schools grade is shown separately in the Schools card above.
Census & demographics
- Census place
- Jacksonville, FL
- County
- Duval County · 1,015,274 people
- City population
- 979,034
- Metro
- Jacksonville, FL
- Population (ZIP)
- 18,258
- Household income
- $85,649
- Rent vs Own
- Severe rent burden
- 666.0
Population outlook (Duval County) Hauer SSP2
- Today (2025)
- 1,013,010 people
- By 2030
- 1,059,228 · +4.6%
- By 2040
- 1,141,439 · +12.7%
- By 2050
- 1,205,258 · +19.0%
- By 2075
- 1,324,282 · +30.7%
- By 2100
- 1,319,620 · +30.3%
Race, ethnicity, and origin ACS 2023
- Neighborhood character
- Highly diverse neighborhood (Simpson 0.70)
- Race & ethnicity
- White 39% Black 34% Hispanic / Latino 16% Two or more races 8% Asian 3%
- Hispanic origin (detail)
- Mexican 1% Puerto Rican 6% Cuban 2% Dominican 1%
- Common ancestry
- Italian 2% Iranian 1% Romanian 1%
- Foreign-born
- 13% · Canada, Vietnam
- Languages at home
- 83% English-only · Spanish 12% Tagalog/Filipino 3% Other Asian/Pacific 1%
Political lean MEDSL · Duval
- 2024 margin
- Toss-up / Even · D 48.7% · R 50.1% · Other 1.2%
- 2008→2024 swing
- +0.4pp no change · 2008: -1.9pp · 2024: -1.5pp
- All cycles
- 2024: R+1.5 2020: D+3.8 2016: R+1.5 2012: R+3.6 2008: R+1.9
Not yet ingested
- Civics
- —
Market trends
- HPI YoY
- ▼ -64.56%
- Current HPI
- 257.6466
- Rent YoY
- ▲ 2.62%
- Metro
- Jacksonville, FL
- State GDP YoY
- ▲ 3.28%
- F500 in state
- 36
Industry mix (Fortune 500 HQ in FL)
| Industry | F500 HQs | Revenue |
|---|---|---|
| Industrial Technology | 2 | $29B |
|
||
| Insurance | 2 | $17B |
|
||
| Retail | 1 | $60B |
|
||
| Technology Distribution | 1 | $58B |
|
||
| Homebuilding | 1 | $35B |
|
||
| Technology Manufacturing | 1 | $35B |
|
||
Price history
+270.7% since first listed6 events — show timeline
- 2026-05-15 Listed $185,000 realMLS
- 2020-08-13 Sold (Public Records) $55,000 Public Records
- 2018-12-24 Pending — realMLS
- 2018-12-24 Listing Removed — realMLS
- 2018-12-22 Price Changed $39,900 realMLS
- 2018-12-13 Listed $49,900 realMLS
Property tax history
+5.8%/yrLatest (2025): $1,466 · +20.9% YoY. Source: county tax records.
Cash-flow waterfall
monthlySold comps — $/sqft
last 12 mo · ≤1 miLoading sold comps…