8733 Hidden Meadow Dr · Edmond, OK
Flood risk No data
- FEMA flood zone
- —
- Chance of flooding over 30 yrs
- —
- Est. flood insurance / yr
- —
Fire risk No data
- Est. fire insurance / yr
- —
Heat risk No data
- Hot days now (above threshold)
- —
- Hot days in 30 yrs
- —
Wind risk No data
- Chance of severe wind over 30 yrs
- —
Air-quality risk No data
- Unhealthy air days now
- —
- Unhealthy air days in 30 yrs
- —
Risk factors via First Street. Map © Google.
Why this score? — see what drove the D- grade
The composite is a weighted blend of 9 inputs, each scored 0–100. Each bar is that input's sub-score; the figure is the points it added to the 100-point composite (weight × sub-score).
- Appreciation +10.0/10.0
- ARV discount +8.8/15.0
- Cash flow +6.1/30.0
- Livability +3.9/5.0
- Schools +3.6/10.0
- Rent growth +2.5/5.0
- Condition / age +2.5/5.0
- 1% rule +1.5/10.0
- DSCR +0.5/10.0
$565,065
🖨 Deal sheet 📄 Offer letter ✓ Due diligence
Listing remarks
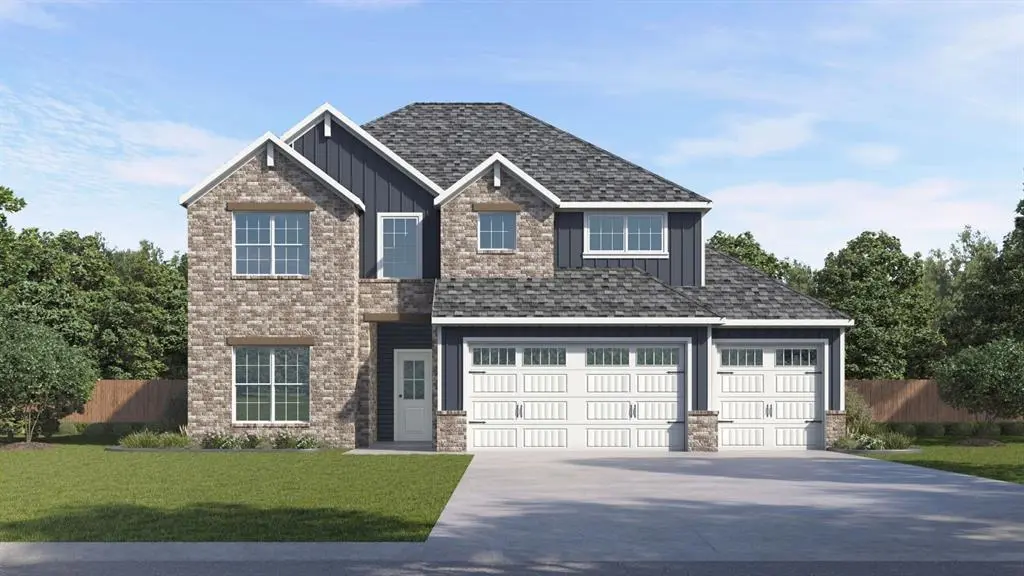
Sophisticated design meets spacious living in The Magnolia by D. R. Horton, located in the highly sought-after Woodland Park community of Edmond. This impressive two-story new construction home offers approximately 3,095 square feet, featuring 5 bedrooms, 4 bathrooms, and a 3-car garage, thoughtfully designed for comfort, functionality, and entertaining. The expansive layout provides generous living areas with seamless flow, ideal for hosting gatherings while still offering private retreats throughout the home. Multiple bedrooms and flexible spaces allow for guest accommodations, home office use, or multi-generational living. The well-appointed primary suite offers a relaxing escape, while
Key facts
- 9,100 sq ft lot
- 3 garage spots
- Community pool
Property features AI
Finance
- Other: Home warranty included
- Financial info: Conventional loans qualify (loan qualification: Yes); Not assumable
- HOA & community: Mandatory association dues; Annual association fee of $750; Association covers common area maintenance, pool, and recreation facility
Exterior
- Parking: Concrete parking; 3-car garage
- Utilities: Cable available; Electricity available; Natural gas available; High-speed internet available; Public utilities
- Home design: Two-story single family home; Residential property; Under construction (estimated completion 2026-08-15)
- Construction: Brick and frame construction; Composition roof; Post-tension foundation; Built by D.R. Horton
- Exterior features: Covered patio; Covered porch; Interior lot
Interior
- Kitchen: Dishwasher; Garbage disposal; Microwave; Gas range/oven
- Bedrooms: 5 bedrooms
- Flooring: Carpet; Vinyl
- Bathrooms: 4 full bathrooms
- Interior features: Blown fiberglass insulation; Smart home features; Smoke alarms; Tankless hot water; Inside utility
- Laundry & utility: Inside utility
Neighborhood map
What this means for you Summary
Snapshot
- This is a 5-bed/4.0-bath single-family listed at $565k.
Deal economics
- At list price, monthly cash flow is $-1k ($-13k/yr) — negative.
- To cash-flow at today's rent, offer at most $413k (26.9% below list).
- To meet the 1% rule (rent ≥ 1% of price), the offer needs to be $369k (34.7% below list).
- Recommended offer: $369k (34.7% below list) — sets the bar for 1% rule.
Location & tenants
- Location reads 78/100 on livability (#6 in OK, #2,383 nationally) — a middle-class / working-renter tenant base. Strengths: employment A+, housing A+, crime A-; Watch: health & safety C-, commute F.
- Edmond (suburban): math 38% / reading 40% proficiency, ranked #11 of 270 in OK (top 4%) — families likely to look elsewhere, expect single-tenant / working-renter base with shorter leases.
- Zoned schools: Redbud Es (616 students, 0% FRL); Memorial Hs (math 44% / reading 56%, grade D+, #4 of 447 statewide, top 1%, 2,605 students, 0% FRL) — zoned schools average 0% FRL vs 22% district-wide (22 pts lower); this property's tenant base skews higher-income than the district average.
- Market conditions: 192 active listings in the ZIP; 2 comparable units currently listed for rent nearby; 5,365 units permitted in Oklahoma County in 2024 (569 in 5+ unit buildings).
Forward outlook
- In year one you build about $60k of equity ($4k loan paydown + $57k appreciation (10.0% local appreciation)).
- Oklahoma County population projected at +41% by 2050 — long-run rental-demand tailwind backs the buy-and-hold thesis.
- By year 2, paydown + projected appreciation supports a ~$97k cash-out refi (75% LTV) — recoverable capital for the next deal without selling this one.
Negotiation context
- Only 5 days on market — expect competitive offers; lowballing is unlikely to land.
Questions for the listing agent
- What do current leases actually rent for vs. the listed asking? Can we see a recent rent roll and the last 12 months of T-12 income?
- What does the HOA fee cover, when was the last increase, and are there any pending special assessments or reserve-fund shortfalls?
- Is there a deadline driving the sale (1031 exchange, divorce, estate, relocation)? That informs how much negotiation room exists.
- Schools are A-rated — typically a magnet for longer-tenancy family renters. What's the average tenant stay here, and is there a school-zone premium baked into asking?
- The area grade is low — what's the realistic commute time and amenity access for the typical tenant pool here? Any planned neighborhood developments (good or bad) we should know about?
- What's the average days-on-market for RENTAL listings here right now (not sales)? A rising rental-DOM trend means longer vacancies and softer asking-rent achievability than the comps imply.
- What's the recent tenant-quality profile in this submarket — average credit score on applications, eviction rate, late-payment / NSF rate, and stable-employment percentage? A property-management company in the area should have these aggregated.
- How much new for-sale + rental construction is in the pipeline within 1–3 miles? Heavy new supply typically softens prices + rents 12–24 months out; constrained supply supports both.
Investment metrics
- 1% rule
- 0.65% ✗
- Cap rate
- 4.06%
- Cash-on-cash
- -7.97%
- DSCR
- 0.65
- GRM
- 12.8
CMA / ARV
- ARV (on-the-fly)
- $581,860
- Comps found
- 12
Show comp detail 12 sales within ~0.75 mi
| Address | Dist | Beds/Ba | Sqft | Sold | Price | $/sf | Match |
|---|---|---|---|---|---|---|---|
| 3533 Rolling Park Rd | 0.15mi | 4/4.0 (-1) | 2,991 (-3%) | 0mo | $585,000 | $196 | 82 |
| 8525 Maple Creek Rd | 0.13mi | 4/3.0 (-1) | 3,214 (+4%) | 2mo | $552,000 | $172 | 77 |
| 8633 Beechgrove Dr | 0.24mi | 4/3.5 (-1) | 2,930 (-5%) | 4mo | $549,764 | $188 | 70 |
| 3217 Mangrove Rd | 0.28mi | 5/3.0 | 2,950 (-5%) | 7mo | $534,990 | $181 | 70 |
| 8901 Cherry Blossom Rd | 0.28mi | 4/3.5 (-1) | 3,206 (+4%) | 7mo | $699,999 | $218 | 68 |
| 3033 Arbor Hill Dr | 0.40mi | 5/3.5 | 3,285 (+6%) | 4mo | $581,340 | $177 | 66 |
| 3025 Arbor Hill Dr | 0.41mi | 5/3.5 | 3,350 (+8%) | 3mo | $585,640 | $175 | 63 |
| 3109 Arbor Hill Dr | 0.40mi | 5/3.5 | 3,285 (+6%) | 8mo | $582,390 | $177 | 62 |
| 8609 Beechgrove Dr | 0.25mi | 4/4.0 (-1) | 2,859 (-8%) | 12mo | $563,000 | $197 | 61 |
| 8809 Westlake Dr | 0.17mi | 4/4.0 (-1) | 2,668 (-14%) | 4mo | $499,900 | $187 | 61 |
| 3008 Almond Ave | 0.29mi | 5/3.0 | 3,519 (+14%) | 9mo | $700,000 | $199 | 52 |
| 4224 Luke Ln | 0.72mi | 4/3.5 (-1) | 2,872 (-7%) | 7mo | $559,000 | $195 | 42 |
Match score weights: distance 35% · size 25% · config 20% · recency 20%. Top-matched comps best support the ARV.
Projected returns pro-forma
10.0% appreciation · 3.0% rent growth · sell at horizon
- IRR
- 18.7%
- Equity multiple
- 2.52×
- Total profit
- $240,904
- Equity at exit
- $509,055
- IRR
- 17.3%
- Equity multiple
- 5.82×
- Total profit
- $762,251
- Equity at exit
- $1,097,797
Cash invested: $158,218 (down + closing). Projections, not guarantees.
Landlord ↔ Tenant lean methodology
- Overall (STATE)
- 83 Strongly Landlord-Friendly
- State Oklahoma
- 83 Strongly Landlord-Friendly · R+20
- County
- — inherits STATE
- City
- — inherits STATE
ZIP-level market 73007
- Home prices YoY
- 4.0%
- Active inventory
- 192
- Price-to-rent
- 12.8×
Monthly cashflow live
- Estimated rent
- $3,692 medium interval (Pro) →
- Mortgage (P&I)
- −$2,963
- Tax est. 1.5%
- −$706 /mo · $8,476/yr
- Insurance
- −$235
- HOA
- −$63
- Vacancy / Maint / Mgmt
- −$775
- Net cashflow
- $-1,051
Break-even live
UW: 25.0% down · 7.5% · 30yr · 1.5% tax · 5.0% vac · 8.0% maint · 8.0% mgmt
Financing live
Cash to close
- Down payment
- $141,266
- Closing costs
- $16,952
- Reserves months
- —
- Total cash needed
- —
Loan-product check · same deal, 3 products live
Conventional
25% down · 7.5% · 30yr
- Down + closing
- —
- Monthly P&I
- —
- Monthly cashflow
- —
- DSCR
- —
- Eligible?
- —
Personal DTI + credit; lowest rate.
DSCR
20% down · 8.5% · 30yr
- Down + closing
- —
- Monthly P&I
- —
- Monthly cashflow
- —
- DSCR
- —
- Eligible?
- —
No personal income docs; deal must DSCR.
Hard money
10% down · 12.0% · 12mo
- Down + closing
- —
- Monthly P&I
- —
- Monthly cashflow
- —
- DSCR
- —
- Eligible?
- —
Short-term bridge; refi at stabilization.
Rent comps 2 comps
| Address | Beds | Baths | Sqft | Rent | $/sqft | DOM | Units | Dist |
|---|---|---|---|---|---|---|---|---|
| 7901 Behr Dr Edmond, OK | 5.0 | 4.0 | 2829 | $4,000 | $1.41 | 20d | 1 | 0.90mi |
| 3116 Drake Crest Dr Edmond, OK | 5.0 | 3.0 | 2950 | $3,250 | $1.10 | 1d | 1 | 1.35mi |
HOA detail
- Monthly dues
- $63 · $756/yr
Listing history 6 events
-
2026-06-18days on market $565,065 Active 5 DOM
-
2026-06-17days on market $565,065 Active 4 DOM
-
2026-06-16days on market $565,065 Active 3 DOM
-
2026-06-15days on market $565,065 Active 2 DOM
-
2026-06-13remarks 699-char remark
-
2026-06-13$565,065 Active 1 DOM
ⓘ Source: listings_history table (triggers on properties + properties_extension) + one-shot
backfill from property_details.listing_events for pre-trigger history.
Nearby sold comps map
Loading sold comps map…
Walkable amenities ~0.75 mi
Loading nearby amenities…
Taxation est. · year 1
- Rental income
- $44,309
- − Mortgage interest
- −$31,652
- − Property taxes
- −$8,476
- − Insurance
- −$2,825
- − Repairs & maintenance
- −$3,545
- − Management
- −$3,545
- − HOA
- −$756
- − Depreciation
- −$16,438
- Taxable loss
- −$22,928
- Est. tax savings @ 24.0%
- +$5,503
- After-tax cash flow
- $-7,109/yr
For passive investors: Depreciation is non-cash, so a rental often shows a tax loss while cash-flowing — sheltering income. Rental losses are passive: they offset passive income freely, and up to $25,000/yr can offset ordinary (W-2) income if you actively participate and your MAGI is under $100k (phasing out to $0 by $150k); unused losses carry forward. On sale, claimed depreciation is recaptured at up to 25%, and gains may owe capital-gains tax (a 1031 exchange can defer both). Figures are a year-1 estimate at your 24.0% rate — not tax advice; consult a CPA.
Schools (NCES district)
- District
- Edmond
- NCES district ID
- 4010590
- Math proficiency
- 38% ▼ -12.00%
- Reading proficiency
- 40% ▼ -12.00%
- Median HH income
- $73,212
- Composite
- 35.88/100
- National rank
- #4814
- State rank
- #11 of 270 in OK
Livability — Edmond
- Score
- 78/100
- State rank
- #6
- US rank
- #2383
Category grades
Schools grade is shown separately in the Schools card above.
Census & demographics
- Census place
- Edmond, OK
- City population
- 177,083
- Population (ZIP)
- 2,945
Population outlook (Oklahoma County) Hauer SSP2
- Today (2025)
- 911,875 people
- By 2030
- 982,413 · +7.7%
- By 2040
- 1,130,468 · +24.0%
- By 2050
- 1,288,422 · +41.3%
- By 2075
- 1,711,482 · +87.7%
- By 2100
- 2,088,448 · +129.0%
Race, ethnicity, and origin ACS 2023
- Neighborhood character
- Predominantly White (80%)
- Race & ethnicity
- White 80% Two or more races 15% Hispanic / Latino 5% Black 2%
- Common ancestry
- Lithuanian 5% Romanian 3% Italian 2%
- Foreign-born
- 2% · Canada
- Languages at home
- 94% English-only · Spanish 2% Other Asian/Pacific 1%
Political lean MEDSL · Oklahoma
- 2024 margin
- Toss-up / Even · D 48.0% · R 49.7% · Other 2.3%
- 2008→2024 swing
- +15.1pp toward D · 2008: -16.8pp · 2024: -1.7pp
- All cycles
- 2024: R+1.7 2020: R+1.1 2016: R+10.5 2012: R+16.7 2008: R+16.8
Not yet ingested
- Civics
- —
Market trends
- HPI YoY
- ▲ 12.99%
- Current HPI
- 336.6015
- Rent YoY
- —
- Metro
- —
- State GDP YoY
- ▲ 1.55%
- F500 in state
- 6
Industry mix (Fortune 500 HQ in OK)
| Industry | F500 HQs | Revenue |
|---|---|---|
| Energy | 3 | $48B |
|
||
Price history
1 event — show timeline
- 2026-06-13 Listed $565,065 MLSOK
Cash-flow waterfall
monthlySold comps — $/sqft
last 12 mo · ≤1 miLoading sold comps…