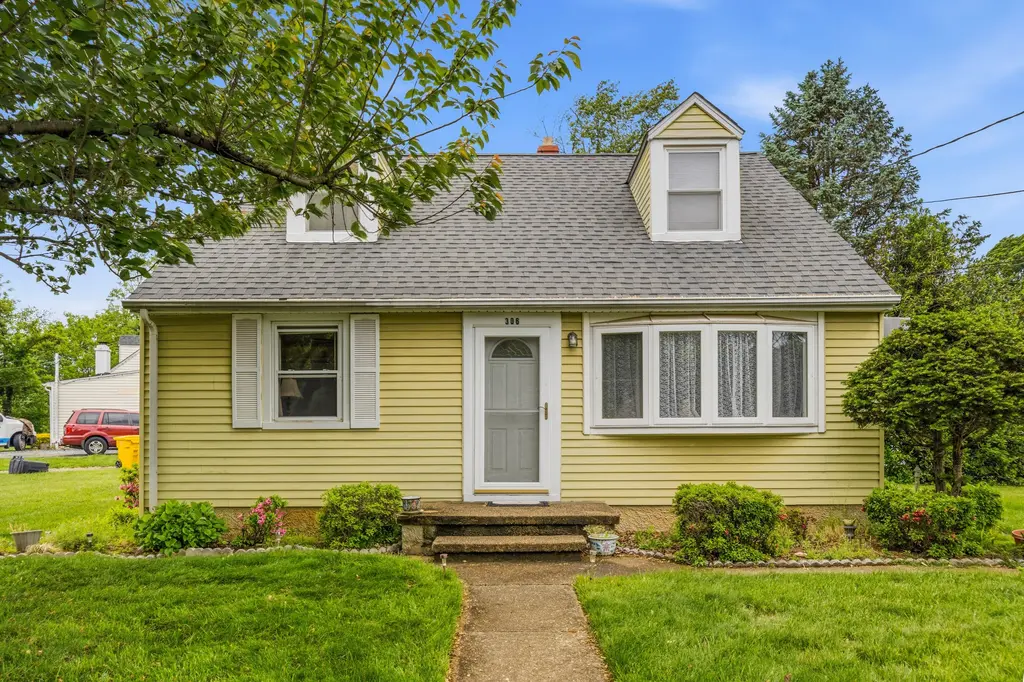
306 Clifton Ave · Arnold, MD
Flood risk 1/10 · Minimal
- FEMA flood zone
- X (unshaded)
- Chance of flooding over 30 yrs
- 0.0%
- Est. flood insurance / yr
- $507 – $1,088
Fire risk 1/10 · Minimal
- Est. fire insurance / yr
- $755 – $1,403
Heat risk 8/10 · Major
- Hot days now (above 104°F)
- 7 days/yr
- Hot days in 30 yrs
- 15 days/yr
Wind risk 6/10 · Moderate
- Chance of severe wind over 30 yrs
- 66.0%
Air-quality risk 3/10 · Minor
- Unhealthy air days now
- 2 days/yr
- Unhealthy air days in 30 yrs
- 3 days/yr
Risk factors via First Street. Map © Google.
Why this score? — see what drove the D grade
The composite is a weighted blend of 9 inputs, each scored 0–100. Each bar is that input's sub-score; the figure is the points it added to the 100-point composite (weight × sub-score).
- ARV discount +15.0/15.0
- Cash flow +11.3/30.0
- Livability +3.8/5.0
- DSCR +3.3/10.0
- Schools +2.9/10.0
- Rent growth +2.5/5.0
- Condition / age +2.5/5.0
- 1% rule +2.0/10.0
- Appreciation +0.0/10.0
$399,900
🖨 Deal sheet (PDF) 📄 Offer letter ✓ Due diligence
Listing remarks
* * * PRICE REDUCED 25K * * * Nestled in the desirable Broadneck area of Arnold, Maryland, this charming Cape Cod-style home offers classic character with a comfortable, functional layout. Step inside to find a welcoming main level featuring two spacious bedrooms and a full bath, perfect for convenient one-level living. The bright and inviting living spaces flow easily, creating a warm atmosphere ideal for everyday living and entertaining. Upstairs, you’ll discover a private retreat with a third bedroom and an additional full bath—perfect for a primary suite, guest space, or home office setup. Outside, the property features a generous driveway with room for up to four vehic
Key facts
- 0.25 acre lot
- Built 1953
- Listed 44 days
Property features AI
Exterior
- Parking: Driveway
- Utilities: Public water; Public sewer; Electric hot water
- Home design: Detached property; Year built reported by assessor
- Construction: Vinyl siding; Other type foundation
- Exterior features: Detached structure; Other above- and below-grade structures
Interior
- Bedrooms: Two bedrooms on the main level; One bedroom on the upper level
- Bathrooms: One full bathroom on the main level; One full bathroom total
- Heating & cooling: Baseboard electric heating; Window air conditioning units (electric)
- Interior features: No basement; Finished living area reported by assessor
Neighborhood map
What this means for you Summary
Snapshot
- This is a 3-bed/1.0-bath single-family listed at $400k.
Deal economics
- At list price, monthly cash flow is $-148 ($-2k/yr) — negative.
- To cash-flow at today's rent, offer at most $374k (6.6% below list).
- To meet the 1% rule (rent ≥ 1% of price), the offer needs to be $281k (29.7% below list).
- Recommended offer: $281k (29.7% below list) — sets the bar for 1% rule.
- Cap rate 5.8% vs local median 3.1% in Arnold — top-decile yield for the area; either an underpriced asset or a hidden risk that comps aren't pricing in. Stress-test before assuming the spread holds.
Location & tenants
- Location reads 76/100 on livability (#93 in MD, #3,518 nationally) — a middle-class / working-renter tenant base. Strengths: employment A+, housing A+, health & safety A-; Watch: amenities F, cost of living F.
- Anne Arundel County Public Schools (suburban): math 20% / reading 37% proficiency, ranked #10 of 24 in MD (top 42%) — low school quality limits family demand, transient renter base, plan for 1-2y turnover.
- Zoned schools: Monarch Global Academy Pcs Laurel Campus (math 13% / reading 28%, grade F, #341 of 860 statewide, top 40%, 830 students, 53% FRL); Severn River Middle (math 26% / reading 55%, grade F, #25 of 225 statewide, top 11%, 734 students, 20% FRL); Broadneck High (math 62% / reading 77%, grade B, #40 of 222 statewide, top 19%, 2,174 students, 19% FRL).
- Zoned-school proficiency averages 44% at this address vs 28% district-wide (+15 pts) — the actual schools serving this property are materially stronger than the Anne Arundel County Public Schools average implies; a family-tenant draw the district grade alone would hide.
- Market conditions: 91 active listings in the ZIP; 10 comparable units currently listed for rent nearby; rentals lingering (median 46d on market — plan ~5-8 weeks vacancy on turnover, expect pricing pressure); 50% of comp listings sitting > 30 days — soft ceiling on asking rent; high-income renter base; 1,303 units permitted in Anne Arundel County in 2024 (299 in 5+ unit buildings).
Forward outlook
- Local home prices are declining (-3.0%/yr); year-one equity from $3k of loan paydown is wiped out by about $12k of value loss. Plan a longer hold.
- Anne Arundel County population projected at +17% by 2050 — long-run rental-demand tailwind backs the buy-and-hold thesis.
Negotiation context
- It's been on market 44 days — a 3% lower offer ($388k) is reasonable based on typical stale-listing flexibility.
Risks & watch-outs
- Watch-outs: built in 1953 — expect roof / HVAC / electrical / plumbing capex.
- Climate carrying-cost: major wind risk, 66% chance of damaging wind over 30y; extreme-heat days projected 7→15/yr by 2055 (HVAC capex compounding) — expect insurance premiums to compound above CPI over the hold.
Questions for the listing agent
- What do current leases actually rent for vs. the listed asking? Can we see a recent rent roll and the last 12 months of T-12 income?
- It's been on market 44 days. Have you received any prior offers? Is the seller open to a 30% concession, seller financing, or rate buy-down credit?
- Built in 1953 — when were the roof, HVAC, electrical panel, plumbing, and water heater last replaced?
- Is there a deadline driving the sale (1031 exchange, divorce, estate, relocation)? That informs how much negotiation room exists.
- Schools are A-rated — typically a magnet for longer-tenancy family renters. What's the average tenant stay here, and is there a school-zone premium baked into asking?
- The area grade is low — what's the realistic commute time and amenity access for the typical tenant pool here? Any planned neighborhood developments (good or bad) we should know about?
- What's the average days-on-market for RENTAL listings here right now (not sales)? A rising rental-DOM trend means longer vacancies and softer asking-rent achievability than the comps imply.
- What's the recent tenant-quality profile in this submarket — average credit score on applications, eviction rate, late-payment / NSF rate, and stable-employment percentage? A property-management company in the area should have these aggregated.
- How much new for-sale + rental construction is in the pipeline within 1–3 miles? Heavy new supply typically softens prices + rents 12–24 months out; constrained supply supports both.
Investment metrics
- 1% rule
- 0.70% ✗
- Cap rate
- 5.85%
- Cash-on-cash
- -1.59%
- DSCR
- 0.93
- GRM
- 11.9
CMA / ARV
- ARV (median comp)
- $487,804
- List price
- $399,900
- Delta
- -18.02%
- Verdict
- UNDERPRICED
- Comps
- 20 within 1.0 mi
Show comp detail 9 sales within ~0.75 mi
| Address | Dist | Beds/Ba | Sqft | Sold | Price | $/sf | Match |
|---|---|---|---|---|---|---|---|
| 319 Alameda Pkwy | 0.17mi | 3/1.0 | 1,260 (0%) | 2mo | $360,000 | $286 | 90 |
| 339 Clifton Ave | 0.28mi | 4/1.5 (+1) | 1,260 (0%) | 8mo | $485,000 | $385 | 74 |
| 832 Clifton Ave | 0.07mi | 4/2.0 (+1) | 1,400 (+11%) | 6mo | $535,000 | $382 | 65 |
| 135 Brent Rd | 0.75mi | 3/2.0 | 1,224 (-3%) | 10mo | $460,000 | $376 | 48 |
| 826 Clifton Ave | 0.12mi | 4/2.0 (+1) | 1,400 (+11%) | 23mo | $480,000 | $343 | 48 |
| 826 Windsor Rd | 0.27mi | 4/2.0 (+1) | 1,152 (-9%) | 20mo | $495,000 | $430 | 47 |
| 360 Buena Vista Ave | 0.38mi | 4/2.0 (+1) | 1,408 (+12%) | 19mo | $490,000 | $348 | 38 |
| 303 Long Meadow Way | 0.52mi | 3/2.5 | 1,352 (+7%) | 24mo | $426,000 | $315 | 38 |
| 424 Alameda Pkwy | 0.63mi | 3/1.5 | 1,448 (+15%) | 10mo | $1,050,000 | $725 | 36 |
Match score weights: distance 35% · size 25% · config 20% · recency 20%. Top-matched comps best support the ARV.
Projected returns pro-forma
-3.0% appreciation · 3.0% rent growth · sell at horizon
- IRR
- -19.0%
- Equity multiple
- 0.34×
- Total profit
- $-74,452
- Equity at exit
- $59,626
- IRR
- -11.7%
- Equity multiple
- 0.31×
- Total profit
- $-77,817
- Equity at exit
- $34,576
Cash invested: $111,972 (down + closing). Projections, not guarantees.
Landlord ↔ Tenant lean methodology
- Overall (STATE)
- 27 Tenant-Leaning
- State Maryland
- 27 Tenant-Leaning · D+14
- County
- — inherits STATE
- City
- — inherits STATE
ZIP-level market 21012
- Active inventory
- 91
- Price-to-rent
- 11.9×
Monthly cashflow live
- Estimated rent
- $2,809 high interval (Pro) →
- Mortgage (P&I)
- −$2,097
- Tax from tax record
- −$104 /mo · $1,248/yr
- Insurance
- −$167
- HOA
- −$0
- Vacancy / Maint / Mgmt
- −$590
- Net cashflow
- $-148
Break-even live
Sensitivity live
| Price | -10% $78 | -5% $-35 | +0% $-148 | +5% $-262 | +10% $-375 |
|---|---|---|---|---|---|
| Rent | -10% $-370 | -5% $-259 | +0% $-148 | +5% $-37 | +10% $74 |
| Rate | -1.0pp $53 | -0.5pp $-47 | base $-148 | +0.5pp $-252 | +1.0pp $-357 |
UW: 25.0% down · 7.5% · 30yr · 1.5% tax · 5.0% vac · 8.0% maint · 8.0% mgmt
Financing live
Cash to close
- Down payment
- $99,975
- Closing costs
- $11,997
- Reserves months
- —
- Total cash needed
- —
Loan-product check · same deal, 3 products live
Conventional
25% down · 7.5% · 30yr
- Down + closing
- —
- Monthly P&I
- —
- Monthly cashflow
- —
- DSCR
- —
- Eligible?
- —
Personal DTI + credit; lowest rate.
DSCR
20% down · 8.5% · 30yr
- Down + closing
- —
- Monthly P&I
- —
- Monthly cashflow
- —
- DSCR
- —
- Eligible?
- —
No personal income docs; deal must DSCR.
Hard money
10% down · 12.0% · 12mo
- Down + closing
- —
- Monthly P&I
- —
- Monthly cashflow
- —
- DSCR
- —
- Eligible?
- —
Short-term bridge; refi at stabilization.
Rent comps 10 comps
| Address | Beds | Baths | Sqft | Rent | $/sqft | DOM | Units | Dist |
|---|---|---|---|---|---|---|---|---|
| 1062 Brightleaf Dr Arnold, MD | 3.0 | 2.0 | 1640 | $2,600 | $1.59 | 45d | 1 | 0.27mi |
| 269 Ternwing Dr Arnold, MD | 3.0 | 1.0 | 1156 | $2,500 | $2.16 | 45d | 1 | 0.31mi |
| 527 Greenblades Ct Arnold, MD | 3.0 | 2.0 | 1246 | $2,375 | $1.91 | 19d | 1 | 0.47mi |
| 394 Kiltie Ct Arnold, MD | 3.0 | 2.0 | 1580 | $3,150 | $1.99 | 45d | 1 | 0.53mi |
| 880 Doris Dr Arnold, MD | 4.0 | 1.5 | 1175 | $3,250 | $2.77 | 0d | 1 | 0.59mi |
| 358 Kimwood Rd Arnold, MD | 3.0 | 1.5 | 1248 | $2,500 | $2.00 | 45d | 1 | 0.67mi |
| 791 Match Point Dr Arnold, MD | 3.0 | 1.5 | 1240 | $2,700 | $2.18 | 45d | 1 | 0.99mi |
| 1254 Masters Dr Arnold, MD | 3.0 | 4.0 | 1832 | $2,550 | $1.39 | 25d | 1 | 1.22mi |
| 614 Oakland Hills Dr Arnold, MD | 1.0–2.0 | 1.0–1.5 | 896 | $2,609 | $2.91 | 0d | 8 | 1.44mi |
| 638 Oakland Hills Dr Unit A1 Arnold, MD | 2.0 | 2.0 | 1054 | $2,500 | $2.37 | 6d | 1 | 1.47mi |
Listing history 16 events
-
2026-06-21days on market $399,900 Active 44 DOM
-
2026-06-18days on market $399,900 Active 41 DOM
-
2026-06-17days on market $399,900 Active 40 DOM
-
2026-06-16days on market $399,900 Active 39 DOM
-
2026-06-15days on market $399,900 Active 38 DOM
-
2026-06-13days on market $399,900 Active 36 DOM
-
2026-06-09days on market $399,900 Active 32 DOM
-
2026-06-08days on market $399,900 Active 31 DOM
-
2026-06-07pricedays on market $399,900 Active 30 DOM
-
2026-06-04days on market $425,000 Active 27 DOM
-
2026-06-03days on market $425,000 Active 26 DOM
-
2026-06-02days on market $425,000 Active 25 DOM
-
2026-06-01days on market $425,000 Active 24 DOM
-
2026-05-31days on market $425,000 Active 23 DOM
-
2026-05-08$425,000 Active 1089-char remark
-
2026-05-04historical $425,000 1089-char remark
ⓘ Source: listings_history table (triggers on properties + properties_extension) + one-shot
backfill from property_details.listing_events for pre-trigger history.
Tax reassessment forecast MD · Partial reset (capped growth)
- Current annual tax
- $1,248 · $104/mo
- Projected year-2 tax
- $2,804 · $234/mo
- Expected delta
- +$1,555/yr (+$130/mo · 124.6%)
ⓘ Screening estimate from a state-policy table — verify with the county assessor before closing.
Climate risk First Street
- Flood 1/10 Low FEMA zone X (unshaded) · 0% chance over 30 yrs
- Wildfire 1/10 Low
- Heat 8/10 Severe 7 d/yr ≥104°F today · 15 d/yr by 30 yrs out
- Wind 6/10 Major 66% chance of damaging wind over 30 yrs
- Air quality 3/10 Moderate 2 unhealthy d/yr today · 3 by 30 yrs out
Nearby sold comps map
Loading sold comps map…
Walkable amenities ~0.75 mi
Loading nearby amenities…
Taxation est. · year 1
- Rental income
- $33,712
- − Mortgage interest
- −$22,401
- − Property taxes
- −$1,248
- − Insurance
- −$2,000
- − Repairs & maintenance
- −$2,697
- − Management
- −$2,697
- − Depreciation
- −$11,633
- Taxable loss
- −$8,964
- Est. tax savings @ 24.0%
- +$2,151
- After-tax cash flow
- $371/yr
For passive investors: Depreciation is non-cash, so a rental often shows a tax loss while cash-flowing — sheltering income. Rental losses are passive: they offset passive income freely, and up to $25,000/yr can offset ordinary (W-2) income if you actively participate and your MAGI is under $100k (phasing out to $0 by $150k); unused losses carry forward. On sale, claimed depreciation is recaptured at up to 25%, and gains may owe capital-gains tax (a 1031 exchange can defer both). Figures are a year-1 estimate at your 24.0% rate — not tax advice; consult a CPA.
Schools (NCES district)
- District
- Anne Arundel County Public Schools
- NCES district ID
- 2400060
- Math proficiency
- 20% ▼ -21.00%
- Reading proficiency
- 37% ▼ -13.00%
- Median HH income
- $87,880
- Composite
- 28.52/100
- National rank
- #6733
- State rank
- #10 of 24 in MD
Livability — Arnold
- Score
- 76/100
- State rank
- #93
- US rank
- #3518
Category grades
Schools grade is shown separately in the Schools card above.
Census & demographics
- Census place
- Arnold, MD
- County
- Anne Arundel County · 535,653 people
- City population
- 22,570
- Metro
- Baltimore-Columbia-Towson, MD
- Population (ZIP)
- 22,570
- Household income
- $139,432
- Rent vs Own
- Severe rent burden
- 271.0
Population outlook (Anne Arundel County) Hauer SSP2
- Today (2025)
- 617,384 people
- By 2030
- 642,094 · +4.0%
- By 2040
- 686,621 · +11.2%
- By 2050
- 723,031 · +17.1%
- By 2075
- 809,346 · +31.1%
- By 2100
- 837,658 · +35.7%
Race, ethnicity, and origin ACS 2023
- Neighborhood character
- Predominantly White (76%)
- Race & ethnicity
- White 76% Hispanic / Latino 11% Two or more races 9% Black 4% Asian 4%
- Hispanic origin (detail)
- Mexican 4% Puerto Rican 1%
- Common ancestry
- Romanian 5% Slovak 3% Lithuanian 2%
- Foreign-born
- 8% · Canada
- Languages at home
- 89% English-only · Spanish 6% Other Indo-European 1% Tagalog/Filipino 1%
Political lean MEDSL · Anne Arundel
- 2024 margin
- D (+13.9) · D 55.7% · R 41.7% · Other 2.6%
- 2008→2024 swing
- +15.7pp toward D · 2008: -1.8pp · 2024: 13.9pp
- All cycles
- 2024: D+13.9 2020: D+14.5 2016: D+0.7 2012: R+0.9 2008: R+1.8
Not yet ingested
- Civics
- —
Market trends
- HPI YoY
- ▼ -469.24%
- Current HPI
- 288.2944
- Rent YoY
- —
- Metro
- Baltimore-Columbia-Towson, MD
- State GDP YoY
- ▲ 2.97%
- F500 in state
- 12
Industry mix (Fortune 500 HQ in MD)
| Industry | F500 HQs | Revenue |
|---|---|---|
| Aerospace / Defense | 1 | $71B |
|
||
| Utilities | 1 | $25B |
|
||
| Hotels | 1 | $24B |
|
||
| Consumer Goods | 1 | $7B |
|
||
| Real Estate | 1 | $6B |
|
||
| Chemicals | 1 | $2B |
|
||
Price history
-5.9% since first listed3 events — show timeline
- 2026-06-05 Price Changed $399,900 BRIGHT MLS
- 2026-05-08 Listed $425,000 BRIGHT MLS
- 2026-05-04 Coming Soon $425,000 BRIGHT MLS
Property tax history
+0.3%/yrLatest (2025): $1,248 · -33.6% YoY. Source: county tax records.
Cash-flow waterfall
monthlySold comps — $/sqft
last 12 mo · ≤1 miLoading sold comps…