264 Halifax Ln · Chelsea, AL
Flood risk 1/10 · Minimal
- FEMA flood zone
- X (unshaded)
- Chance of flooding over 30 yrs
- 0.0%
- Est. flood insurance / yr
- $507 – $1,088
Fire risk 5/10 · Moderate
- Est. fire insurance / yr
- $916 – $1,700
Heat risk 6/10 · Moderate
- Hot days now (above 107°F)
- 7 days/yr
- Hot days in 30 yrs
- 19 days/yr
Wind risk 6/10 · Moderate
- Chance of severe wind over 30 yrs
- 27.0%
Air-quality risk 3/10 · Minor
- Unhealthy air days now
- 3 days/yr
- Unhealthy air days in 30 yrs
- 4 days/yr
Risk factors via First Street. Map © Google.
Why this score? — see what drove the D- grade
The composite is a weighted blend of 9 inputs, each scored 0–100. Each bar is that input's sub-score; the figure is the points it added to the 100-point composite (weight × sub-score).
- Cash flow +11.1/30.0
- ARV discount +8.2/15.0
- Condition / age +4.0/5.0
- Schools +3.9/10.0
- Livability +3.5/5.0
- 1% rule +3.4/10.0
- DSCR +3.2/10.0
- Rent growth +2.5/5.0
- Appreciation +0.0/10.0
$341,400
🖨 Deal sheet 📄 Offer letter ✓ Due diligence
Listing remarks
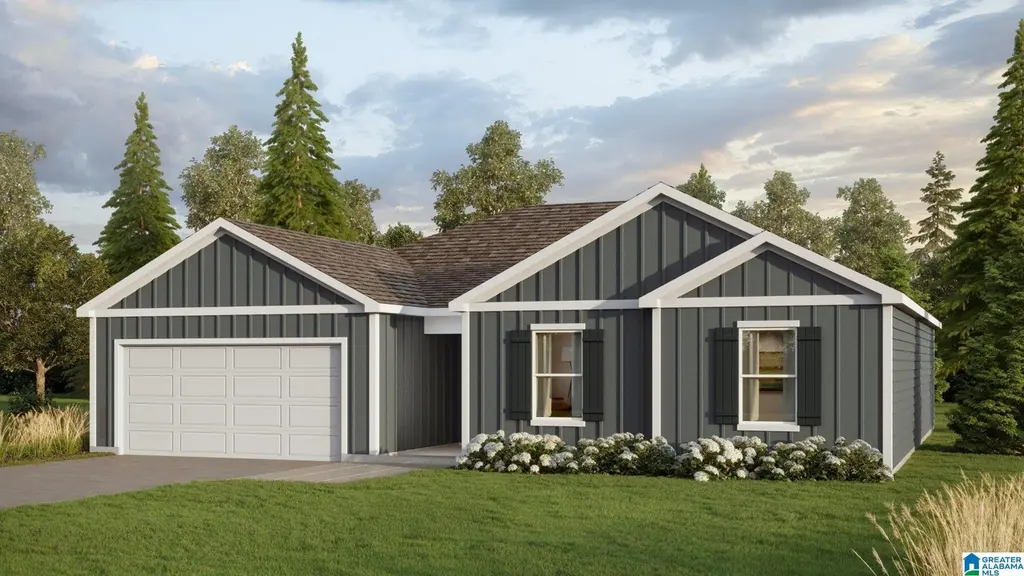
Ask about our interest rates, paid closing cost and easily added options. The Iris plan is a single-level layout with 3 bedrooms, 2 bathrooms, and 1,734 square feet of living space. One standout feature of the Iris plan is the seamless integration of the kitchen, breakfast area, and a dining area open concept layout, with direct access to a covered porch area. The living area offers the wide open style that leads to a shaded covered patio, creating a welcoming space for relaxation and entertaining. Throughout the home, you'll find quality materials and superior workmanship, with meticulous attention to detail, all backed by a one-year builder's warranty for peace of mind. Your new home
Key facts
- Shaded covered patio
- Covered porch area
- Open concept layout
Tags
Property features AI
Finance
- Other: Property has curb and gutter access on a paved public road
- HOA & community: Annual association fee of $450; HOA covers common grounds maintenance and utilities for common areas
Exterior
- Parking: Attached front-entry 2-car garage; Driveway parking and multilevel parking available
- Utilities: Public water; Sewer connected; Underground utilities; Tankless gas water heater; Internet service availability
- Home design: Single-family property under construction; Slab foundation; Siding finished in Hardiplank
- Construction: Under construction; Hardiplank siding; Slab foundation
- Exterior features: Covered patio; Community in-ground pool with cleaning system, perimeter fencing; Lot described as subdivision; No waterfront, no garden/patio areas, no decks
Interior
- Kitchen: Solid surface and stone countertops; Island with eating area; Pantry; Built-in microwave, built-in dishwasher, gas stove; Some stainless appliances
- Bedrooms: Master bedroom on main level; Two additional bedrooms on main level
- Flooring: Carpet and vinyl flooring
- Bathrooms: Two full bathrooms; Master bath with garden tub and separate shower; other baths include tub/shower combo and shared bath; Linen closet
- Heating & cooling: Central heating with gas heat and zoned system; Central electric cooling with zoned system
- Interior features: 9-foot (and higher) smooth and trey ceilings; No additional built-in interior features listed
- Laundry & utility: Main-level laundry room; Washer hookup and electric dryer hookup; Attic present
Neighborhood map
What this means for you Summary
Snapshot
- This is a 3-bed/2.0-bath single-family listed at $341k. Condition is rated good.
Deal economics
- At list price, monthly cash flow is $-139 ($-2k/yr) — negative.
- To cash-flow at today's rent, offer at most $321k (5.9% below list).
- To meet the 1% rule (rent ≥ 1% of price), the offer needs to be $286k (16.3% below list).
- Recommended offer: $286k (16.3% below list) — sets the bar for 1% rule.
- Cap rate 5.8% vs local median 4.1% in Chelsea — top-decile yield for the area; either an underpriced asset or a hidden risk that comps aren't pricing in. Stress-test before assuming the spread holds.
Location & tenants
- Location reads 69/100 on livability (#52 in AL) — a middle-class / working-renter tenant base. Strengths: crime A+, employment A+, housing A+; Watch: amenities F, commute F, health & safety F.
- Shelby County (suburban): math 30% / reading 58% proficiency, ranked #16 of 129 in AL (top 12%) — families likely to look elsewhere, expect single-tenant / working-renter base with shorter leases.
- Zoned schools: Forest Oaks Elementary School (math 44% / reading 63%, grade C, #99 of 627 statewide, top 16%, 683 students, 27% FRL); Chelsea High School (math 43% / reading 42%, grade F, #27 of 305 statewide, top 9%, 1,400 students, 23% FRL) — zoned schools at 25% FRL track the district average.
- Market conditions: 287 active listings in the ZIP; 2 comparable units currently listed for rent nearby; 987 units permitted in Shelby County in 2024 (0 in 5+ unit buildings).
Forward outlook
- Local home prices are declining (-3.0%/yr); year-one equity from $2k of loan paydown is wiped out by about $10k of value loss. Plan a longer hold.
- Shelby County population projected at +23% by 2050 — long-run rental-demand tailwind backs the buy-and-hold thesis.
Negotiation context
- It's been on market 25 days — a 2% lower offer ($336k) is reasonable based on typical stale-listing flexibility.
Risks & watch-outs
- Climate carrying-cost: major wind risk, 27% chance of damaging wind over 30y; moderate wildfire risk; extreme-heat days projected 7→19/yr by 2055 (HVAC capex compounding) — expect insurance premiums to compound above CPI over the hold.
Questions for the listing agent
- What do current leases actually rent for vs. the listed asking? Can we see a recent rent roll and the last 12 months of T-12 income?
- What does the HOA fee cover, when was the last increase, and are there any pending special assessments or reserve-fund shortfalls?
- Is there a deadline driving the sale (1031 exchange, divorce, estate, relocation)? That informs how much negotiation room exists.
- Schools are B-rated — typically a magnet for longer-tenancy family renters. What's the average tenant stay here, and is there a school-zone premium baked into asking?
- The area grade is low — what's the realistic commute time and amenity access for the typical tenant pool here? Any planned neighborhood developments (good or bad) we should know about?
- What's the average days-on-market for RENTAL listings here right now (not sales)? A rising rental-DOM trend means longer vacancies and softer asking-rent achievability than the comps imply.
- What's the recent tenant-quality profile in this submarket — average credit score on applications, eviction rate, late-payment / NSF rate, and stable-employment percentage? A property-management company in the area should have these aggregated.
- How much new for-sale + rental construction is in the pipeline within 1–3 miles? Heavy new supply typically softens prices + rents 12–24 months out; constrained supply supports both.
Investment metrics
- 1% rule
- 0.84% ✗
- Cap rate
- 5.80%
- Cash-on-cash
- -1.74%
- DSCR
- 0.92
- GRM
- 10.0
CMA / ARV
- ARV (median comp)
- $347,164
- List price
- $341,400
- Delta
- -1.66%
- Verdict
- FAIR
- Comps
- 20 within 1.0 mi
Show comp detail 12 sales within ~0.75 mi
| Address | Dist | Beds/Ba | Sqft | Sold | Price | $/sf | Match |
|---|---|---|---|---|---|---|---|
| 509 Foggy Brook Loop | 0.10mi | 3/2.0 | 1,734 (0%) | 2mo | $334,900 | $193 | 94 |
| 500 Foggy Brook Loop | 0.08mi | 3/2.0 | 1,734 (0%) | 4mo | $325,900 | $188 | 93 |
| 296 Halifax Ln | 0.12mi | 4/2.0 (+1) | 1,774 (+2%) | 1mo | $344,900 | $194 | 85 |
| 288 Halifax Ln | 0.08mi | 3/2.0 | 1,618 (-7%) | 1mo | $329,900 | $204 | 84 |
| 271 Halifax Ln | 0.13mi | 4/2.0 (+1) | 1,774 (+2%) | 3mo | $332,400 | $187 | 83 |
| 295 Halifax Ln | 0.12mi | 3/2.0 | 1,618 (-7%) | 1mo | $328,900 | $203 | 83 |
| 284 Halifax Ln | 0.14mi | 4/2.0 (+1) | 1,774 (+2%) | 4mo | $338,965 | $191 | 81 |
| 311 Halifax Ln | 0.13mi | 4/2.5 (+1) | 1,885 (+9%) | 2mo | $339,900 | $180 | 71 |
| 728 Fish Camp Rd | 0.43mi | 4/2.0 (+1) | 1,774 (+2%) | 6mo | $296,000 | $167 | 66 |
| 505 Foggy Brook Loop | 0.09mi | 4/3.0 (+1) | 1,941 (+12%) | 2mo | $359,900 | $185 | 65 |
| 223 Halifax Ln | 0.26mi | 4/2.0 (+1) | 1,497 (-14%) | 6mo | $292,400 | $195 | 55 |
| 853 Fish Camp Rd | 0.65mi | 4/2.0 (+1) | 1,497 (-14%) | 7mo | $290,000 | $194 | 36 |
Match score weights: distance 35% · size 25% · config 20% · recency 20%. Top-matched comps best support the ARV.
Projected returns pro-forma
-3.0% appreciation · 3.0% rent growth · sell at horizon
- IRR
- -19.2%
- Equity multiple
- 0.33×
- Total profit
- $-64,108
- Equity at exit
- $50,904
- IRR
- -11.7%
- Equity multiple
- 0.30×
- Total profit
- $-66,953
- Equity at exit
- $29,518
Cash invested: $95,592 (down + closing). Projections, not guarantees.
Landlord ↔ Tenant lean methodology
- Overall (STATE)
- 90 Strongly Landlord-Friendly
- State Alabama
- 90 Strongly Landlord-Friendly · R+15
- County
- — inherits STATE
- City
- — inherits STATE
ZIP-level market 35043
- Home prices YoY
- -15.6%
- Active inventory
- 287
- Price-to-rent
- 10.0×
Monthly cashflow live
- Estimated rent
- $2,859 medium interval (Pro) →
- Mortgage (P&I)
- −$1,790
- Tax est. 1.5%
- −$427 /mo · $5,121/yr
- Insurance
- −$142
- HOA
- −$38
- Vacancy / Maint / Mgmt
- −$600
- Net cashflow
- $-139
Break-even live
UW: 25.0% down · 7.5% · 30yr · 1.5% tax · 5.0% vac · 8.0% maint · 8.0% mgmt
Financing live
Cash to close
- Down payment
- $85,350
- Closing costs
- $10,242
- Reserves months
- —
- Total cash needed
- —
Loan-product check · same deal, 3 products live
Conventional
25% down · 7.5% · 30yr
- Down + closing
- —
- Monthly P&I
- —
- Monthly cashflow
- —
- DSCR
- —
- Eligible?
- —
Personal DTI + credit; lowest rate.
DSCR
20% down · 8.5% · 30yr
- Down + closing
- —
- Monthly P&I
- —
- Monthly cashflow
- —
- DSCR
- —
- Eligible?
- —
No personal income docs; deal must DSCR.
Hard money
10% down · 12.0% · 12mo
- Down + closing
- —
- Monthly P&I
- —
- Monthly cashflow
- —
- DSCR
- —
- Eligible?
- —
Short-term bridge; refi at stabilization.
Rent comps 2 comps
| Address | Beds | Baths | Sqft | Rent | $/sqft | DOM | Units | Dist |
|---|---|---|---|---|---|---|---|---|
| 283 Halifax Ln Chelsea, AL | 4.0 | 2.0 | 2250 | $2,950 | $1.31 | 44d | 1 | 0.08mi |
| 24 Autry Dr Chelsea, AL | 4.0 | 2.0 | 1856 | $1,770 | $0.95 | 1d | 1 | 1.44mi |
HOA detail
- Monthly dues
- $38 · $456/yr
Listing history 3 events
-
2026-06-01pricestatusdays on market $341,400 Pending 25 DOM
-
2026-05-31days on market $334,900 Active 24 DOM
-
2026-05-07$334,900 Active 748-char remark
ⓘ Source: listings_history table (triggers on properties + properties_extension) + one-shot
backfill from property_details.listing_events for pre-trigger history.
Climate risk First Street
- Flood 1/10 Low FEMA zone X (unshaded) · 0% chance over 30 yrs
- Wildfire 5/10 Major
- Heat 6/10 Major 7 d/yr ≥107°F today · 19 d/yr by 30 yrs out
- Wind 6/10 Major 27% chance of damaging wind over 30 yrs
- Air quality 3/10 Moderate 3 unhealthy d/yr today · 4 by 30 yrs out
Nearby sold comps map
Loading sold comps map…
Walkable amenities ~0.75 mi
Loading nearby amenities…
Taxation est. · year 1
- Rental income
- $34,304
- − Mortgage interest
- −$19,124
- − Property taxes
- −$5,121
- − Insurance
- −$1,707
- − Repairs & maintenance
- −$2,744
- − Management
- −$2,744
- − HOA
- −$456
- − Depreciation
- −$9,932
- Taxable loss
- −$7,524
- Est. tax savings @ 24.0%
- +$1,806
- After-tax cash flow
- $138/yr
For passive investors: Depreciation is non-cash, so a rental often shows a tax loss while cash-flowing — sheltering income. Rental losses are passive: they offset passive income freely, and up to $25,000/yr can offset ordinary (W-2) income if you actively participate and your MAGI is under $100k (phasing out to $0 by $150k); unused losses carry forward. On sale, claimed depreciation is recaptured at up to 25%, and gains may owe capital-gains tax (a 1031 exchange can defer both). Figures are a year-1 estimate at your 24.0% rate — not tax advice; consult a CPA.
Condition & rehab AI · 12 photos
This single-family home is in excellent condition with modern finishes and a good curb appeal. It's move-in ready and would benefit from some exterior painting and landscaping improvements to further enhance its value.
Value-add opportunities
- Resale Painting exterior siding — Fresh paint can enhance curb appeal and home value.
- Resale Landscaping improvements — Enhanced landscaping can attract more buyers.
- Both Add a smart home system — Modern technology can increase both resale and rental value.
- Rental Install smart locks — Smart locks can improve tenant satisfaction and security.
Renovation cost estimate screening
Value-add ROI direction
- Resale Painting exterior siding — Fresh paint can enhance curb appeal and home value. ↑
- Resale Landscaping improvements — Enhanced landscaping can attract more buyers. ↑
- Both Add a smart home system — Modern technology can increase both resale and rental value. ↑
- Rental Install smart locks — Smart locks can improve tenant satisfaction and security. ↑
ⓘ Cost ranges are severity-bucket heuristics (US national rule-of-thumb). Get contractor quotes + a written scope before underwriting a rehab budget.
Schools (NCES district)
- District
- Shelby County
- NCES district ID
- 0103030
- Math proficiency
- 30% ▼ -28.00%
- Reading proficiency
- 58% ▲ 2.00%
- Median HH income
- $66,672
- Composite
- 39.29/100
- National rank
- #3995
- State rank
- #16 of 129 in AL
Livability — Chelsea
- Score
- 69/100
- State rank
- #52
- US rank
- #8363
Category grades
Schools grade is shown separately in the Schools card above.
Census & demographics
- Census place
- Chelsea, AL
- City population
- 15,068
- Population (ZIP)
- 15,068
Population outlook (Shelby County) Hauer SSP2
- Today (2025)
- 237,024 people
- By 2030
- 249,868 · +5.4%
- By 2040
- 272,778 · +15.1%
- By 2050
- 291,062 · +22.8%
- By 2075
- 326,049 · +37.6%
- By 2100
- 335,870 · +41.7%
Race, ethnicity, and origin ACS 2023
- Neighborhood character
- Predominantly White (85%)
- Race & ethnicity
- White 85% Black 6% Hispanic / Latino 5% Two or more races 4%
- Hispanic origin (detail)
- Mexican 3%
- Common ancestry
- Serbian 3% Slovak 2% Romanian 2%
- Foreign-born
- 3% · Canada
- Languages at home
- 92% English-only · Arabic 4% Spanish 4%
Political lean MEDSL · Shelby
- 2024 margin
- Solid R (+40.9) · D 29.0% · R 69.9% · Other 1.1%
- 2008→2024 swing
- +12.6pp toward D · 2008: -53.4pp · 2024: -40.9pp
- All cycles
- 2024: R+40.9 2020: R+40.4 2016: R+50.3 2012: R+55.6 2008: R+53.4
Not yet ingested
- Civics
- —
Market trends
- HPI YoY
- ▼ -38.08%
- Current HPI
- 205.463
- Rent YoY
- —
- Metro
- —
- State GDP YoY
- ▲ 2.94%
- F500 in state
- 4
Industry mix (Fortune 500 HQ in AL)
| Industry | F500 HQs | Revenue |
|---|---|---|
| Financial Services | 1 | $8B |
|
||
| Healthcare | 1 | $5B |
|
||
Price history
+1.9% since first listed3 events — show timeline
- 2026-06-01 Price Changed $341,400 Greater Alabama MLS
- 2026-06-01 Pending — Greater Alabama MLS
- 2026-05-07 Listed $334,900 Greater Alabama MLS
Cash-flow waterfall
monthlySold comps — $/sqft
last 12 mo · ≤1 miLoading sold comps…