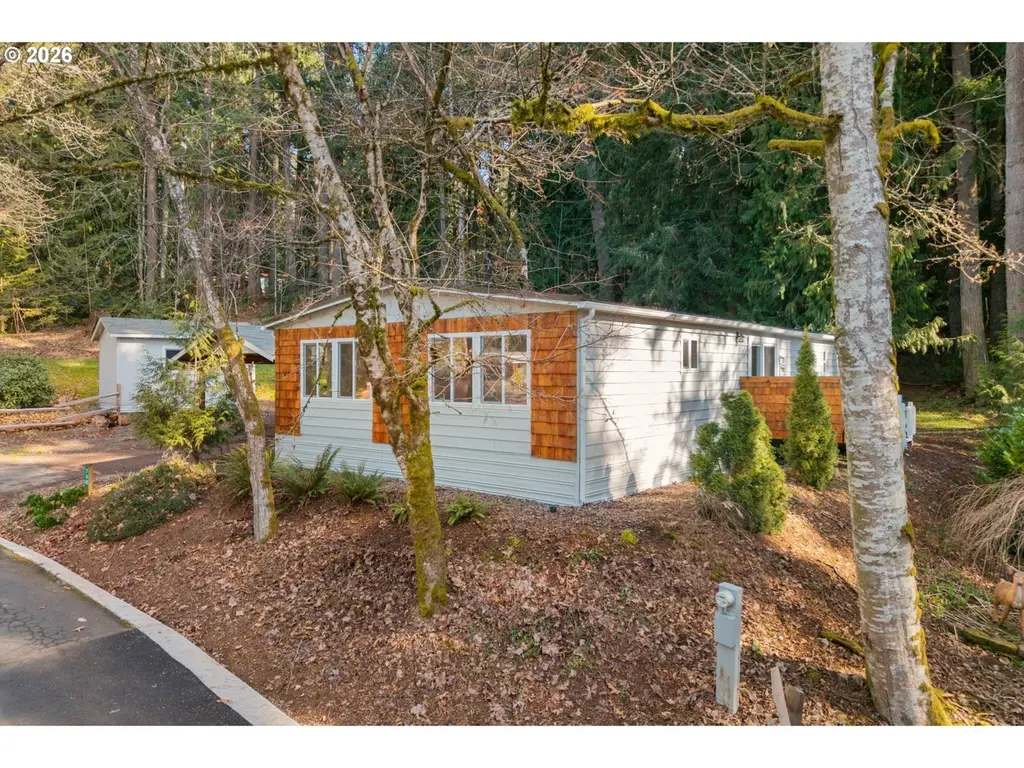
32700 SE Leewood Ln Unit 78B · Boring, OR
Flood risk 1/10 · Minimal
- FEMA flood zone
- X (unshaded)
- Chance of flooding over 30 yrs
- 0.0%
- Est. flood insurance / yr
- $507 – $1,088
Fire risk 5/10 · Moderate
- Est. fire insurance / yr
- $498 – $926
Heat risk 2/10 · Minimal
- Hot days now (above 90°F)
- 7 days/yr
- Hot days in 30 yrs
- 15 days/yr
Wind risk 1/10 · Minimal
- Chance of severe wind over 30 yrs
- —
Air-quality risk 9/10 · Severe
- Unhealthy air days now
- 11 days/yr
- Unhealthy air days in 30 yrs
- 12 days/yr
Risk factors via First Street. Map © Google.
Why this score? — see what drove the B grade
The composite is a weighted blend of 9 inputs, each scored 0–100. Each bar is that input's sub-score; the figure is the points it added to the 100-point composite (weight × sub-score).
- Cash flow +30.0/30.0
- 1% rule +10.0/10.0
- DSCR +10.0/10.0
- ARV discount +7.5/15.0
- Schools +5.0/10.0
- Rent growth +2.5/5.0
- Livability +2.5/5.0
- Condition / age +2.5/5.0
- Appreciation +0.0/10.0
$174,900
🖨 Deal sheet 📄 Offer letter ✓ Due diligence
Listing remarks MLS
Jaw dropping remodeled manufactured home located at Big Valley Woods Mobile Home Park. This beauty has a massive lot! Built in 1975, this home includes 1,708sqft of living space, 3 bed, 2 bath, big living room, dining room, spacious bedrooms, brand new windows, interior and exterior doors, paint, bathroom vanities, floors, ceilings, light fixtures, new kitchen, landscaping & more. Space rent is $890/month. Includes space rent, management, water, sewer, garbage, gym, game room, & snow removal.
Key facts
- Private deck
- Modern flooring
- Oversized yard
Tags
Property features AI
Finance
- Other: Manufacturer: GREAT LAKES; Main level area approximately 1,750
- Financial info: Residential manufactured home in park (land lease applies)
- HOA & community: Located in Big Valley Woods park; Land lease in place (monthly lot rent $1,320; lease expires May 31, 2028)
Exterior
- Parking: Driveway
- Security: Security features unknown
- Utilities: Community water; Public sewer; Cable internet available; Electric service
- Home design: Manufactured home in park; Single‑story living (main level layout); No notable view; Approximately conditioned
- Construction: Built in 1975; Skirting foundation
- Exterior features: Deck; Yard; Metal siding; Level lot; Paved road access
Interior
- Kitchen: Cook island; Free‑standing range; Range hood; Electric hot water
- Bedrooms: Primary bedroom (Main level); Second bedroom; Third bedroom
- Flooring: Laminate flooring
- Bathrooms: 2 full bathrooms (both on main level)
- Heating & cooling: Forced air heating; Heat pump cooling; Electric fuel
- Interior features: High ceilings; Laminate flooring; Laundry area; Double pane windows with vinyl frames; Crawl space basement
- Laundry & utility: Laundry included (on main level)
Neighborhood map
What this means for you Summary
Snapshot
- This is a 3-bed/2.0-bath other listed at $175k.
Deal economics
- At list price, monthly cash flow is $1k ($17k/yr) — positive.
- The deal already cash-flows at list — no discount required.
- Meets the 1% rule at list price ($3k rent vs $175k).
- Recommended offer: $172k (1.5% below list) — sets the bar for market timing.
Location & tenants
- Location reads: area grade B — affects rentability + tenant quality, not the cash-flow math above.
- Oregon Trail SD 46 (town): math 47% / reading 64% proficiency, ranked #12 of 183 in OR (top 7%) — acceptable for families but not a draw, mixed tenant base, ~2y average lease.
- Zoned schools: Naas Elementary School (345 students, 47% FRL); Boring Middle School (405 students, 34% FRL); Sandy High School (1,440 students, 32% FRL) — zoned schools at 38% FRL track the district average.
- Market conditions: 38 active listings in the ZIP; 946 units permitted in Clackamas County in 2024 (188 in 5+ unit buildings).
Forward outlook
- Local home prices are declining (-3.0%/yr); year-one equity from $1k of loan paydown is wiped out by about $5k of value loss. Plan a longer hold.
- Clackamas County population projected at +25% by 2050 — long-run rental-demand tailwind backs the buy-and-hold thesis.
- At projected returns (-3.0% appreciation + 3.0% rent growth), your $49k cash investment doubles in ~4 years — after that, you're playing with house money.
Negotiation context
- It's been on market 17 days — a 2% lower offer ($172k) is reasonable based on typical stale-listing flexibility.
- 3 sale attempts since 6y ago with the ask held roughly flat each time — persistent listings suggest the price (not the market) is what's stuck; bring a comps-based counter.
- Current owner paid $124k; 41% above their basis — modest negotiation headroom, anchor on the comps not their cost.
Risks & watch-outs
- Climate carrying-cost: moderate wildfire risk — expect insurance premiums to compound above CPI over the hold.
Questions for the listing agent
- Built in 1975 — when were the roof, HVAC, electrical panel, plumbing, and water heater last replaced?
- Is there a deadline driving the sale (1031 exchange, divorce, estate, relocation)? That informs how much negotiation room exists.
- What's the average days-on-market for RENTAL listings here right now (not sales)? A rising rental-DOM trend means longer vacancies and softer asking-rent achievability than the comps imply.
- What's the recent tenant-quality profile in this submarket — average credit score on applications, eviction rate, late-payment / NSF rate, and stable-employment percentage? A property-management company in the area should have these aggregated.
- How much new for-sale + rental construction is in the pipeline within 1–3 miles? Heavy new supply typically softens prices + rents 12–24 months out; constrained supply supports both.
Investment metrics
- 1% rule
- 1.79% ✓
- Cap rate
- 16.18%
- Cash-on-cash
- 35.31%
- DSCR
- 2.57
- GRM
- 4.7
CMA / ARV
No comps found within radius.
Projected returns pro-forma
-3.0% appreciation · 3.0% rent growth · sell at horizon
- IRR
- 30.9%
- Equity multiple
- 2.29×
- Total profit
- $63,367
- Equity at exit
- $26,078
- IRR
- 38.1%
- Equity multiple
- 4.53×
- Total profit
- $173,098
- Equity at exit
- $15,122
Cash invested: $48,972 (down + closing). Projections, not guarantees.
Landlord ↔ Tenant lean methodology
- Overall (STATE)
- 28 Tenant-Leaning
- State Oregon
- 28 Tenant-Leaning · D+6
- County
- — inherits STATE
- City
- — inherits STATE
ZIP-level market 97009
- Active inventory
- 38
- Price-to-rent
- 4.7×
Monthly cashflow live
- Estimated rent
- $3,131 medium interval (Pro) →
- Mortgage (P&I)
- −$917
- Tax from tax record
- −$42 /mo · $508/yr
- Insurance
- −$73
- HOA
- −$0
- Vacancy / Maint / Mgmt
- −$657
- Net cashflow
- $1,441
Break-even live
UW: 25.0% down · 7.5% · 30yr · 1.5% tax · 5.0% vac · 8.0% maint · 8.0% mgmt
Financing live
Cash to close
- Down payment
- $43,725
- Closing costs
- $5,247
- Reserves months
- —
- Total cash needed
- —
Loan-product check · same deal, 3 products live
Conventional
25% down · 7.5% · 30yr
- Down + closing
- —
- Monthly P&I
- —
- Monthly cashflow
- —
- DSCR
- —
- Eligible?
- —
Personal DTI + credit; lowest rate.
DSCR
20% down · 8.5% · 30yr
- Down + closing
- —
- Monthly P&I
- —
- Monthly cashflow
- —
- DSCR
- —
- Eligible?
- —
No personal income docs; deal must DSCR.
Hard money
10% down · 12.0% · 12mo
- Down + closing
- —
- Monthly P&I
- —
- Monthly cashflow
- —
- DSCR
- —
- Eligible?
- —
Short-term bridge; refi at stabilization.
Listing history 12 events
-
2026-06-18days on market $174,900 Active 17 DOM
-
2026-06-17days on market $174,900 Active 16 DOM
-
2026-06-16days on market $174,900 Active 15 DOM
-
2026-06-15days on market $174,900 Active 14 DOM
-
2026-06-13days on market $174,900 Active 12 DOM
-
2026-06-13days on market $174,900 Active 11 DOM
-
2026-06-09days on market $174,900 Active 8 DOM
-
2026-06-08days on market $174,900 Active 7 DOM
-
2026-06-07days on market $174,900 Active 6 DOM
-
2026-06-03days on market $174,900 Active 2 DOM
-
2026-06-02remarks 675-char remark
-
2026-06-02$174,900 Active 1 DOM
ⓘ Source: listings_history table (triggers on properties + properties_extension) + one-shot
backfill from property_details.listing_events for pre-trigger history.
Tax reassessment forecast OR · Resets to sale price
- Current annual tax
- $508 · $42/mo
- Projected year-2 tax
- $1,697 · $141/mo
- Expected delta
- +$1,189/yr (+$99/mo · 234.1%)
ⓘ Screening estimate from a state-policy table — verify with the county assessor before closing.
Climate risk First Street
- Flood 1/10 Low FEMA zone X (unshaded) · 0% chance over 30 yrs
- Wildfire 5/10 Major
- Heat 2/10 Low 7 d/yr ≥90°F today · 15 d/yr by 30 yrs out
- Wind 1/10 Low
- Air quality 9/10 Extreme 11 unhealthy d/yr today · 12 by 30 yrs out
Nearby sold comps map
Loading sold comps map…
Walkable amenities ~0.75 mi
Loading nearby amenities…
Taxation est. · year 1
- Rental income
- $37,568
- − Mortgage interest
- −$9,797
- − Property taxes
- −$508
- − Insurance
- −$874
- − Repairs & maintenance
- −$3,005
- − Management
- −$3,005
- − Depreciation
- −$5,088
- Taxable income
- $15,290
- Est. tax owed @ 24.0%
- −$3,670
- After-tax cash flow
- $13,621/yr
For passive investors: Depreciation is non-cash, so a rental often shows a tax loss while cash-flowing — sheltering income. Rental losses are passive: they offset passive income freely, and up to $25,000/yr can offset ordinary (W-2) income if you actively participate and your MAGI is under $100k (phasing out to $0 by $150k); unused losses carry forward. On sale, claimed depreciation is recaptured at up to 25%, and gains may owe capital-gains tax (a 1031 exchange can defer both). Figures are a year-1 estimate at your 24.0% rate — not tax advice; consult a CPA.
Schools (NCES district)
- District
- Oregon Trail SD 46
- NCES district ID
- 4110890
- Math proficiency
- 47% ▬ 0.00%
- Reading proficiency
- 64% ▲ 1.00%
- Median HH income
- $61,406
- Composite
- 50.19/100
- National rank
- #4075
- State rank
- #12 of 183 in OR
Livability — Boring
No livability data for this city. (Only ~50 U.S. cities are tracked.)
Census & demographics
- Population (ZIP)
- 7,877
Population outlook (Clackamas County) Hauer SSP2
- Today (2025)
- 458,456 people
- By 2030
- 485,185 · +5.8%
- By 2040
- 532,932 · +16.2%
- By 2050
- 574,445 · +25.3%
- By 2075
- 665,497 · +45.2%
- By 2100
- 697,488 · +52.1%
Race, ethnicity, and origin ACS 2023
- Neighborhood character
- Predominantly White (73%)
- Race & ethnicity
- White 73% Hispanic / Latino 18% Two or more races 14% Asian 1%
- Hispanic origin (detail)
- Mexican 14%
- Common ancestry
- Portuguese 3% Slovak 3% Iranian 2%
- Foreign-born
- 4% · Canada, China
- Languages at home
- 91% English-only · Spanish 7% Other Indo-European 2%
Political lean MEDSL · Clackamas
- 2024 margin
- Lean D (+9.7) · D 53.4% · R 43.6% · Other 3.0%
- 2008→2024 swing
- -0.6pp no change · 2008: 10.4pp · 2024: 9.7pp
- All cycles
- 2024: D+9.7 2020: D+11.1 2016: D+6.1 2012: D+3.5 2008: D+10.4
Not yet ingested
- Civics
- —
Market trends
- HPI YoY
- ▼ -238.15%
- Current HPI
- 307.0405
- Rent YoY
- —
- Metro
- —
- State GDP YoY
- ▲ 2.05%
- F500 in state
- 2
Industry mix (Fortune 500 HQ in OR)
| Industry | F500 HQs | Revenue |
|---|---|---|
| Consumer Goods | 1 | $51B |
|
||
Price history
+39.9% since first listed6 events — show timeline
- 2026-06-01 Listed $174,900 RMLS
- 2020-09-04 Sold (MLS) $124,400 RMLS
- 2020-08-27 Pending — RMLS
- 2020-08-12 Relisted — RMLS
- 2020-08-01 Pending — RMLS
- 2020-07-03 Listed $125,000 RMLS
Property tax history
+5.3%/yrLatest (2025): $508 · +4.6% YoY. Source: county tax records.
Cash-flow waterfall
monthlySold comps — $/sqft
last 12 mo · ≤1 miLoading sold comps…