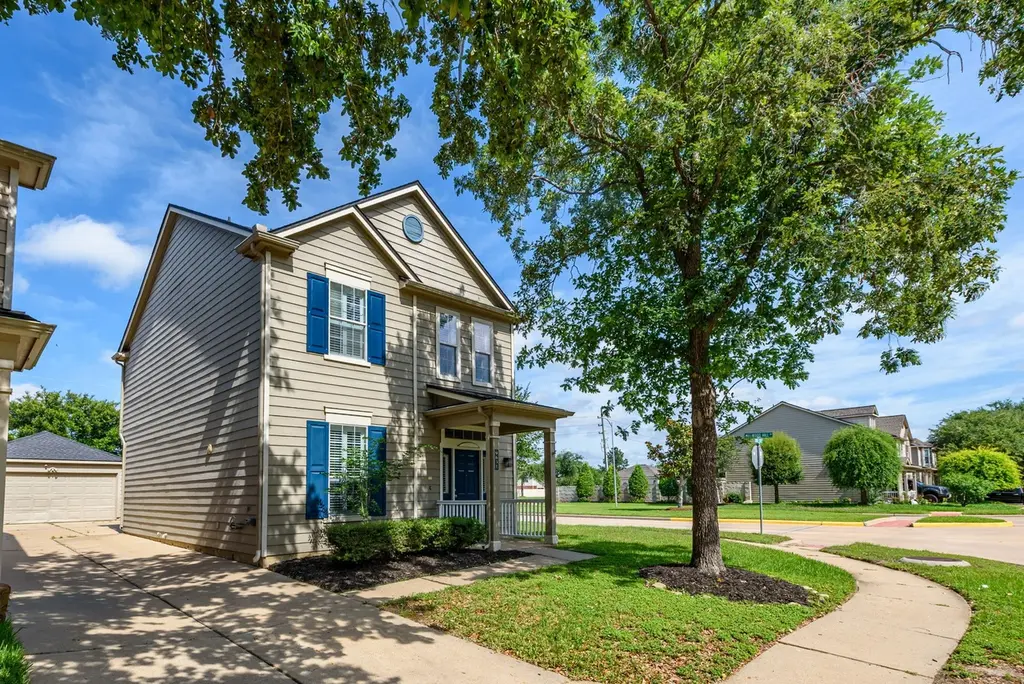
9631 Coyote Creek Dr · Houston, TX
Flood risk 4/10 · Minor
- FEMA flood zone
- X (unshaded)
- Chance of flooding over 30 yrs
- 0.22%
- Est. flood insurance / yr
- $507 – $1,088
Fire risk 1/10 · Minimal
- Est. fire insurance / yr
- $1,222 – $2,270
Heat risk 9/10 · Severe
- Hot days now (above 110°F)
- 7 days/yr
- Hot days in 30 yrs
- 23 days/yr
Wind risk 8/10 · Major
- Chance of severe wind over 30 yrs
- 99.0%
Air-quality risk 2/10 · Minimal
- Unhealthy air days now
- 2 days/yr
- Unhealthy air days in 30 yrs
- 2 days/yr
Risk factors via First Street. Map © Google.
Why this score? — see what drove the D grade
The composite is a weighted blend of 9 inputs, each scored 0–100. Each bar is that input's sub-score; the figure is the points it added to the 100-point composite (weight × sub-score).
- ARV discount +10.3/15.0
- Cash flow +7.2/30.0
- Appreciation +4.5/10.0
- Schools +4.4/10.0
- Livability +3.7/5.0
- 1% rule +3.1/10.0
- Rent growth +3.0/5.0
- Condition / age +2.5/5.0
- DSCR +1.4/10.0
$219,000
🖨 Deal sheet (PDF) 📄 Offer letter ✓ Due diligence
Listing remarks
Welcome to luxury living in the highly sought-after Stone Gate golf course community! This beautifully updated corner-lot townhouse/condo offers the privacy of a stand-alone home with its own driveway and detached 2-car garage. Featuring 2 spacious bedrooms and 2.5 baths, this elegant residence showcases fresh modern updates including new luxury vinyl flooring throughout, recent remodeling, and professional touch-ups after tenant move-out. A new roof installed in 2023 adds exceptional value and peace of mind. The open-concept living space is filled with natural light, creating a warm and inviting atmosphere perfect for both relaxing and entertaining. All bedrooms are conveniently located up
Key facts
- Corner-lot townhouse
- New roof installed
- Prime location
Tags
Property features AI
Finance
- Other: Lease not considered
- HOA & community: Stone Gate Owners Association; Association fee $1,290 annually
Exterior
- Parking: Detached garage; 2 garage spaces
- Utilities: Public water; Public sewer
- Home design: Residential property; Built in 2004; Slab foundation; Composition roof
- Construction: Vinyl siding construction
- Exterior features: Corner lot
Interior
- Kitchen: Dishwasher; Disposal; Gas oven; Gas range; Microwave
- Bedrooms: Primary bedroom on the second level (approx. 12 x 12); Bedroom on the second level (approx. 11 x 10)
- Bathrooms: 2 full bathrooms; 1 half bathroom
- Heating & cooling: Central heating (gas); Central electric air conditioning
- Interior features: Laminate counters; Seller provided disclosure available
- Laundry & utility: Washer hookup; Electric dryer hookup; Gas dryer hookup
Neighborhood map
What this means for you Summary
Snapshot
- This is a 2-bed/2.5-bath single-family listed at $219k.
Deal economics
- At list price, monthly cash flow is $-301 ($-4k/yr) — negative.
- To cash-flow at today's rent, offer at most $166k (24.3% below list).
- To meet the 1% rule (rent ≥ 1% of price), the offer needs to be $178k (18.9% below list).
- Recommended offer: $166k (24.3% below list) — sets the bar for cash-flow.
- Cap rate 4.6% vs local median 3.2% in Houston — top-decile yield for the area; either an underpriced asset or a hidden risk that comps aren't pricing in. Stress-test before assuming the spread holds.
Location & tenants
- Location reads 74/100 on livability (#184 in TX, #4,771 nationally) — a middle-class / working-renter tenant base. Strengths: amenities A+, cost of living A+, housing A+; Watch: crime F.
- Cypress-Fairbanks ISD (suburban): math 45% / reading 52% proficiency, ranked #161 of 826 in TX (top 20%) — families likely to look elsewhere, expect single-tenant / working-renter base with shorter leases.
- Zoned schools: Aragon Middle (math 55% / reading 58%, grade B, #226 of 1,662 statewide, top 14%, 1,534 students, 47% FRL); Langham Creek H S (math 56% / reading 65%, grade C+, #268 of 1,632 statewide, top 17%, 2,781 students, 56% FRL).
- Market conditions: Rents rising (+2.1%/yr); 330 active listings in the ZIP; 15 comparable units currently listed for rent nearby; rentals at typical pace (median 25d on market — plan ~3-4 weeks tenant-placement turnaround); solid renter incomes; 29,883 units permitted in Harris County in 2024 (8,621 in 5+ unit buildings).
Forward outlook
- Local home prices are declining (-0.9%/yr); year-one equity from $2k of loan paydown is wiped out by about $2k of value loss. Plan a longer hold.
- Harris County population projected at +47% by 2050 — long-run rental-demand tailwind backs the buy-and-hold thesis.
Negotiation context
- It's been on market 19 days — a 2% lower offer ($216k) is reasonable based on typical stale-listing flexibility.
- 4 sale attempts since 10y ago with the ask held roughly flat each time — persistent listings suggest the price (not the market) is what's stuck; bring a comps-based counter.
Risks & watch-outs
- Climate carrying-cost: severe wind risk, 99% chance of damaging wind over 30y; extreme-heat days projected 7→23/yr by 2055 (HVAC capex compounding) — expect insurance premiums to compound above CPI over the hold.
Questions for the listing agent
- What do current leases actually rent for vs. the listed asking? Can we see a recent rent roll and the last 12 months of T-12 income?
- What does the HOA fee cover, when was the last increase, and are there any pending special assessments or reserve-fund shortfalls?
- Is there a deadline driving the sale (1031 exchange, divorce, estate, relocation)? That informs how much negotiation room exists.
- Schools are D-rated, which usually means shorter tenancies and higher turnover. Who's the typical renter profile here, and what's been the actual vacancy rate?
- Crime grade is F in this area — have there been break-ins, vandalism, or insurance claims at this property in the last 3 years? What carrier currently insures it and at what premium?
- The area grade is low — what's the realistic commute time and amenity access for the typical tenant pool here? Any planned neighborhood developments (good or bad) we should know about?
- What's the average days-on-market for RENTAL listings here right now (not sales)? A rising rental-DOM trend means longer vacancies and softer asking-rent achievability than the comps imply.
- What's the recent tenant-quality profile in this submarket — average credit score on applications, eviction rate, late-payment / NSF rate, and stable-employment percentage? A property-management company in the area should have these aggregated.
- How much new for-sale + rental construction is in the pipeline within 1–3 miles? Heavy new supply typically softens prices + rents 12–24 months out; constrained supply supports both.
Investment metrics
- 1% rule
- 0.81% ✗
- Cap rate
- 4.64%
- Cash-on-cash
- -5.89%
- DSCR
- 0.74
- GRM
- 10.3
CMA / ARV
- ARV (median comp)
- $233,306
- List price
- $219,000
- Delta
- -6.13%
- Verdict
- FAIR
- Comps
- 20 within 1.0 mi
Show comp detail 12 sales within ~0.75 mi
| Address | Dist | Beds/Ba | Sqft | Sold | Price | $/sf | Match |
|---|---|---|---|---|---|---|---|
| 16743 Libson Falls Dr | 0.15mi | 3/2.5 (+1) | 1,540 (0%) | 1mo | $219,990 | $143 | 88 |
| 16707 Pine Castle Dr | 0.17mi | 2/2.5 | 1,540 (0%) | 10mo | $225,000 | $146 | 84 |
| 17023 Sperry Landing Dr | 0.22mi | 3/2.0 (+1) | 1,523 (-1%) | 2mo | $250,000 | $164 | 79 |
| 16726 Libson Falls Dr | 0.17mi | 3/2.5 (+1) | 1,487 (-3%) | 9mo | $229,900 | $155 | 74 |
| 16750 Libson Falls Dr | 0.13mi | 3/2.5 (+1) | 1,440 (-6%) | 7mo | $195,000 | $135 | 72 |
| 16414 Mesa Point Dr | 0.26mi | 3/2.0 (+1) | 1,590 (+3%) | 5mo | $300,000 | $189 | 72 |
| 16527 Aberdeen Green Dr | 0.44mi | 3/2.0 (+1) | 1,495 (-3%) | 3mo | $279,900 | $187 | 66 |
| 16542 Whitaker Creek Dr | 0.54mi | 3/2.0 (+1) | 1,500 (-3%) | 4mo | $270,000 | $180 | 60 |
| 16607 Berkshire Forest Dr | 0.49mi | 3/2.0 (+1) | 1,698 (+10%) | 3mo | $269,999 | $159 | 51 |
| 9210 Taftsberry Dr | 0.36mi | 3/2.0 (+1) | 1,693 (+10%) | 11mo | $290,000 | $171 | 50 |
| 16534 Whitaker Creek Dr | 0.55mi | 3/2.0 (+1) | 1,737 (+13%) | 3mo | $277,900 | $160 | 44 |
| 9202 Aberdeen Lake Dr | 0.68mi | 3/2.0 (+1) | 1,645 (+7%) | 8mo | $253,000 | $154 | 43 |
Match score weights: distance 35% · size 25% · config 20% · recency 20%. Top-matched comps best support the ARV.
Projected returns pro-forma
-0.94% appreciation · 2.1% rent growth · sell at horizon
- IRR
- -14.0%
- Equity multiple
- 0.40×
- Total profit
- $-36,566
- Equity at exit
- $53,438
- IRR
- -8.1%
- Equity multiple
- 0.28×
- Total profit
- $-43,964
- Equity at exit
- $56,604
Cash invested: $61,320 (down + closing). Projections, not guarantees.
Landlord ↔ Tenant lean methodology
- Overall (STATE)
- 87 Strongly Landlord-Friendly
- State Texas
- 87 Strongly Landlord-Friendly · R+5
- County
- — inherits STATE
- City
- — inherits STATE
ZIP-level market 77095
- Home prices YoY
- -0.4%
- Rents YoY
- 2.1%
- Active inventory
- 330
- Price-to-rent
- 10.3×
Monthly cashflow live
- Estimated rent
- $1,777 high interval (Pro) →
- Mortgage (P&I)
- −$1,148
- Tax from tax record
- −$357 /mo · $4,285/yr
- Insurance
- −$91
- HOA
- −$108
- Vacancy / Maint / Mgmt
- −$373
- Net cashflow
- $-301
Break-even live
Sensitivity live
| Price | -10% $-177 | -5% $-239 | +0% $-301 | +5% $-363 | +10% $-425 |
|---|---|---|---|---|---|
| Rent | -10% $-441 | -5% $-371 | +0% $-301 | +5% $-231 | +10% $-161 |
| Rate | -1.0pp $-191 | -0.5pp $-245 | base $-301 | +0.5pp $-358 | +1.0pp $-415 |
UW: 25.0% down · 7.5% · 30yr · 1.5% tax · 5.0% vac · 8.0% maint · 8.0% mgmt
Financing live
Cash to close
- Down payment
- $54,750
- Closing costs
- $6,570
- Reserves months
- —
- Total cash needed
- —
Loan-product check · same deal, 3 products live
Conventional
25% down · 7.5% · 30yr
- Down + closing
- —
- Monthly P&I
- —
- Monthly cashflow
- —
- DSCR
- —
- Eligible?
- —
Personal DTI + credit; lowest rate.
DSCR
20% down · 8.5% · 30yr
- Down + closing
- —
- Monthly P&I
- —
- Monthly cashflow
- —
- DSCR
- —
- Eligible?
- —
No personal income docs; deal must DSCR.
Hard money
10% down · 12.0% · 12mo
- Down + closing
- —
- Monthly P&I
- —
- Monthly cashflow
- —
- DSCR
- —
- Eligible?
- —
Short-term bridge; refi at stabilization.
Rent comps 15 comps
| Address | Beds | Baths | Sqft | Rent | $/sqft | DOM | Units | Dist |
|---|---|---|---|---|---|---|---|---|
| 9714 Coyote Creek Dr Houston, TX | 3.0 | 2.5 | 1440 | $1,725 | $1.20 | 44d | 1 | 0.04mi |
| 16606 Aberdeen Green Dr Houston, TX | 3.0 | 2.0 | 1450 | $1,400 | $0.97 | 24d | 1 | 0.41mi |
| 10118 Heron Meadows Dr Houston, TX | 3.0 | 2.0 | 1816 | $2,400 | $1.32 | 44d | 1 | 0.52mi |
| 10202 Peridot Cv Houston, TX | 3.0 | 2.0 | 1740 | $2,100 | $1.21 | 13d | 1 | 0.85mi |
| 17307 Meria Coves Dr Houston, TX | 3.0 | 2.0 | 1740 | $1,595 | $0.92 | 24d | 1 | 0.96mi |
| 8300 Queenston Blvd Houston, TX | 1.0–2.0 | 1.0–2.0 | 973 | $2,424 | $2.49 | 13d | 1 | 0.96mi |
| 10414 Falling River Dr Houston, TX | 3.0 | 2.0 | 1740 | $2,045 | $1.18 | 44d | 1 | 1.04mi |
| 18100 West Rd Houston, TX | 3.0 | 1.0–2.5 | 1228 | $2,158 | $1.76 | 2d | 48 | 1.11mi |
| 9777 Barker Cypress Rd Cypress, TX | 2.0 | 2.0 | 1226 | $1,939 | $1.58 | 24d | 1 | 1.14mi |
| 17807 Lakecrest View Dr Unit 3112 Cypress, TX | 3.0 | 2.0 | 1354 | $1,977 | $1.46 | 3d | 1 | 1.21mi |
| 17807 Lakecrest View Dr Unit 17840 Cypress, TX | 3.0 | 2.0 | 1354 | $2,020 | $1.49 | 44d | 1 | 1.21mi |
| 17807 Lakecrest View Dr Unit 3174 Cypress, TX | 3.0 | 2.0 | 1354 | $2,009 | $1.48 | 10d | 1 | 1.21mi |
| 17813 Lakecrest View Dr Cypress, TX | 3.0 | 3.0 | 1354 | $1,969 | $1.45 | 44d | 1 | 1.25mi |
| 8559 Spring Green Dr Houston, TX | 3.0 | 2.0 | 1751 | $1,749 | $1.00 | 3d | 1 | 1.30mi |
| 15715 Tuckerton Rd Unit 510 Houston, TX | 3.0 | 2.0 | 1527 | $1,682 | $1.10 | 3d | 1 | 1.45mi |
HOA detail
- Monthly dues
- $108 · $1,296/yr
Listing history 18 events
-
2026-06-03days on market $219,000 Pending 19 DOM
-
2026-06-02days on market $219,000 Pending 18 DOM
-
2026-06-01days on market $219,000 Pending 17 DOM
-
2026-05-31days on market $219,000 Pending 16 DOM
-
2026-05-15$219,000 Active 932-char remark
-
2025-05-15historical $1,750
-
2025-03-13price $1,750
-
2025-01-16price $1,835
-
2024-11-02$1,850
-
2023-12-06historical $1,700
-
2023-11-12$1,700
-
2016-10-24soldstatus
-
2016-09-02soldstatus
-
2016-09-01soldstatus Sold
-
2016-08-30status Pending
-
2016-08-21status Option Pending
-
2016-08-13$142,000 Active
-
2007-12-03soldstatus
ⓘ Source: listings_history table (triggers on properties + properties_extension) + one-shot
backfill from property_details.listing_events for pre-trigger history.
Tax reassessment forecast TX · Resets to sale price
- Current annual tax
- $4,285 · $357/mo
- Projected year-2 tax
- $4,285 · $357/mo
- Expected delta
- $0/yr ($0/mo · 0.0%)
ⓘ Screening estimate from a state-policy table — verify with the county assessor before closing.
Climate risk First Street
- Flood 4/10 Moderate FEMA zone X (unshaded) · 22% chance over 30 yrs
- Wildfire 1/10 Low
- Heat 9/10 Extreme 7 d/yr ≥110°F today · 23 d/yr by 30 yrs out
- Wind 8/10 Severe 99% chance of damaging wind over 30 yrs
- Air quality 2/10 Low 2 unhealthy d/yr today · 2 by 30 yrs out
Nearby sold comps map
Loading sold comps map…
Walkable amenities ~0.75 mi
Loading nearby amenities…
Taxation est. · year 1
- Rental income
- $21,324
- − Mortgage interest
- −$12,267
- − Property taxes
- −$4,285
- − Insurance
- −$1,095
- − Repairs & maintenance
- −$1,706
- − Management
- −$1,706
- − HOA
- −$1,296
- − Depreciation
- −$6,371
- Taxable loss
- −$7,402
- Est. tax savings @ 24.0%
- +$1,776
- After-tax cash flow
- $-1,835/yr
For passive investors: Depreciation is non-cash, so a rental often shows a tax loss while cash-flowing — sheltering income. Rental losses are passive: they offset passive income freely, and up to $25,000/yr can offset ordinary (W-2) income if you actively participate and your MAGI is under $100k (phasing out to $0 by $150k); unused losses carry forward. On sale, claimed depreciation is recaptured at up to 25%, and gains may owe capital-gains tax (a 1031 exchange can defer both). Figures are a year-1 estimate at your 24.0% rate — not tax advice; consult a CPA.
Schools (NCES district)
- District
- Cypress-Fairbanks ISD
- NCES district ID
- 4816110
- Math proficiency
- 45% ▼ -12.00%
- Reading proficiency
- 52% ▼ -2.00%
- Median HH income
- $72,025
- Composite
- 43.63/100
- National rank
- #2968
- State rank
- #161 of 826 in TX
Livability — Houston
- Score
- 74/100
- State rank
- #184
- US rank
- #4771
Category grades
Schools grade is shown separately in the Schools card above.
Census & demographics
- County
- Harris County · 4,702,590 people
- City population
- 3,226,434
- Metro
- Houston-The Woodlands-Sugar Land, TX
- Population (ZIP)
- 69,767
- Household income
- $91,594
- Rent vs Own
- Severe rent burden
- 1870.0
Population outlook (Harris County) Hauer SSP2
- Today (2025)
- 5,571,493 people
- By 2030
- 6,089,821 · +9.3%
- By 2040
- 7,142,806 · +28.2%
- By 2050
- 8,185,864 · +46.9%
- By 2075
- 10,574,329 · +89.8%
- By 2100
- 12,109,958 · +117.4%
Race, ethnicity, and origin ACS 2023
- Neighborhood character
- Highly diverse neighborhood (Simpson 0.73)
- Race & ethnicity
- White 39% Hispanic / Latino 28% Two or more races 18% Black 16% Asian 12%
- Hispanic origin (detail)
- Mexican 16% Cuban 2%
- Common ancestry
- Italian 2% Romanian 2% Lithuanian 1%
- Foreign-born
- 25% · Canada, Vietnam, Jamaica
- Languages at home
- 66% English-only · Spanish 19% Vietnamese 5% Arabic 3%
Political lean MEDSL · Harris
- 2024 margin
- Lean D (+5.5) · D 52.0% · R 46.4% · Other 1.6%
- 2008→2024 swing
- +3.9pp toward D · 2008: 1.6pp · 2024: 5.5pp
- All cycles
- 2024: D+5.5 2020: D+13.3 2016: D+12.4 2012: D+0.1 2008: D+1.6
Not yet ingested
- Civics
- —
Market trends
- HPI YoY
- ▼ -0.94%
- Current HPI
- 236.0249
- Rent YoY
- ▲ 2.10%
- Metro
- Houston-The Woodlands-Sugar Land, TX
- State GDP YoY
- ▲ 3.95%
- F500 in state
- 110
Industry mix (Fortune 500 HQ in TX)
| Industry | F500 HQs | Revenue |
|---|---|---|
| Energy | 16 | $1,198B |
|
||
| Technology | 5 | $198B |
|
||
| Engineering / Construction | 4 | $72B |
|
||
| Energy Services | 3 | $60B |
|
||
| Utilities | 3 | $41B |
|
||
| Healthcare | 2 | $330B |
|
||
Price history
+54.2% since first listed16 events — show timeline
- 2026-06-04 Pending — HARMLS
- 2026-05-27 Pending — HARMLS
- 2026-05-15 Listed $219,000 HARMLS
- 2025-05-15 Rental Removed $1,750 HARMLS
- 2025-03-13 Price Changed $1,750 HARMLS
- 2025-01-16 Price Changed $1,835 HARMLS
- 2024-11-02 Listed for Rent $1,850 HARMLS
- 2023-12-06 Rental Removed $1,700 HARMLS
- 2023-11-12 Listed for Rent $1,700 HARMLS
- 2016-10-24 Sold (Public Records) — Public Records
- 2016-09-02 Sold (Public Records) — Public Records
- 2016-09-01 Sold (MLS) — HARMLS
- 2016-08-30 Pending — HARMLS
- 2016-08-21 Pending — HARMLS
- 2016-08-13 Listed $142,000 HARMLS
- 2007-12-03 Sold (Public Records) — Public Records
Property tax history
+1.5%/yrLatest (2025): $4,285 · -5.5% YoY. Source: county tax records.
Cash-flow waterfall
monthlySold comps — $/sqft
last 12 mo · ≤1 miLoading sold comps…