1228 Calamian Dr · Fort Worth, TX
Flood risk No data
- FEMA flood zone
- —
- Chance of flooding over 30 yrs
- —
- Est. flood insurance / yr
- —
Fire risk No data
- Est. fire insurance / yr
- —
Heat risk No data
- Hot days now (above threshold)
- —
- Hot days in 30 yrs
- —
Wind risk No data
- Chance of severe wind over 30 yrs
- —
Air-quality risk No data
- Unhealthy air days now
- —
- Unhealthy air days in 30 yrs
- —
Risk factors via First Street. Map © Google.
Why this score? — see what drove the D- grade
The composite is a weighted blend of 9 inputs, each scored 0–100. Each bar is that input's sub-score; the figure is the points it added to the 100-point composite (weight × sub-score).
- Cash flow +14.2/30.0
- ARV discount +7.5/15.0
- DSCR +4.3/10.0
- Livability +4.0/5.0
- Rent growth +3.1/5.0
- 1% rule +3.0/10.0
- Schools +2.5/10.0
- Condition / age +1.0/5.0
- Appreciation +0.0/10.0
$253,199
🖨 Deal sheet (PDF) 📄 Offer letter ✓ Due diligence
Listing remarks
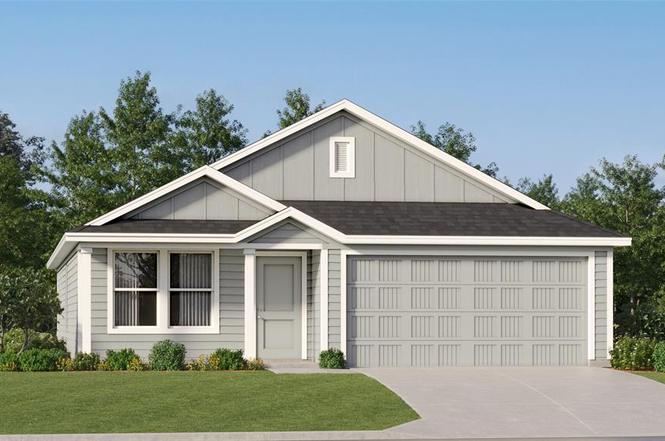
This single-level home showcases a spacious open floorplan shared between the kitchen, dining area and family room for easy entertaining. An owner’s suite enjoys a private location in a rear corner of the home, complemented by an en-suite bathroom and walk-in closet. There are three secondary bedrooms at the front of the home, which are comfortable spaces for household members and overnight guests.
Key facts
- Walk-in closet
- Open floorplan
- Secondary bedrooms
Tags
Neighborhood map
What this means for you Summary
Snapshot
- This is a 3-bed/2.0-bath other listed at $253k. Condition is rated poor.
Deal economics
- At list price, monthly cash flow is $40 ($476/yr) — positive.
- The deal already cash-flows at list — no discount required.
- To meet the 1% rule (rent ≥ 1% of price), the offer needs to be $203k (19.7% below list).
- Recommended offer: $203k (19.7% below list) — sets the bar for 1% rule.
- Cap rate 6.5% vs local median 3.9% in Fort Worth — top-decile yield for the area; either an underpriced asset or a hidden risk that comps aren't pricing in. Stress-test before assuming the spread holds.
Location & tenants
- Location reads 80/100 on livability (#49 in TX, #1,954 nationally) — a professional / high-income tenant draw. Strengths: amenities A+, cost of living A+, housing A+; Watch: crime F.
- Crowley ISD (urban): math 23% / reading 32% proficiency, ranked #643 of 826 in TX (top 78%) — low school quality limits family demand, transient renter base, plan for 1-2y turnover.
- Zoned schools: David L Walker Elt (math 12% / reading 22%, grade F, #3,836 of 4,322 statewide, top 91%, 417 students, 87% FRL); H F Stevens Middle (math 16% / reading 26%, grade F, #1,387 of 1,662 statewide, top 85%, 747 students, 84% FRL); Crowley H S (math 23% / reading 36%, grade F, #1,112 of 1,632 statewide, top 70%, 2,351 students, 72% FRL) — zoned schools average 81% FRL vs 52% district-wide (29 pts higher); higher-poverty schools than district average — tighter screening recommended.
- Market conditions: Rents rising (+2.3%/yr); 123 active listings in the ZIP; 26 comparable units currently listed for rent nearby; rentals at typical pace (median 27d on market — plan ~3-4 weeks tenant-placement turnaround); 18,938 units permitted in Tarrant County in 2024 (8,336 in 5+ unit buildings).
- This rent runs 34% of the median local income ($71k/yr) — at the standard rent-burdened threshold; future hikes will face affordability resistance.
Forward outlook
- Local home prices are declining (-3.0%/yr); year-one equity from $2k of loan paydown is wiped out by about $8k of value loss. Plan a longer hold.
- Tarrant County population projected at +41% by 2050 — long-run rental-demand tailwind backs the buy-and-hold thesis.
Negotiation context
- Only 7 days on market — expect competitive offers; lowballing is unlikely to land.
Questions for the listing agent
- Have any recent inspections been done? Can we get a copy of the seller's disclosures and any deferred-maintenance estimates?
- What does the HOA fee cover, when was the last increase, and are there any pending special assessments or reserve-fund shortfalls?
- Is there a deadline driving the sale (1031 exchange, divorce, estate, relocation)? That informs how much negotiation room exists.
- Schools are D-rated, which usually means shorter tenancies and higher turnover. Who's the typical renter profile here, and what's been the actual vacancy rate?
- Crime grade is F in this area — have there been break-ins, vandalism, or insurance claims at this property in the last 3 years? What carrier currently insures it and at what premium?
- The area grade is low — what's the realistic commute time and amenity access for the typical tenant pool here? Any planned neighborhood developments (good or bad) we should know about?
- What's the average days-on-market for RENTAL listings here right now (not sales)? A rising rental-DOM trend means longer vacancies and softer asking-rent achievability than the comps imply.
- What's the recent tenant-quality profile in this submarket — average credit score on applications, eviction rate, late-payment / NSF rate, and stable-employment percentage? A property-management company in the area should have these aggregated.
- How much new for-sale + rental construction is in the pipeline within 1–3 miles? Heavy new supply typically softens prices + rents 12–24 months out; constrained supply supports both.
Investment metrics
- 1% rule
- 0.80% ✗
- Cap rate
- 6.48%
- Cash-on-cash
- 0.67%
- DSCR
- 1.03
- GRM
- 10.4
CMA / ARV
No comps found within radius.
Projected returns pro-forma
-3.0% appreciation · 2.3% rent growth · sell at horizon
- IRR
- -16.0%
- Equity multiple
- 0.44×
- Total profit
- $-40,009
- Equity at exit
- $37,753
- IRR
- -8.8%
- Equity multiple
- 0.47×
- Total profit
- $-37,677
- Equity at exit
- $21,892
Cash invested: $70,896 (down + closing). Projections, not guarantees.
Landlord ↔ Tenant lean methodology
- Overall (STATE)
- 87 Strongly Landlord-Friendly
- State Texas
- 87 Strongly Landlord-Friendly · R+5
- County
- — inherits STATE
- City
- — inherits STATE
ZIP-level market 76134
- Home prices YoY
- -6.9%
- Rents YoY
- 2.3%
- Active inventory
- 123
- Price-to-rent
- 10.4×
Monthly cashflow live
- Estimated rent
- $2,034 high interval (Pro) →
- Mortgage (P&I)
- −$1,328
- Tax from tax record
- −$92 /mo · $1,099/yr
- Insurance
- −$105
- HOA
- −$42
- Vacancy / Maint / Mgmt
- −$427
- Net cashflow
- $40
Break-even live
Sensitivity live
| Price | -10% $183 | -5% $111 | +0% $40 | +5% $-32 | +10% $-104 |
|---|---|---|---|---|---|
| Rent | -10% $-121 | -5% $-41 | +0% $40 | +5% $120 | +10% $200 |
| Rate | -1.0pp $167 | -0.5pp $104 | base $40 | +0.5pp $-26 | +1.0pp $-93 |
UW: 25.0% down · 7.5% · 30yr · 1.5% tax · 5.0% vac · 8.0% maint · 8.0% mgmt
Financing live
Cash to close
- Down payment
- $63,300
- Closing costs
- $7,596
- Reserves months
- —
- Total cash needed
- —
Loan-product check · same deal, 3 products live
Conventional
25% down · 7.5% · 30yr
- Down + closing
- —
- Monthly P&I
- —
- Monthly cashflow
- —
- DSCR
- —
- Eligible?
- —
Personal DTI + credit; lowest rate.
DSCR
20% down · 8.5% · 30yr
- Down + closing
- —
- Monthly P&I
- —
- Monthly cashflow
- —
- DSCR
- —
- Eligible?
- —
No personal income docs; deal must DSCR.
Hard money
10% down · 12.0% · 12mo
- Down + closing
- —
- Monthly P&I
- —
- Monthly cashflow
- —
- DSCR
- —
- Eligible?
- —
Short-term bridge; refi at stabilization.
Rent comps 26 comps
| Address | Beds | Baths | Sqft | Rent | $/sqft | DOM | Units | Dist |
|---|---|---|---|---|---|---|---|---|
| 605 Hidden Dale Dr Fort Worth, TX | 3.0 | 2.0 | 1161 | $1,875 | $1.61 | 45d | 1 | 0.44mi |
| 517 Misty Mountain Dr Fort Worth, TX | 3.0 | 2.0 | 1342 | $2,050 | $1.53 | 0d | 1 | 0.53mi |
| 10009 Quail Glen Dr Fort Worth, TX | 3.0 | 2.0 | 1130 | $1,795 | $1.59 | 45d | 1 | 0.63mi |
| 10600 Bilsky Bay Dr Fort Worth, TX | 1.0–3.0 | 1.0–2.0 | 914 | $1,765 | $1.93 | 26d | 24 | 0.93mi |
| 10600 Bilsky Bay Dr Fort Worth, TX | 1.0–2.0 | 1.0–2.0 | 762 | $1,409 | $1.85 | 0d | 13 | 0.93mi |
| 220 Elk Run Dr Fort Worth, TX | 3.0 | 2.0 | 1781 | $1,965 | $1.10 | 17d | 1 | 0.94mi |
| 10905 Fawn Valley Dr Fort Worth, TX | 3.0 | 2.0 | 1796 | $1,885 | $1.05 | 7d | 1 | 1.05mi |
| 9100 Cranwell Ct Fort Worth, TX | 3.0 | 2.5 | 1748 | $1,950 | $1.12 | 26d | 1 | 1.13mi |
| 10516 Park City Trl Fort Worth, TX | 3.0 | 2.0 | 1528 | $1,799 | $1.18 | 1d | 1 | 1.16mi |
| 205 Crescent Ridge Dr Fort Worth, TX | 3.0 | 2.5 | 1866 | $2,010 | $1.08 | 4d | 1 | 1.19mi |
| 212 Crescent Ridge Dr Fort Worth, TX | 4.0 | 2.0 | 1545 | $2,130 | $1.38 | 45d | 1 | 1.21mi |
| 720 Watson Way Crowley, TX | 3.0 | 2.0 | 1782 | $2,095 | $1.18 | 45d | 1 | 1.25mi |
| 1804 Lincolnshire Way Fort Worth, TX | 3.0 | 2.5 | 1496 | $1,850 | $1.24 | 7d | 1 | 1.26mi |
| 744 Walls Blvd Crowley, TX | 4.0 | 2.0 | 1792 | $2,300 | $1.28 | 45d | 1 | 1.29mi |
| 10512 Flagstaff Run Fort Worth, TX | 4.0 | 2.0 | 1500 | $1,865 | $1.24 | 1d | 1 | 1.31mi |
| 10512 Flagstaff Run Fort Worth, TX | 4.0 | 2.0 | 1500 | $1,865 | $1.24 | 9d | 1 | 1.31mi |
| 9004 Willoughby Ct Fort Worth, TX | 3.0 | 2.0 | 1430 | $2,015 | $1.41 | 0d | 1 | 1.32mi |
| 10540 Flagstaff Run Fort Worth, TX | 3.0 | 2.5 | 1808 | $1,950 | $1.08 | 14d | 1 | 1.33mi |
| 10540 Flagstaff Run Fort Worth, TX | 3.0 | 2.5 | 1808 | $1,975 | $1.09 | 26d | 1 | 1.33mi |
| 752 Rutherford Dr Crowley, TX | 4.0 | 2.0 | 1856 | $2,209 | $1.19 | 45d | 1 | 1.34mi |
| 1812 Hunting Green Dr Fort Worth, TX | 3.0 | 2.0 | 1402 | $1,985 | $1.42 | 45d | 1 | 1.38mi |
| 1253 Rosedale Springs Ln Fort Worth, TX | 4.0 | 2.0 | 1757 | $2,000 | $1.14 | 14d | 1 | 1.39mi |
| 708 Cheryl St Crowley, TX | 3.0 | 2.0 | 1659 | $2,100 | $1.27 | 20d | 1 | 1.44mi |
| 8457 Asheville Ln Fort Worth, TX | 4.0 | 2.0 | 1796 | $2,049 | $1.14 | 45d | 1 | 1.45mi |
| 625 Hutchins Dr Crowley, TX | 3.0 | 2.0 | 1357 | $1,885 | $1.39 | 45d | 1 | 1.49mi |
| 705 Loftin St Crowley, TX | 3.0 | 2.0 | 1514 | $2,200 | $1.45 | 45d | 1 | 1.50mi |
HOA detail
- Monthly dues
- $42 · $504/yr
Listing history 3 events
-
2026-02-27status Pending
-
2026-02-25price $253,199
-
2026-02-20$260,199 Active
ⓘ Source: listings_history table (triggers on properties + properties_extension) + one-shot
backfill from property_details.listing_events for pre-trigger history.
Tax reassessment forecast TX · Resets to sale price
- Current annual tax
- $1,099 · $92/mo
- Projected year-2 tax
- $4,634 · $386/mo
- Expected delta
- +$3,535/yr (+$295/mo · 321.6%)
ⓘ Screening estimate from a state-policy table — verify with the county assessor before closing.
Nearby sold comps map
Loading sold comps map…
Walkable amenities ~0.75 mi
Loading nearby amenities…
Taxation est. · year 1
- Rental income
- $24,403
- − Mortgage interest
- −$14,183
- − Property taxes
- −$1,099
- − Insurance
- −$1,266
- − Repairs & maintenance
- −$1,952
- − Management
- −$1,952
- − HOA
- −$504
- − Depreciation
- −$7,366
- Taxable loss
- −$3,920
- Est. tax savings @ 24.0%
- +$941
- After-tax cash flow
- $1,416/yr
For passive investors: Depreciation is non-cash, so a rental often shows a tax loss while cash-flowing — sheltering income. Rental losses are passive: they offset passive income freely, and up to $25,000/yr can offset ordinary (W-2) income if you actively participate and your MAGI is under $100k (phasing out to $0 by $150k); unused losses carry forward. On sale, claimed depreciation is recaptured at up to 25%, and gains may owe capital-gains tax (a 1031 exchange can defer both). Figures are a year-1 estimate at your 24.0% rate — not tax advice; consult a CPA.
Condition & rehab AI · 2 photos
This home requires extensive repairs and replacements to its exterior, roof, flooring, interior walls, and systems. Significant water damage and rot are visible on the exterior siding, indicating a major issue that needs immediate attention.
Repairs flagged
- Major exterior siding — Significant water damage and rot
- Major roof — No visible roof damage, but the condition of the roof cannot be determined from the satellite image
- Major flooring — No visible flooring, but the condition of the flooring cannot be determined from the satellite image
- Major interior walls/paint — No visible interior walls or paint, but the condition of the interior cannot be determined from the satellite image
- Major systems — No visible systems, but the condition of the systems cannot be determined from the satellite image
Value-add opportunities
- Both repair and replace exterior siding — Significant water damage and rot
- Both repair and replace roof — No visible roof damage, but the condition of the roof cannot be determined from the satellite image
- Both repair and replace flooring — No visible flooring, but the condition of the flooring cannot be determined from the satellite image
- Both repair and paint interior walls — No visible interior walls or paint, but the condition of the interior cannot be determined from the satellite image
- Both repair and replace systems — No visible systems, but the condition of the systems cannot be determined from the satellite image
Renovation cost estimate screening
| Repair item | Severity | Est. cost |
|---|---|---|
| exterior siding · Significant water damage and rot | Major | $15,000–50,000 |
| roof · No visible roof damage, but the condition of the roof cannot be determined from the satellite image | Major | $15,000–50,000 |
| flooring · No visible flooring, but the condition of the flooring cannot be determined from the satellite image | Major | $15,000–50,000 |
| interior walls/paint · No visible interior walls or paint, but the condition of the interior cannot be determined from the satellite image | Major | $15,000–50,000 |
| systems · No visible systems, but the condition of the systems cannot be determined from the satellite image | Major | $15,000–50,000 |
| Total estimated repair cost · 5 items | $75,000–250,000 |
Value-add ROI direction
- Both repair and replace exterior siding — Significant water damage and rot ↑
- Both repair and replace roof — No visible roof damage, but the condition of the roof cannot be determined from the satellite image ↑
- Both repair and replace flooring — No visible flooring, but the condition of the flooring cannot be determined from the satellite image ↑
- Both repair and paint interior walls — No visible interior walls or paint, but the condition of the interior cannot be determined from the satellite image ↑
- Both repair and replace systems — No visible systems, but the condition of the systems cannot be determined from the satellite image ↑
ⓘ Cost ranges are severity-bucket heuristics (US national rule-of-thumb). Get contractor quotes + a written scope before underwriting a rehab budget.
Schools (NCES district)
- District
- Crowley ISD
- NCES district ID
- 4815910
- Math proficiency
- 23% ▼ -15.00%
- Reading proficiency
- 32% ▼ -6.00%
- Median HH income
- $59,810
- Composite
- 25.04/100
- National rank
- #7549
- State rank
- #643 of 826 in TX
Livability — Fort Worth
- Score
- 80/100
- State rank
- #49
- US rank
- #1954
Category grades
Schools grade is shown separately in the Schools card above.
Census & demographics
- Census place
- Fort Worth, TX
- County
- Tarrant County · 2,033,669 people
- City population
- 911,619
- Metro
- Dallas-Fort Worth-Arlington, TX
- Population (ZIP)
- 29,949
- Household income
- $70,945
- Rent vs Own
- Severe rent burden
- 1539.0
Population outlook (Tarrant County) Hauer SSP2
- Today (2025)
- 2,380,417 people
- By 2030
- 2,578,900 · +8.3%
- By 2040
- 2,974,995 · +25.0%
- By 2050
- 3,350,489 · +40.8%
- By 2075
- 4,216,909 · +77.2%
- By 2100
- 4,741,527 · +99.2%
Race, ethnicity, and origin ACS 2023
- Neighborhood character
- Diverse neighborhood (Simpson 0.68)
- Race & ethnicity
- Hispanic / Latino 43% Black 31% Two or more races 21% White 19% Asian 4%
- Hispanic origin (detail)
- Mexican 38% Puerto Rican 1% Cuban 2%
- Common ancestry
- Lithuanian 2% Italian 2% Portuguese 1%
- Foreign-born
- 20% · Canada, Vietnam, Philippines
- Languages at home
- 62% English-only · Spanish 31% Vietnamese 3% French/Haitian/Cajun 1%
Political lean MEDSL · Tarrant
- 2024 margin
- Lean R (+5.1) · D 46.7% · R 51.9% · Other 1.4%
- 2008→2024 swing
- +6.6pp toward D · 2008: -11.7pp · 2024: -5.1pp
- All cycles
- 2024: R+5.1 2020: D+0.2 2016: R+8.7 2012: R+15.7 2008: R+11.7
Not yet ingested
- Civics
- —
Market trends
- HPI YoY
- ▼ -23.91%
- Current HPI
- 323.2306
- Rent YoY
- ▲ 2.30%
- Metro
- Dallas-Fort Worth-Arlington, TX
- State GDP YoY
- ▲ 3.95%
- F500 in state
- 110
Industry mix (Fortune 500 HQ in TX)
| Industry | F500 HQs | Revenue |
|---|---|---|
| Energy | 16 | $1,198B |
|
||
| Technology | 5 | $198B |
|
||
| Engineering / Construction | 4 | $72B |
|
||
| Energy Services | 3 | $60B |
|
||
| Utilities | 3 | $41B |
|
||
| Healthcare | 2 | $330B |
|
||
Price history
-2.7% since first listed3 events — show timeline
- 2026-02-27 Pending — NTREIS
- 2026-02-25 Price Changed $253,199 NTREIS
- 2026-02-20 Listed $260,199 NTREIS
Cash-flow waterfall
monthlySold comps — $/sqft
last 12 mo · ≤1 miLoading sold comps…