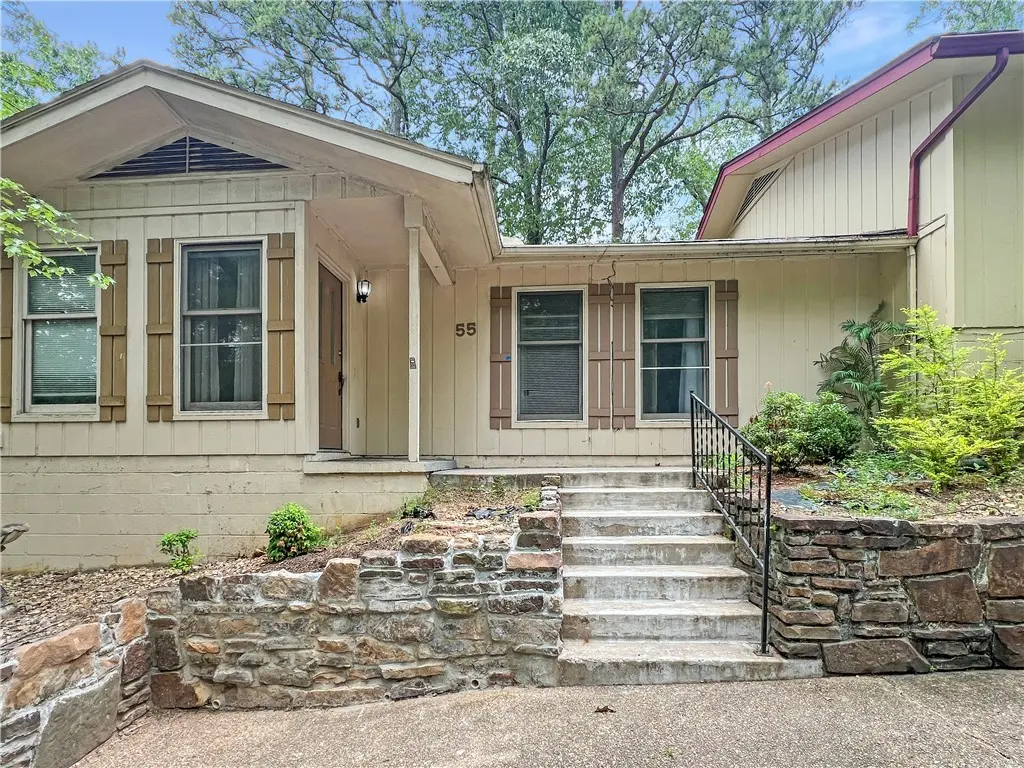
55 Nantucket Dr · Bella Vista, AR
Flood risk 1/10 · Minimal
- FEMA flood zone
- X (unshaded)
- Chance of flooding over 30 yrs
- 0.0%
- Est. flood insurance / yr
- $507 – $1,088
Fire risk 2/10 · Minimal
- Est. fire insurance / yr
- $1,499 – $2,785
Heat risk 5/10 · Moderate
- Hot days now (above 105°F)
- 7 days/yr
- Hot days in 30 yrs
- 20 days/yr
Wind risk 2/10 · Minimal
- Chance of severe wind over 30 yrs
- 2.0%
Air-quality risk 2/10 · Minimal
- Unhealthy air days now
- 0 days/yr
- Unhealthy air days in 30 yrs
- 1 days/yr
Risk factors via First Street. Map © Google.
Why this score? — see what drove the C grade
The composite is a weighted blend of 9 inputs, each scored 0–100. Each bar is that input's sub-score; the figure is the points it added to the 100-point composite (weight × sub-score).
- Cash flow +19.1/30.0
- ARV discount +12.2/15.0
- DSCR +6.0/10.0
- 1% rule +5.2/10.0
- Schools +5.2/10.0
- Livability +3.4/5.0
- Rent growth +2.5/5.0
- Condition / age +2.5/5.0
- Appreciation +0.0/10.0
$186,900
🖨 Deal sheet (PDF) 📄 Offer letter ✓ Due diligence
Listing remarks MLS
this one level townhouse features rock landscaping beds and private parking out front - there are three bedrooms and two full bathrooms and a large great room - plus utility room with a window - flooring is hand scraped wood with carpet in bedrooms and is 4 years old - ceramic counters in kitchen -water heater 3 - dishwasher and plumbing fixtures are 1 - back patio and storage closet looks out to grassy open area and you don't face any other townhouses - easy access to trails, golf, lakes and highway
Key facts
- $130 HOA
- Built 1976
- Listed 14 days
Property features AI
Finance
- HOA & community: Monthly association fee of $130; Community offers biking and trails/paths
Exterior
- Utilities: Electricity available; Phone available; Public water; Sewer available
- Home design: Single-story; Wood siding construction; Shingle and architectural roof; Slab foundation
- Construction: Built with wood siding; Slab foundation; Shingle and architectural roof
- Exterior features: Concrete driveway; Patio; City lot, open lot; Shared road frontage
Interior
- Kitchen: Electric oven; Electric water heater
- Flooring: Carpet; Wood
- Bathrooms: 2 full bathrooms
- Heating & cooling: Central heating; Central air conditioning
- Interior features: Carpet and wood flooring; Satellite dish
- Laundry & utility: Washer hookup; Dryer hookup
Neighborhood map
What this means for you Summary
Snapshot
- This is a 3-bed/2.0-bath townhouse listed at $187k.
Deal economics
- At list price, monthly cash flow is $197 ($2k/yr) — positive.
- The deal already cash-flows at list — no discount required.
- Meets the 1% rule at list price ($2k rent vs $187k).
- Cap rate 7.6% vs local median 3.6% in Bella Vista — top-decile yield for the area; either an underpriced asset or a hidden risk that comps aren't pricing in. Stress-test before assuming the spread holds.
Location & tenants
- Location reads 67/100 on livability (#111 in AR) — a middle-class / working-renter tenant base. Strengths: cost of living A+, housing A+, schools A; Watch: amenities F, commute F, health & safety F.
- Bentonville School District (urban): math 59% / reading 59% proficiency, ranked #3 of 238 in AR (top 1%) — acceptable for families but not a draw, mixed tenant base, ~2y average lease.
- Market conditions: 834 active listings in the ZIP; 1 comparable units currently listed for rent nearby; solid renter incomes; 4,359 units permitted in Benton County in 2024 (402 in 5+ unit buildings).
Forward outlook
- Local home prices are declining (-3.0%/yr); year-one equity from $1k of loan paydown is wiped out by about $6k of value loss. Plan a longer hold.
- Benton County population projected at +56% by 2050 — long-run rental-demand tailwind backs the buy-and-hold thesis.
Negotiation context
- Only 14 days on market — expect competitive offers; lowballing is unlikely to land.
- 4 sale attempts since 6y ago with the ask held roughly flat each time — persistent listings suggest the price (not the market) is what's stuck; bring a comps-based counter.
- Current owner paid $120k; list at $187k implies a 56% gain — meaningful room to come down on a strong offer.
Risks & watch-outs
- Climate carrying-cost: extreme-heat days projected 7→20/yr by 2055 (HVAC capex compounding) — expect insurance premiums to compound above CPI over the hold.
Questions for the listing agent
- Built in 1976 — when were the roof, HVAC, electrical panel, plumbing, and water heater last replaced?
- What does the HOA fee cover, when was the last increase, and are there any pending special assessments or reserve-fund shortfalls?
- Is there a deadline driving the sale (1031 exchange, divorce, estate, relocation)? That informs how much negotiation room exists.
- Schools are A-rated — typically a magnet for longer-tenancy family renters. What's the average tenant stay here, and is there a school-zone premium baked into asking?
- What's the average days-on-market for RENTAL listings here right now (not sales)? A rising rental-DOM trend means longer vacancies and softer asking-rent achievability than the comps imply.
- What's the recent tenant-quality profile in this submarket — average credit score on applications, eviction rate, late-payment / NSF rate, and stable-employment percentage? A property-management company in the area should have these aggregated.
- How much new for-sale + rental construction is in the pipeline within 1–3 miles? Heavy new supply typically softens prices + rents 12–24 months out; constrained supply supports both.
Investment metrics
- 1% rule
- 1.02% ✓
- Cap rate
- 7.56%
- Cash-on-cash
- 4.53%
- DSCR
- 1.20
- GRM
- 8.2
CMA / ARV
- ARV (on-the-fly)
- $208,800
- Comps found
- 12
Show comp detail 12 sales within ~0.75 mi
| Address | Dist | Beds/Ba | Sqft | Sold | Price | $/sf | Match |
|---|---|---|---|---|---|---|---|
| 4 Nantucket Dr | 0.12mi | 3/2.0 | 1,172 (+1%) | 6mo | $239,000 | $204 | 88 |
| 23 Dogwood Dr | 0.20mi | 2/1.5 (-1) | 1,152 (-1%) | 8mo | $216,900 | $188 | 76 |
| 19 Nantucket Dr | 0.11mi | 2/1.5 (-1) | 1,088 (-6%) | 4mo | $199,000 | $183 | 74 |
| 29 Nantucket Dr | 0.08mi | 2/1.5 (-1) | 1,088 (-6%) | 8mo | $156,000 | $143 | 72 |
| 2 Annette Ln | 0.26mi | 2/1.5 (-1) | 1,088 (-6%) | 2mo | $189,000 | $174 | 69 |
| 28 Nantucket Dr | 0.05mi | 2/1.5 (-1) | 1,088 (-6%) | 14mo | $154,500 | $142 | 69 |
| 60 Dogwood Dr | 0.22mi | 2/1.5 (-1) | 1,056 (-9%) | 1mo | $217,000 | $205 | 67 |
| 17 Nantucket Dr | 0.11mi | 2/1.5 (-1) | 1,088 (-6%) | 18mo | $153,000 | $141 | 62 |
| 25 Nantucket Dr | 0.09mi | 2/1.5 (-1) | 1,300 (+12%) | 12mo | $169,500 | $130 | 58 |
| 2 Mellor Ln | 0.23mi | 2/1.5 (-1) | 1,029 (-11%) | 6mo | $203,000 | $197 | 58 |
| 42 Dogwood Dr | 0.25mi | 3/1.5 | 1,313 (+13%) | 8mo | $215,000 | $164 | 58 |
| 38 Dogwood Dr | 0.25mi | 2/1.5 (-1) | 1,280 (+10%) | 15mo | $230,000 | $180 | 52 |
Match score weights: distance 35% · size 25% · config 20% · recency 20%. Top-matched comps best support the ARV.
Projected returns pro-forma
-3.0% appreciation · 3.0% rent growth · sell at horizon
- IRR
- -9.2%
- Equity multiple
- 0.66×
- Total profit
- $-17,672
- Equity at exit
- $27,867
- IRR
- 0.3%
- Equity multiple
- 1.02×
- Total profit
- $964
- Equity at exit
- $16,160
Cash invested: $52,332 (down + closing). Projections, not guarantees.
Landlord ↔ Tenant lean methodology
- Overall (STATE)
- 92 Strongly Landlord-Friendly
- State Arkansas
- 92 Strongly Landlord-Friendly · R+14
- County
- — inherits STATE
- City
- — inherits STATE
ZIP-level market 72715
- Home prices YoY
- -6.6%
- Active inventory
- 834
- Price-to-rent
- 8.2×
Monthly cashflow live
- Estimated rent
- $1,908 medium interval (Pro) →
- Mortgage (P&I)
- −$980
- Tax from tax record
- −$122 /mo · $1,459/yr
- Insurance
- −$78
- HOA
- −$130
- Vacancy / Maint / Mgmt
- −$401
- Net cashflow
- $197
Break-even live
Sensitivity live
| Price | -10% $303 | -5% $250 | +0% $197 | +5% $145 | +10% $92 |
|---|---|---|---|---|---|
| Rent | -10% $47 | -5% $122 | +0% $197 | +5% $273 | +10% $348 |
| Rate | -1.0pp $292 | -0.5pp $245 | base $197 | +0.5pp $149 | +1.0pp $100 |
UW: 25.0% down · 7.5% · 30yr · 1.5% tax · 5.0% vac · 8.0% maint · 8.0% mgmt
Financing live
Cash to close
- Down payment
- $46,725
- Closing costs
- $5,607
- Reserves months
- —
- Total cash needed
- —
Loan-product check · same deal, 3 products live
Conventional
25% down · 7.5% · 30yr
- Down + closing
- —
- Monthly P&I
- —
- Monthly cashflow
- —
- DSCR
- —
- Eligible?
- —
Personal DTI + credit; lowest rate.
DSCR
20% down · 8.5% · 30yr
- Down + closing
- —
- Monthly P&I
- —
- Monthly cashflow
- —
- DSCR
- —
- Eligible?
- —
No personal income docs; deal must DSCR.
Hard money
10% down · 12.0% · 12mo
- Down + closing
- —
- Monthly P&I
- —
- Monthly cashflow
- —
- DSCR
- —
- Eligible?
- —
Short-term bridge; refi at stabilization.
Rent comps 1 comps
| Address | Beds | Baths | Sqft | Rent | $/sqft | DOM | Units | Dist |
|---|---|---|---|---|---|---|---|---|
| 26 Purfleet Dr Bella Vista, AR | 3.0 | 2.0 | 1276 | $1,575 | $1.23 | 15d | 1 | 1.06mi |
HOA detail
- Monthly dues
- $130 · $1,560/yr
- Likely covers
- waterlandscaping
Listing history 12 events
-
2026-06-18days on market $186,900 Active 14 DOM
-
2026-06-17price $186,900 Active 13 DOM
-
2026-06-17days on market $189,900 Active 13 DOM
-
2026-06-16days on market $189,900 Active 12 DOM
-
2026-06-15days on market $189,900 Active 11 DOM
-
2026-06-14days on market $189,900 Active 9 DOM
-
2026-06-10days on market $189,900 Active 6 DOM
-
2026-06-09days on market $189,900 Active 5 DOM
-
2026-06-08days on market $189,900 Active 4 DOM
-
2026-06-07days on market $189,900 Active 3 DOM
-
2026-06-05remarks 699-char remark
-
2026-06-05$189,900 Active 1 DOM
ⓘ Source: listings_history table (triggers on properties + properties_extension) + one-shot
backfill from property_details.listing_events for pre-trigger history.
Tax reassessment forecast AR · Resets to sale price
- Current annual tax
- $1,459 · $122/mo
- Projected year-2 tax
- $1,459 · $122/mo
- Expected delta
- $0/yr ($0/mo · 0.0%)
ⓘ Screening estimate from a state-policy table — verify with the county assessor before closing.
Climate risk First Street
- Flood 1/10 Low FEMA zone X (unshaded) · 0% chance over 30 yrs
- Wildfire 2/10 Low
- Heat 5/10 Major 7 d/yr ≥105°F today · 20 d/yr by 30 yrs out
- Wind 2/10 Low 2% chance of damaging wind over 30 yrs
- Air quality 2/10 Low 0 unhealthy d/yr today · 1 by 30 yrs out
Nearby sold comps map
Loading sold comps map…
Walkable amenities ~0.75 mi
Loading nearby amenities…
Taxation est. · year 1
- Rental income
- $22,892
- − Mortgage interest
- −$10,469
- − Property taxes
- −$1,459
- − Insurance
- −$934
- − Repairs & maintenance
- −$1,831
- − Management
- −$1,831
- − HOA
- −$1,560
- − Depreciation
- −$5,437
- Taxable loss
- −$631
- Est. tax savings @ 24.0%
- +$152
- After-tax cash flow
- $2,521/yr
For passive investors: Depreciation is non-cash, so a rental often shows a tax loss while cash-flowing — sheltering income. Rental losses are passive: they offset passive income freely, and up to $25,000/yr can offset ordinary (W-2) income if you actively participate and your MAGI is under $100k (phasing out to $0 by $150k); unused losses carry forward. On sale, claimed depreciation is recaptured at up to 25%, and gains may owe capital-gains tax (a 1031 exchange can defer both). Figures are a year-1 estimate at your 24.0% rate — not tax advice; consult a CPA.
Schools (NCES district)
- District
- Bentonville School District
- NCES district ID
- 0503060
- Math proficiency
- 59% ▼ -8.00%
- Reading proficiency
- 59% ▼ -6.00%
- Median HH income
- $66,721
- Composite
- 51.85/100
- National rank
- #1661
- State rank
- #3 of 238 in AR
Livability — Bella Vista
- Score
- 67/100
- State rank
- #111
- US rank
- #11129
Category grades
Schools grade is shown separately in the Schools card above.
Census & demographics
- Census place
- Bella Vista, AR
- County
- Benton County · 259,241 people
- City population
- 31,638
- Metro
- Fayetteville-Springdale-Rogers, AR
- Population (ZIP)
- 17,288
- Household income
- $82,447
- Rent vs Own
- Severe rent burden
- 107.0
Population outlook (Benton County) Hauer SSP2
- Today (2025)
- 318,683 people
- By 2030
- 353,481 · +10.9%
- By 2040
- 425,280 · +33.4%
- By 2050
- 497,239 · +56.0%
- By 2075
- 662,114 · +107.8%
- By 2100
- 776,431 · +143.6%
Race, ethnicity, and origin ACS 2023
- Neighborhood character
- Predominantly White (84%)
- Race & ethnicity
- White 84% Two or more races 12% Hispanic / Latino 6% Asian 1%
- Hispanic origin (detail)
- Mexican 2% Dominican 2%
- Common ancestry
- Lithuanian 4% Slovak 4% Portuguese 2%
- Foreign-born
- 3% · Canada
- Languages at home
- 97% English-only · Spanish 2%
Political lean MEDSL · Benton
- 2024 margin
- Strong R (+27.0) · D 35.2% · R 62.1% · Other 2.7%
- 2008→2024 swing
- +9.6pp toward D · 2008: -36.5pp · 2024: -27.0pp
- All cycles
- 2024: R+27.0 2020: R+26.4 2016: R+34.9 2012: R+40.4 2008: R+36.5
Not yet ingested
- Civics
- —
Market trends
- HPI YoY
- ▼ -21.53%
- Current HPI
- 304.946
- Rent YoY
- —
- Metro
- Fayetteville-Springdale-Rogers, AR
- State GDP YoY
- ▲ 3.80%
- F500 in state
- 10
Industry mix (Fortune 500 HQ in AR)
| Industry | F500 HQs | Revenue |
|---|---|---|
| Retail | 1 | $681B |
|
||
| Food / Agriculture | 1 | $53B |
|
||
| Retail / Energy | 1 | $22B |
|
||
| Transportation / Logistics | 1 | $12B |
|
||
| Energy | 1 | $4B |
|
||
Price history
+179.3% since first listed11 events — show timeline
- 2026-06-04 Listed $189,900 NWARMLS
- 2026-06-02 Rental Removed $1,350 Avail
- 2026-05-20 Listed for Rent $1,350 Avail
- 2026-03-22 Rental Removed $1,400 Avail
- 2026-03-20 Listed for Rent $1,400 Avail
- 2023-09-20 Rental Removed $1,250 Avail
- 2023-09-12 Price Changed $1,250 Avail
- 2021-01-20 Sold (Public Records) $120,000 Public Records
- 2021-01-19 Sold (MLS) $120,000 NWARMLS
- 2020-12-31 Listed $118,800 NWARMLS
- 2004-07-19 Sold (Public Records) $68,000 Public Records
Property tax history
+7.7%/yrLatest (2025): $1,459 · +9.8% YoY. Source: county tax records.
Cash-flow waterfall
monthlySold comps — $/sqft
last 12 mo · ≤1 miLoading sold comps…