 Duplex
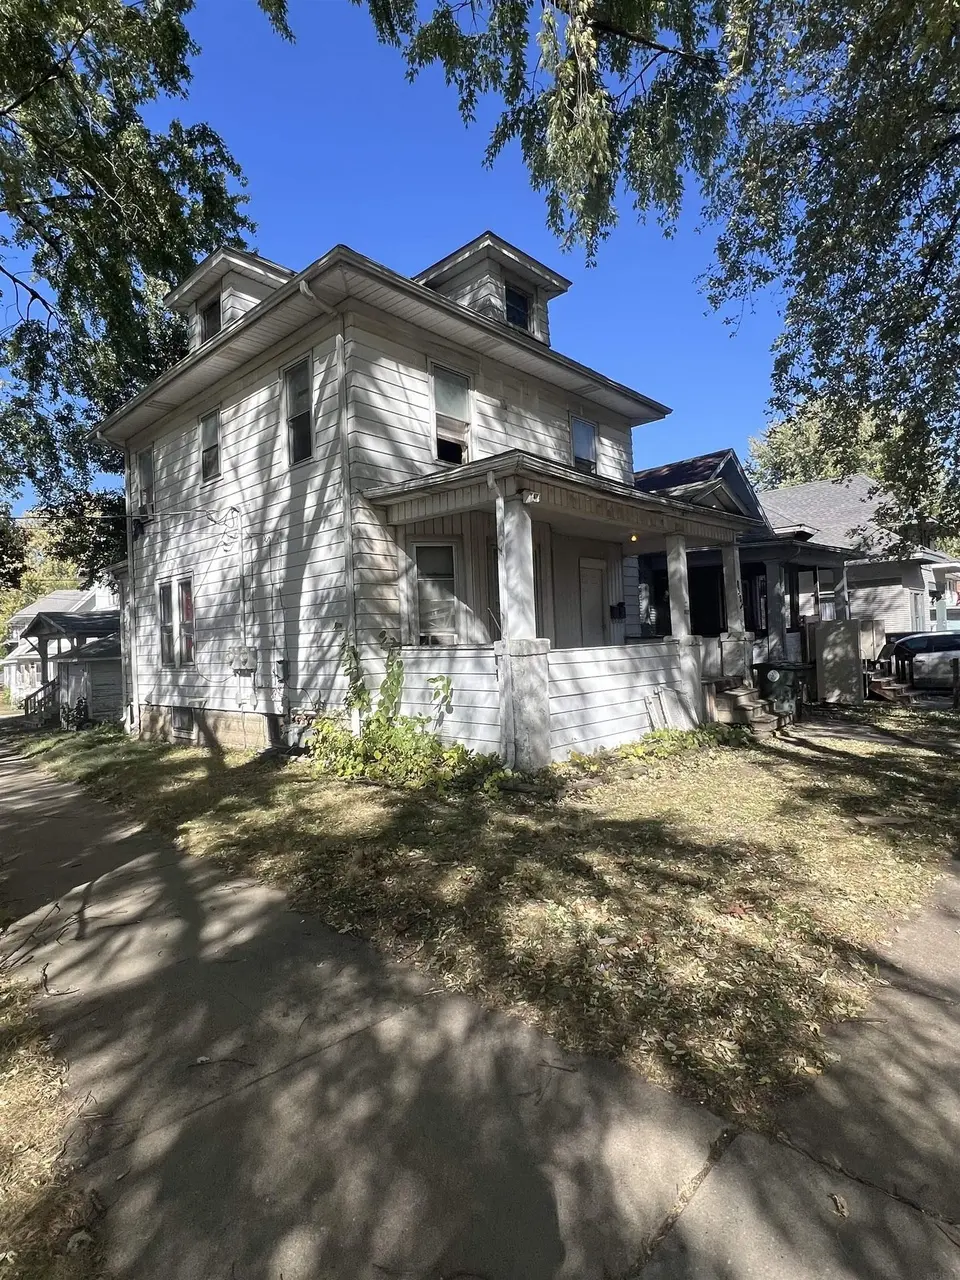
832 W 1st St · Waterloo, IA
Flood risk 1/10 · Minimal
- FEMA flood zone
- X (unshaded)
- Chance of flooding over 30 yrs
- 0.0%
- Est. flood insurance / yr
- $473 – $860
Fire risk 1/10 · Minimal
- Est. fire insurance / yr
- $902 – $1,676
Heat risk 3/10 · Minor
- Hot days now (above 101°F)
- 7 days/yr
- Hot days in 30 yrs
- 16 days/yr
Wind risk 2/10 · Minimal
- Chance of severe wind over 30 yrs
- —
Air-quality risk 1/10 · Minimal
- Unhealthy air days now
- 0 days/yr
- Unhealthy air days in 30 yrs
- 0 days/yr
Risk factors via First Street. Map © Google.
Why this score? — see what drove the B grade
The composite is a weighted blend of 9 inputs, each scored 0–100. Each bar is that input's sub-score; the figure is the points it added to the 100-point composite (weight × sub-score).
- Cash flow +30.0/30.0
- 1% rule +10.0/10.0
- DSCR +10.0/10.0
- ARV discount +7.5/15.0
- Schools +4.4/10.0
- Livability +4.0/5.0
- Rent growth +3.5/5.0
- Condition / age +2.5/5.0
- Appreciation +0.0/10.0
$45,000
🖨 Deal sheet 📄 Offer letter ✓ Due diligence
Multi-family units
County records classify this as Multi-Family (2-4 Unit). Listing-text estimate: 2 units. confirmed
Listing remarks MLS
Main floor duplex has 1 bedroom 1 bath. Upstairs duplex has 2 bedroom 1 bath.
Key facts
- 2,714 sq ft lot
- Garage
- Built 1908
Property features AI
Finance
- Other: Zoning: R-1
- Financial info: Unit rents: one unit at $775, another unit at $750
- HOA & community:
Exterior
- Parking: Detached garage (1 garage space); Parking pad with 2 open parking spaces
- Security:
- Utilities: Public water; Public sewer
- Home design: Residential income duplex; Two levels
- Construction: Aluminum siding; Asphalt roof
- Exterior features: Covered porch/patio; Corner and irregular lot
Interior
- Kitchen:
- Bedrooms:
- Flooring:
- Bathrooms:
- Heating & cooling: Forced air heating (natural gas); No cooling
- Interior features: Basement with block construction
- Laundry & utility: No laundry features listed
Neighborhood map
What this means for you Summary
Snapshot
- This is a 2 × 2-bed/1-bath units multifamily listed at $45k.
Deal economics
- At list price, monthly cash flow is $782 ($9k/yr) — positive. Per door: $391/mo.
- The deal already cash-flows at list — no discount required.
- Meets the 1% rule at list price ($1k rent vs $45k).
- Recommended offer: $44k (1.5% below list) — sets the bar for market timing.
- Cap rate 27.1% vs local median 4.2% in Waterloo — top-decile yield for the area; either an underpriced asset or a hidden risk that comps aren't pricing in. Stress-test before assuming the spread holds.
Location & tenants
- Location reads 81/100 on livability (#74 in IA, #1,589 nationally) — a professional / high-income tenant draw. Strengths: commute A+, cost of living A+, housing A+; Watch: crime F, employment D-.
- Waterloo Community School District (urban): math 50% / reading 54% proficiency, ranked #276 of 289 in IA (top 96%) — acceptable for families but not a draw, mixed tenant base, ~2y average lease.
- Zoned schools: Irving Elementary School (math 43% / reading 44%, grade F, #560 of 616 statewide, top 91%, 402 students, 92% FRL); West High School (math 55% / reading 63%, grade C+, #273 of 336 statewide, top 81%, 1,652 students, 62% FRL) — zoned schools average 77% FRL vs 58% district-wide (19 pts higher); higher-poverty schools than district average — tighter screening recommended.
- Market conditions: Rents rising (+3.8%/yr); 282 active listings in the ZIP; 28 comparable units currently listed for rent nearby; rentals lingering (median 44d on market — plan ~5-8 weeks vacancy on turnover, expect pricing pressure); 54% of comp listings sitting > 30 days — soft ceiling on asking rent; 287 units permitted in Black Hawk County in 2024 (67 in 5+ unit buildings).
Forward outlook
- Local home prices are declining (-3.0%/yr); year-one equity from $311 of loan paydown is wiped out by about $1k of value loss. Plan a longer hold.
- Black Hawk County population projected at +10% by 2050 — modest demand growth; plan on rents tracking national, not racing it.
- At projected returns (-3.0% appreciation + 3.8% rent growth), your $13k cash investment doubles in ~2 years — after that, you're playing with house money.
Negotiation context
- It's been on market 29 days — a 2% lower offer ($44k) is reasonable based on typical stale-listing flexibility.
- 2 sale attempts since 9y ago with the ask held roughly flat each time — persistent listings suggest the price (not the market) is what's stuck; bring a comps-based counter.
- Current owner paid $38k; 18% above their basis — modest negotiation headroom, anchor on the comps not their cost.
Risks & watch-outs
- Watch-outs: property tax is 2.9% of price; built in 1908 — expect roof / HVAC / electrical / plumbing capex.
Questions for the listing agent
- Can we see the unit-by-unit rent roll, current vacancy, and any below-market leases? What's the average tenancy length?
- What capital expenditures (roof, boiler, parking lot, exteriors) have been made in the last 5 years, and what's planned in the next 2?
- Built in 1908 — when were the roof, HVAC, electrical panel, plumbing, and water heater last replaced?
- Property tax is high relative to price — has the assessment been appealed recently, and will the sale trigger a re-assessment?
- Is there a deadline driving the sale (1031 exchange, divorce, estate, relocation)? That informs how much negotiation room exists.
- Crime grade is F in this area — have there been break-ins, vandalism, or insurance claims at this property in the last 3 years? What carrier currently insures it and at what premium?
- What's the average days-on-market for RENTAL listings here right now (not sales)? A rising rental-DOM trend means longer vacancies and softer asking-rent achievability than the comps imply.
- What's the recent tenant-quality profile in this submarket — average credit score on applications, eviction rate, late-payment / NSF rate, and stable-employment percentage? A property-management company in the area should have these aggregated.
- How much new apartment / multifamily construction is in the pipeline within 1–3 miles? Heavy new supply (>2% of stock underway) typically softens rents 12–24 months out; light construction supports rent growth.
Investment metrics
- 1% rule
- 3.22% ✓
- Cap rate
- 27.15%
- Cash-on-cash
- 74.48%
- DSCR
- 4.31
- GRM
- 2.6
CMA / ARV
- ARV (median comp)
- $164,950
- List price
- $45,000
- Delta
- -72.72%
- Verdict
- UNDERPRICED
- Comps
- 2 within 2.0 mi
Projected returns pro-forma
-3.0% appreciation · 3.8% rent growth · sell at horizon
- IRR
- 75.3%
- Equity multiple
- 4.47×
- Total profit
- $43,746
- Equity at exit
- $6,710
- IRR
- 79.2%
- Equity multiple
- 9.52×
- Total profit
- $107,347
- Equity at exit
- $3,891
Cash invested: $12,600 (down + closing). Projections, not guarantees.
Landlord ↔ Tenant lean methodology
- Overall (STATE)
- 83 Strongly Landlord-Friendly
- State Iowa
- 83 Strongly Landlord-Friendly · R+6
- County
- — inherits STATE
- City
- — inherits STATE
ZIP-level market 50701
- Rents YoY
- 3.8%
- Active inventory
- 282
- Price-to-rent
- 5.2×
Monthly cashflow live
- Estimated rent
- $1,448 high interval (Pro) →
- Mortgage (P&I)
- −$236
- Tax from tax record
- −$107 /mo · $1,285/yr
- Insurance
- −$19
- HOA
- −$0
- Vacancy / Maint / Mgmt
- −$304
- Net cashflow
- $782
Break-even live
2-unit breakdown (identical units grouped — click to expand)
| Units | Beds | Baths | Est. rent |
|---|---|---|---|
| 2× units | 2 | 1 | $1,448 |
| #1 | 2 | 1 | $724 |
| #2 | 2 | 1 | $724 |
| Total (2 units) | $1,448 | ||
UW: 25.0% down · 7.5% · 30yr · 1.5% tax · 5.0% vac · 8.0% maint · 8.0% mgmt
Financing live
Cash to close
- Down payment
- $11,250
- Closing costs
- $1,350
- Reserves months
- —
- Total cash needed
- —
Loan-product check · same deal, 3 products live
Conventional
25% down · 7.5% · 30yr
- Down + closing
- —
- Monthly P&I
- —
- Monthly cashflow
- —
- DSCR
- —
- Eligible?
- —
Personal DTI + credit; lowest rate.
DSCR
20% down · 8.5% · 30yr
- Down + closing
- —
- Monthly P&I
- —
- Monthly cashflow
- —
- DSCR
- —
- Eligible?
- —
No personal income docs; deal must DSCR.
Hard money
10% down · 12.0% · 12mo
- Down + closing
- —
- Monthly P&I
- —
- Monthly cashflow
- —
- DSCR
- —
- Eligible?
- —
Short-term bridge; refi at stabilization.
Rent comps 28 comps
| Address | Beds | Baths | Sqft | Rent | $/sqft | DOM | Units | Dist |
|---|---|---|---|---|---|---|---|---|
| 820 W 2nd St Apt 2 Waterloo, IA | 2.0 | 1.5 | 1100 | $695 | $0.63 | 44d | 1 | 0.06mi |
| 418 Sunnyside Ave Waterloo, IA | 3.0 | 1.0 | 1200 | $675 | $0.56 | 44d | 1 | 0.10mi |
| 416 Sunnyside Ave Waterloo, IA | 3.0 | 1.0 | 1200 | $825 | $0.69 | 44d | 1 | 0.10mi |
| 313 Denver St Unit Downstairs Waterloo, IA | 2.0 | 1.5 | 950 | $695 | $0.73 | 21d | 1 | 0.28mi |
| W Mullan Ave Waterloo, IA | 2.0 | 1.0 | 918 | $710 | $0.77 | 44d | 2 | 0.33mi |
| 1427 W 2nd St Waterloo, IA | 3.0 | 1.0 | 1248 | $1,250 | $1.00 | 44d | 1 | 0.41mi |
| 702 Western Ave Waterloo, IA | 2.0 | 1.5 | 1500 | $1,100 | $0.73 | 21d | 1 | 0.43mi |
| 45 W Jefferson St Waterloo, IA | 1.0–2.0 | 1.0–2.0 | 1062 | $1,750 | $1.65 | 21d | 9 | 0.48mi |
| 1524 1/2 W 5th St Unit 1524 1/2 Waterloo, IA | 2.0 | 1.0 | 981 | $850 | $0.87 | 21d | 1 | 0.51mi |
| 223 W 4th St Ste 203 Waterloo, IA | 2.0 | 1.5 | 1466 | $1,250 | $0.85 | 44d | 1 | 0.58mi |
| 616 Kimball Ave Waterloo, IA | 3.0 | 1.0 | 1302 | $1,100 | $0.84 | 44d | 1 | 0.58mi |
| 905 Baltimore St Waterloo, IA | 3.0 | 1.5 | 1392 | $1,025 | $0.74 | 44d | 1 | 0.64mi |
| 1840 W 3rd St Waterloo, IA | 2.0 | 1.0 | 1770 | $700 | $0.40 | 44d | 1 | 0.64mi |
| 719 Marsh St Waterloo, IA | 3.0 | 1.0 | 1224 | $1,100 | $0.90 | 21d | 1 | 0.65mi |
| 136 Janney Ave Waterloo, IA | 2.0 | 2.0 | 901 | $1,325 | $1.47 | 44d | 1 | 0.85mi |
| 824 Sycamore St Unit 824-09 Waterloo, IA | 2.0 | 2.0 | 1054 | $1,250 | $1.19 | 44d | 1 | 0.92mi |
| 311 E 3rd St Waterloo, IA | 2.0 | 2.0 | 1154 | $1,500 | $1.30 | 21d | 1 | 0.94mi |
| 1112 Byron Ave Unit 1114 Waterloo, IA | 2.0 | 1.0 | 896 | $930 | $1.04 | 21d | 1 | 0.94mi |
| 924 Sycamore St #1 Waterloo, IA | 2.0 | 2.0 | 1054 | $1,250 | $1.19 | 44d | 1 | 0.95mi |
| 920-928 Sycamore St Unit 920-07 Waterloo, IA | 2.0 | 2.0 | 1054 | $1,250 | $1.19 | 44d | 1 | 0.98mi |
| 910 Mulberry St Apt 3 Waterloo, IA | 2.0 | 1.0 | 1064 | $695 | $0.65 | 21d | 1 | 1.10mi |
| 1107 Mulberry St Waterloo, IA | 3.0 | 1.0 | 1248 | $950 | $0.76 | 21d | 1 | 1.20mi |
| 2539 W 3rd St Waterloo, IA | 3.0 | 2.5 | 1200 | $1,695 | $1.41 | 21d | 1 | 1.23mi |
| 2215 Falls Ave Waterloo, IA | 3.0 | 1.0 | 1290 | $1,400 | $1.09 | 44d | 1 | 1.33mi |
| 216 Courtland St Apt 1 Waterloo, IA | 4.0 | 1.0 | 1150 | $825 | $0.72 | 21d | 1 | 1.33mi |
| 214 Edwards St Waterloo, IA | 3.0 | 1.0 | 1150 | $825 | $0.72 | 21d | 1 | 1.39mi |
| 105 Bellaire Rd Waterloo, IA | 2.0 | 2.0 | 1088 | $1,100 | $1.01 | 21d | 1 | 1.46mi |
| 154 Acadia St Unit 2 Waterloo, IA | 2.0 | 1.0 | 995 | $1,200 | $1.21 | 44d | 1 | 1.48mi |
Listing history 7 events
-
2026-04-27$45,000 Active 129-char remark
-
2024-03-28price $60,000
-
2021-11-01soldstatus $38,000
-
2017-10-26soldstatus $143,625
-
2017-10-12soldstatus $19,000
Show marketing remark (77 chars)
Main floor duplex has 1 bedroom 1 bath. Upstairs duplex has 2 bedroom 1 bath.
-
2017-06-19$24,900
Show marketing remark (77 chars)
Main floor duplex has 1 bedroom 1 bath. Upstairs duplex has 2 bedroom 1 bath.
-
2016-03-04soldstatus $28,000
ⓘ Source: listings_history table (triggers on properties + properties_extension) + one-shot
backfill from property_details.listing_events for pre-trigger history.
Tax reassessment forecast IA · Partial reset (capped growth)
- Current annual tax
- $1,285 · $107/mo
- Projected year-2 tax
- $1,285 · $107/mo
- Expected delta
- $0/yr ($0/mo · 0.0%)
ⓘ Screening estimate from a state-policy table — verify with the county assessor before closing.
Climate risk First Street
- Flood 1/10 Low FEMA zone X (unshaded) · 0% chance over 30 yrs
- Wildfire 1/10 Low
- Heat 3/10 Moderate 7 d/yr ≥101°F today · 16 d/yr by 30 yrs out
- Wind 2/10 Low
- Air quality 1/10 Low 0 unhealthy d/yr today · 0 by 30 yrs out
Nearby sold comps map
Loading sold comps map…
Walkable amenities ~0.75 mi
Loading nearby amenities…
Taxation est. · year 1
- Rental income
- $17,376
- − Mortgage interest
- −$2,521
- − Property taxes
- −$1,285
- − Insurance
- −$225
- − Repairs & maintenance
- −$1,390
- − Management
- −$1,390
- − Depreciation
- −$1,309
- Taxable income
- $9,256
- Est. tax owed @ 24.0%
- −$2,221
- After-tax cash flow
- $7,163/yr
For passive investors: Depreciation is non-cash, so a rental often shows a tax loss while cash-flowing — sheltering income. Rental losses are passive: they offset passive income freely, and up to $25,000/yr can offset ordinary (W-2) income if you actively participate and your MAGI is under $100k (phasing out to $0 by $150k); unused losses carry forward. On sale, claimed depreciation is recaptured at up to 25%, and gains may owe capital-gains tax (a 1031 exchange can defer both). Figures are a year-1 estimate at your 24.0% rate — not tax advice; consult a CPA.
Schools (NCES district)
- District
- Waterloo Community School District
- NCES district ID
- 1930480
- Math proficiency
- 50% ▼ -4.00%
- Reading proficiency
- 54% ▲ 1.00%
- Median HH income
- $42,545
- Composite
- 43.72/100
- National rank
- #2950
- State rank
- #276 of 289 in IA
Livability — Waterloo
- Score
- 81/100
- State rank
- #74
- US rank
- #1589
Category grades
Schools grade is shown separately in the Schools card above.
Census & demographics
- Census place
- Waterloo, IA
- County
- Black Hawk County · 112,933 people
- City population
- 69,066
- Metro
- Waterloo-Cedar Falls, IA
- Population (ZIP)
- 30,232
- Household income
- $61,475
- Rent vs Own
- Severe rent burden
- 1377.0
Population outlook (Black Hawk County) Hauer SSP2
- Today (2025)
- 139,716 people
- By 2030
- 142,853 · +2.2%
- By 2040
- 147,843 · +5.8%
- By 2050
- 153,247 · +9.7%
- By 2075
- 167,977 · +20.2%
- By 2100
- 177,320 · +26.9%
Race, ethnicity, and origin ACS 2023
- Neighborhood character
- Predominantly White (78%)
- Race & ethnicity
- White 78% Black 11% Two or more races 5% Hispanic / Latino 3% Asian 3%
- Common ancestry
- Portuguese 3% Italian 3% American 2%
- Foreign-born
- 7% · Canada, South Korea, Vietnam
- Languages at home
- 92% English-only · Russian/Polish/Slavic 2% Spanish 2% French/Haitian/Cajun 2%
Political lean MEDSL · Black Hawk
- 2024 margin
- Toss-up / Even · D 50.0% · R 48.8% · Other 1.2%
- 2008→2024 swing
- -21.3pp toward R · 2008: 22.4pp · 2024: 1.2pp
- All cycles
- 2024: D+1.2 2020: D+9.0 2016: D+7.3 2012: D+20.0 2008: D+22.4
Not yet ingested
- Civics
- —
Market trends
- HPI YoY
- ▼ -107.19%
- Current HPI
- 162.8951
- Rent YoY
- ▲ 3.80%
- Metro
- Waterloo-Cedar Falls, IA
- State GDP YoY
- ▲ 2.48%
- F500 in state
- 4
Industry mix (Fortune 500 HQ in IA)
| Industry | F500 HQs | Revenue |
|---|---|---|
| Financial Services | 1 | $16B |
|
||
| Retail / Convenience | 1 | $15B |
|
||
Price history
+60.7% since first listed8 events — show timeline
- 2026-05-26 Pending — NEIRBR as distributed by MLS GRID
- 2026-04-27 Listed $45,000 NEIRBR as distributed by MLS GRID
- 2024-03-28 Price Changed $60,000 CRAAR, CDRMLS
- 2021-11-01 Sold (Public Records) $38,000 Public Records
- 2017-10-26 Sold (Public Records) $143,625 Public Records
- 2017-10-12 Sold (MLS) $19,000 NEIRBR as distributed by MLS GRID
- 2017-06-19 Listed $24,900 NEIRBR as distributed by MLS GRID
- 2016-03-04 Sold (Public Records) $28,000 Public Records
Property tax history
+3.1%/yrLatest (2025): $1,285 · +23.6% YoY. Source: county tax records.
Cash-flow waterfall
monthlySold comps — $/sqft
last 12 mo · ≤1 miLoading sold comps…