 🏗️ New Construction
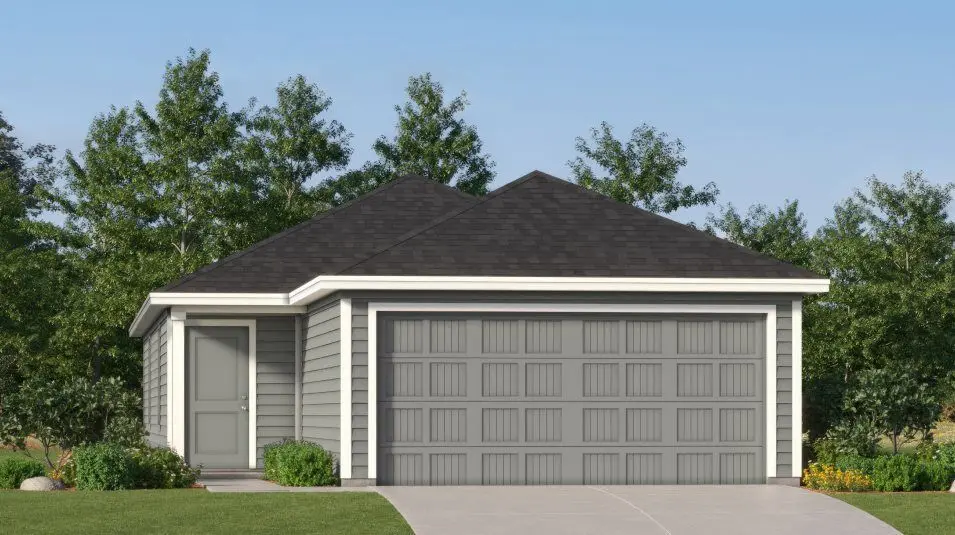
Brower Plan · New Braunfels, TX
Flood risk No data
- FEMA flood zone
- —
- Chance of flooding over 30 yrs
- —
- Est. flood insurance / yr
- —
Fire risk No data
- Est. fire insurance / yr
- —
Heat risk No data
- Hot days now (above threshold)
- —
- Hot days in 30 yrs
- —
Wind risk No data
- Chance of severe wind over 30 yrs
- —
Air-quality risk No data
- Unhealthy air days now
- —
- Unhealthy air days in 30 yrs
- —
Risk factors via First Street. Map © Google.
Why this score? — see what drove the F grade
The composite is a weighted blend of 9 inputs, each scored 0–100. Each bar is that input's sub-score; the figure is the points it added to the 100-point composite (weight × sub-score).
- ARV discount +7.5/15.0
- Cash flow +7.3/30.0
- Schools +5.2/10.0
- Livability +4.2/5.0
- Condition / age +3.8/5.0
- 1% rule +2.1/10.0
- Rent growth +1.9/5.0
- DSCR +1.5/10.0
- Appreciation +0.0/10.0
$209,999
🖨 Deal sheet 📄 Offer letter ✓ Due diligence
Listing remarks
This single-level home showcases a spacious open floorplan shared between the kitchen, dining area and family room for easy entertaining. An owner's suite enjoys a private location at the front of the home, complemented by an en-suite bathroom and walk-in closet. There are two secondary bedrooms just off the main living areas, which are comfortable spaces for household members and overnight guests.
Key facts
- Walk-in closet
- Open floorplan
- Secondary bedrooms
Tags
Property features AI
Finance
- Financial info: List price $209,999
Exterior
- Parking: 2-car garage / 2 total parking spaces
- Home design: Single-family plan (Brower)
- Exterior features: Living area of 1213
Interior
- Bedrooms: 3 bedrooms
- Bathrooms: 2 bathrooms
- Interior features: New construction plan (Brower)
Neighborhood map
What this means for you Summary
Snapshot
- This is a 3-bed/2.0-bath single-family listed at $210k. Condition is rated good.
Deal economics
- At list price, monthly cash flow is $-305 ($-4k/yr) — negative.
- To cash-flow at today's rent, offer at most $188k (10.5% below list).
- To meet the 1% rule (rent ≥ 1% of price), the offer needs to be $164k (21.7% below list).
- Recommended offer: $164k (21.7% below list) — sets the bar for 1% rule.
- Cap rate 4.7% vs local median 3.4% in New Braunfels — top-decile yield for the area; either an underpriced asset or a hidden risk that comps aren't pricing in. Stress-test before assuming the spread holds.
Location & tenants
- Location reads 83/100 on livability (#9 in TX, #925 nationally) — a professional / high-income tenant draw. Strengths: amenities A+, housing A+, health & safety A+; Watch: commute F.
- Comal ISD (rural): math 57% / reading 59% proficiency, ranked #58 of 826 in TX (top 7%) — acceptable for families but not a draw, mixed tenant base, ~2y average lease.
- Market conditions: Rents soft (-2.3%/yr); 1096 active listings in the ZIP; 31 comparable units currently listed for rent nearby; rentals at typical pace (median 24d on market — plan ~3-4 weeks tenant-placement turnaround); high-income renter base; 3,420 units permitted in Comal County in 2024 (1,164 in 5+ unit buildings).
- This rent is only 15% of the median local income ($135k/yr) — well below the 30% rent-burden line; pricing power to push rent on renewal without tenant pushback.
Forward outlook
- Local home prices are declining (-3.0%/yr); year-one equity from $2k of loan paydown is wiped out by about $7k of value loss. Plan a longer hold.
- Comal County population projected at +70% by 2050 — long-run rental-demand tailwind backs the buy-and-hold thesis.
Negotiation context
- It's been on market 41 days — a 3% lower offer ($204k) is reasonable based on typical stale-listing flexibility.
Questions for the listing agent
- What do current leases actually rent for vs. the listed asking? Can we see a recent rent roll and the last 12 months of T-12 income?
- It's been on market 41 days. Have you received any prior offers? Is the seller open to a 22% concession, seller financing, or rate buy-down credit?
- Is there a deadline driving the sale (1031 exchange, divorce, estate, relocation)? That informs how much negotiation room exists.
- Schools are B-rated — typically a magnet for longer-tenancy family renters. What's the average tenant stay here, and is there a school-zone premium baked into asking?
- The area grade is low — what's the realistic commute time and amenity access for the typical tenant pool here? Any planned neighborhood developments (good or bad) we should know about?
- What's the average days-on-market for RENTAL listings here right now (not sales)? A rising rental-DOM trend means longer vacancies and softer asking-rent achievability than the comps imply.
- What's the recent tenant-quality profile in this submarket — average credit score on applications, eviction rate, late-payment / NSF rate, and stable-employment percentage? A property-management company in the area should have these aggregated.
- How much new for-sale + rental construction is in the pipeline within 1–3 miles? Heavy new supply typically softens prices + rents 12–24 months out; constrained supply supports both.
Investment metrics
- 1% rule
- 0.71% ✗
- Cap rate
- 4.71%
- Cash-on-cash
- -5.64%
- DSCR
- 0.75
- GRM
- 11.8
CMA / ARV
- ARV (median comp)
- $232,166
- List price
- $209,999
- Delta
- -9.55%
- Verdict
- FAIR
- Comps
- 20 within 1.0 mi
Show comp detail 12 sales within ~0.75 mi
| Address | Dist | Beds/Ba | Sqft | Sold | Price | $/sf | Match |
|---|---|---|---|---|---|---|---|
| 787 Bullsnake Trl | 0.09mi | 3/2.0 | 1,266 (+4%) | 9mo | $215,999 | $171 | 81 |
| 730 Tulsa Trl | 0.18mi | 3/2.0 | 1,266 (+4%) | 6mo | $199,900 | $158 | 79 |
| 3765 Swift Fox Rd | 0.39mi | 3/2.0 | 1,266 (+4%) | 3mo | $194,990 | $154 | 72 |
| 3741 Swift Fox Rd | 0.35mi | 3/2.0 | 1,266 (+4%) | 9mo | $204,999 | $162 | 69 |
| 3849 Swift Fox Rd | 0.54mi | 3/2.0 | 1,266 (+4%) | 1mo | $214,999 | $170 | 67 |
| 3817 Swift Fox Rd | 0.47mi | 3/2.0 | 1,266 (+4%) | 6mo | $215,999 | $171 | 66 |
| 3805 Swift Fox Rd | 0.45mi | 3/2.0 | 1,266 (+4%) | 8mo | $214,999 | $170 | 65 |
| 3833 Swift Fox Rd | 0.50mi | 3/2.0 | 1,266 (+4%) | 6mo | $219,007 | $173 | 65 |
| 3636 Tilden | 0.24mi | 3/2.0 | 1,379 (+14%) | 2mo | $229,500 | $166 | 64 |
| 825 Day Break Dr | 0.24mi | 3/2.0 | 1,354 (+12%) | 10mo | $212,549 | $157 | 61 |
| 3972 Trinity Trl | 0.70mi | 2/2.0 (-1) | 1,261 (+4%) | 5mo | $181,900 | $144 | 52 |
| 647 Cherokee | 0.62mi | 2/2.0 (-1) | 1,048 (-14%) | 10mo | $205,000 | $196 | 35 |
Match score weights: distance 35% · size 25% · config 20% · recency 20%. Top-matched comps best support the ARV.
Projected returns pro-forma
-3.0% appreciation · 0.0% rent growth · sell at horizon
- IRR
- -29.3%
- Equity multiple
- 0.05×
- Total profit
- $-61,872
- Equity at exit
- $34,617
- IRR
- -48.1%
- Equity multiple
- -0.50×
- Total profit
- $-97,452
- Equity at exit
- $20,073
Cash invested: $65,006 (down + closing). Projections, not guarantees.
Landlord ↔ Tenant lean methodology
- Overall (STATE)
- 87 Strongly Landlord-Friendly
- State Texas
- 87 Strongly Landlord-Friendly · R+5
- County
- — inherits STATE
- City
- — inherits STATE
ZIP-level market 78132
- Rents YoY
- -2.3%
- Active inventory
- 1096
- Price-to-rent
- 10.6×
Monthly cashflow live
- Estimated rent
- $1,644 high interval (Pro) →
- Mortgage (P&I)
- −$1,218
- Tax est. 1.5%
- −$290 /mo · $3,482/yr
- Insurance
- −$97
- HOA
- −$0
- Vacancy / Maint / Mgmt
- −$345
- Net cashflow
- $-305
Break-even live
UW: 25.0% down · 7.5% · 30yr · 1.5% tax · 5.0% vac · 8.0% maint · 8.0% mgmt
Financing live
Cash to close
- Down payment
- $58,041
- Closing costs
- $6,965
- Reserves months
- —
- Total cash needed
- —
Loan-product check · same deal, 3 products live
Conventional
25% down · 7.5% · 30yr
- Down + closing
- —
- Monthly P&I
- —
- Monthly cashflow
- —
- DSCR
- —
- Eligible?
- —
Personal DTI + credit; lowest rate.
DSCR
20% down · 8.5% · 30yr
- Down + closing
- —
- Monthly P&I
- —
- Monthly cashflow
- —
- DSCR
- —
- Eligible?
- —
No personal income docs; deal must DSCR.
Hard money
10% down · 12.0% · 12mo
- Down + closing
- —
- Monthly P&I
- —
- Monthly cashflow
- —
- DSCR
- —
- Eligible?
- —
Short-term bridge; refi at stabilization.
Rent comps 31 comps
| Address | Beds | Baths | Sqft | Rent | $/sqft | DOM | Units | Dist |
|---|---|---|---|---|---|---|---|---|
| 751 Bullsnake Trl New Braunfels, TX | 3.0 | 2.0 | 1440 | $1,650 | $1.15 | 23d | 1 | 0.08mi |
| 722 Killdeer Trl New Braunfels, TX | 3.0 | 2.0 | 1273 | $3,200 | $2.51 | 43d | 1 | 0.09mi |
| 740 Bullsnake Trl New Braunfels, TX | 3.0 | 2.0 | 1440 | $1,650 | $1.15 | 43d | 1 | 0.12mi |
| 742 Tower Hill Vw New Braunfels, TX | 3.0 | 2.0 | 1266 | $1,545 | $1.22 | 2d | 1 | 0.28mi |
| 754 Tower Hill Vw New Braunfels, TX | 3.0 | 2.0 | 1402 | $1,650 | $1.18 | 2d | 1 | 0.28mi |
| 3738 Swift Fox Rd New Braunfels, TX | 3.0 | 2.0 | 1266 | $1,545 | $1.22 | 14d | 1 | 0.34mi |
| 3707 Moon Hill Rd Marion, TX | 3.0 | 2.0 | 1354 | $1,550 | $1.14 | 4d | 1 | 0.35mi |
| 3967 Cherokee Blvd New Braunfels, TX | 3.0 | 2.0 | 1425 | $1,695 | $1.19 | 23d | 1 | 0.70mi |
| 2964 Vista Pkwy New Braunfels, TX | 2.0 | 2.0 | 1395 | $2,250 | $1.61 | 10d | 1 | 0.98mi |
| 4171 River Legacy Marion, TX | 3.0 | 2.0 | 1305 | $1,570 | $1.20 | 23d | 1 | 0.99mi |
| 2700 Farm to Market Road 1044 Unit 3-3x New Braunfels, TX | 3.0 | 2.5 | 1490 | $1,611 | $1.08 | 4d | 1 | 1.08mi |
| 2701 Farm to Market Road 1044 Unit 22 New Braunfels, TX | 2.0 | 1.5 | 1301 | $1,429 | $1.10 | 19d | 1 | 1.09mi |
| 2744 Farm to Market Road 1044 New Braunfels, TX | 3.0 | 2.0 | 1176 | $1,295 | $1.10 | 12d | 1 | 1.12mi |
| 2754 Farm to Market Road 1044 New Braunfels, TX | 3.0 | 2.0 | 1176 | $1,295 | $1.10 | 17d | 1 | 1.14mi |
| 2754 Farm to Market Road 1044 Unit 2754 New Braunfels, TX | 3.0 | 2.0 | 1176 | $1,295 | $1.10 | 43d | 1 | 1.14mi |
| 3143 Douglas Fir Dr New Braunfels, TX | 3.0 | 2.0 | 1373 | $1,325 | $0.97 | 14d | 1 | 1.14mi |
| 2764 Farm to Market Road 1044 Unit 2764 New Braunfels, TX | 3.0 | 2.0 | 1100 | $1,295 | $1.18 | 43d | 1 | 1.15mi |
| 363 Copper Mtn New Braunfels, TX | 3.0 | 2.0 | 1180 | $1,695 | $1.44 | 4d | 1 | 1.16mi |
| 3040 Pine Valley Dr New Braunfels, TX | 2.0 | 2.0 | 956 | $1,325 | $1.39 | 1d | 1 | 1.17mi |
| 3027 Pine Valley Dr New Braunfels, TX | 3.0 | 2.0 | 1406 | $1,500 | $1.07 | 43d | 1 | 1.21mi |
| 3032 Douglas Fir Dr New Braunfels, TX | 3.0 | 2.0 | 1335 | $1,650 | $1.24 | 43d | 1 | 1.24mi |
| 337 S Water Ln New Braunfels, TX | 2.0 | 2.0 | 1079 | $1,295 | $1.20 | 23d | 1 | 1.25mi |
| 3028 Douglas Fir Dr New Braunfels, TX | 3.0 | 2.0 | 1214 | $1,395 | $1.15 | 43d | 1 | 1.25mi |
| 340 Untermaier St Canyon Lake, TX | 3.0 | 2.5 | 1380 | $1,495 | $1.08 | 43d | 1 | 1.27mi |
| 3008 Pine Valley Dr New Braunfels, TX | 3.0 | 2.0 | 1206 | $1,450 | $1.20 | 43d | 1 | 1.28mi |
| 341 Untermaier St New Braunfels, TX | 3.0 | 2.5 | 1380 | $1,475 | $1.07 | 23d | 1 | 1.29mi |
| 320 Untermaier St Canyon Lake, TX | 3.0 | 2.5 | 1380 | $1,495 | $1.08 | 43d | 1 | 1.29mi |
| 3012 Douglas Fir Dr New Braunfels, TX | 3.0 | 2.0 | 1447 | $1,475 | $1.02 | 19d | 1 | 1.31mi |
| 3011 Lodgepole Ln New Braunfels, TX | 3.0 | 2.0 | 1335 | $1,425 | $1.07 | 43d | 1 | 1.33mi |
| 2997 Rosenholz St New Braunfels, TX | 3.0 | 2.5 | 1350 | $1,695 | $1.26 | 4d | 8 | 1.36mi |
| 1973 Bluethroat New Braunfels, TX | 3.0 | 2.0 | 1458 | $1,750 | $1.20 | 16d | 1 | 1.40mi |
Listing history 14 events
-
2026-06-18days on market $209,999 Active 41 DOM
-
2026-06-17days on market $209,999 Active 40 DOM
-
2026-06-16days on market $209,999 Active 39 DOM
-
2026-06-15days on market $209,999 Active 38 DOM
-
2026-06-13days on market $209,999 Active 36 DOM
-
2026-06-09days on market $209,999 Active 32 DOM
-
2026-06-08days on market $209,999 Active 31 DOM
-
2026-06-07days on market $209,999 Active 30 DOM
-
2026-06-04days on market $209,999 Active 27 DOM
-
2026-06-03days on market $209,999 Active 26 DOM
-
2026-06-02days on market $209,999 Active 25 DOM
-
2026-06-02days on market $209,999 Active 24 DOM
-
2026-05-31days on market $209,999 Active 23 DOM
-
2026-05-08$209,999 Active 401-char remark
ⓘ Source: listings_history table (triggers on properties + properties_extension) + one-shot
backfill from property_details.listing_events for pre-trigger history.
Nearby sold comps map
Loading sold comps map…
Walkable amenities ~0.75 mi
Loading nearby amenities…
Taxation est. · year 1
- Rental income
- $19,731
- − Mortgage interest
- −$13,005
- − Property taxes
- −$3,482
- − Insurance
- −$1,161
- − Repairs & maintenance
- −$1,578
- − Management
- −$1,578
- − Depreciation
- −$6,754
- Taxable loss
- −$7,828
- Est. tax savings @ 24.0%
- +$1,879
- After-tax cash flow
- $-1,787/yr
For passive investors: Depreciation is non-cash, so a rental often shows a tax loss while cash-flowing — sheltering income. Rental losses are passive: they offset passive income freely, and up to $25,000/yr can offset ordinary (W-2) income if you actively participate and your MAGI is under $100k (phasing out to $0 by $150k); unused losses carry forward. On sale, claimed depreciation is recaptured at up to 25%, and gains may owe capital-gains tax (a 1031 exchange can defer both). Figures are a year-1 estimate at your 24.0% rate — not tax advice; consult a CPA.
Condition & rehab AI · 3 photos
This single-level home presents as move-in ready with good condition and minimal maintenance required. Fresh paint and clean gutters can significantly enhance its curb appeal and value.
Value-add opportunities
- Both Paint exterior siding — Fresh paint can enhance curb appeal and property value.
- Both Replace or clean gutters — Clean gutters improve drainage and prevent water damage, enhancing both resale and rental value.
Renovation cost estimate screening
Value-add ROI direction
- Both Paint exterior siding — Fresh paint can enhance curb appeal and property value. ↑
- Both Replace or clean gutters — Clean gutters improve drainage and prevent water damage, enhancing both resale and rental value. ↑
ⓘ Cost ranges are severity-bucket heuristics (US national rule-of-thumb). Get contractor quotes + a written scope before underwriting a rehab budget.
Schools (NCES district)
- District
- Comal ISD
- NCES district ID
- 4814730
- Math proficiency
- 57% ▼ -9.00%
- Reading proficiency
- 59% ▼ -2.00%
- Median HH income
- $74,792
- Composite
- 51.79/100
- National rank
- #1671
- State rank
- #58 of 826 in TX
Livability — New Braunfels
- Score
- 83/100
- State rank
- #9
- US rank
- #925
Category grades
Schools grade is shown separately in the Schools card above.
Census & demographics
- County
- Comal County · 206,262 people
- City population
- 144,962
- Metro
- San Antonio-New Braunfels, TX
- Population (ZIP)
- 40,953
- Household income
- $135,315
- Rent vs Own
- Severe rent burden
- 264.0
Population outlook (Comal County) Hauer SSP2
- Today (2025)
- 175,637 people
- By 2030
- 199,911 · +13.8%
- By 2040
- 249,436 · +42.0%
- By 2050
- 299,430 · +70.5%
- By 2075
- 423,857 · +141.3%
- By 2100
- 512,048 · +191.5%
Race, ethnicity, and origin ACS 2023
- Neighborhood character
- Predominantly White (71%)
- Race & ethnicity
- White 71% Hispanic / Latino 21% Two or more races 13% Black 2% Asian 2%
- Hispanic origin (detail)
- Mexican 16% Puerto Rican 1%
- Common ancestry
- Slovak 4% Italian 3% Serbian 3%
- Foreign-born
- 6% · Canada
- Languages at home
- 89% English-only · Spanish 9% Other Indo-European 1%
Political lean MEDSL · Comal
- 2024 margin
- Solid R (+45.5) · D 26.8% · R 72.2%
- 2008→2024 swing
- +1.9pp toward D · 2008: -47.4pp · 2024: -45.5pp
- All cycles
- 2024: R+45.5 2020: R+42.7 2016: R+50.1 2012: R+54.1 2008: R+47.4
Not yet ingested
- Civics
- —
Market trends
- HPI YoY
- ▼ -139.57%
- Current HPI
- 202.432
- Rent YoY
- ▼ -2.32%
- Metro
- San Antonio-New Braunfels, TX
- State GDP YoY
- ▲ 3.95%
- F500 in state
- 110
Industry mix (Fortune 500 HQ in TX)
| Industry | F500 HQs | Revenue |
|---|---|---|
| Energy | 16 | $1,198B |
|
||
| Technology | 5 | $198B |
|
||
| Engineering / Construction | 4 | $72B |
|
||
| Energy Services | 3 | $60B |
|
||
| Utilities | 3 | $41B |
|
||
| Healthcare | 2 | $330B |
|
||
Cash-flow waterfall
monthlySold comps — $/sqft
last 12 mo · ≤1 miLoading sold comps…