 Duplex
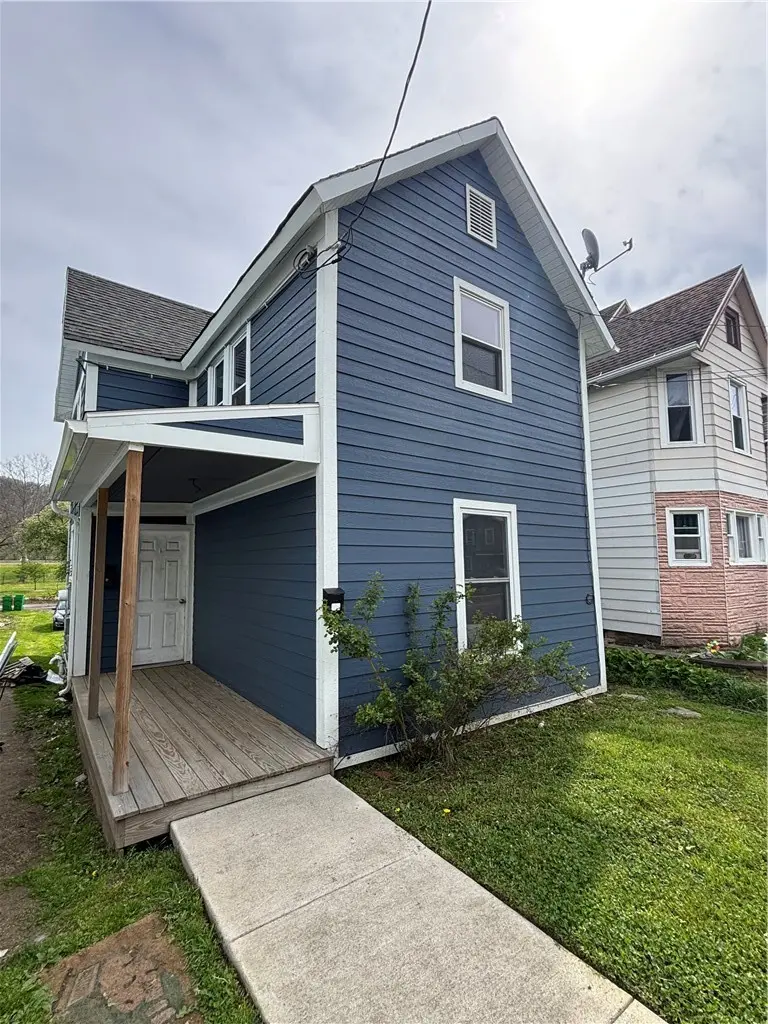
170 Park Ave · Corning, NY
Flood risk 1/10 · Minimal
- FEMA flood zone
- X
- Chance of flooding over 30 yrs
- 0.0%
- Est. flood insurance / yr
- $473 – $860
Fire risk 2/10 · Minimal
- Est. fire insurance / yr
- $691 – $1,283
Heat risk 3/10 · Minor
- Hot days now (above 94°F)
- 7 days/yr
- Hot days in 30 yrs
- 16 days/yr
Wind risk 1/10 · Minimal
- Chance of severe wind over 30 yrs
- 0.0%
Air-quality risk 1/10 · Minimal
- Unhealthy air days now
- 0 days/yr
- Unhealthy air days in 30 yrs
- 0 days/yr
Risk factors via First Street. Map © Google.
Why this score? — see what drove the B+ grade
The composite is a weighted blend of 9 inputs, each scored 0–100. Each bar is that input's sub-score; the figure is the points it added to the 100-point composite (weight × sub-score).
- Cash flow +30.0/30.0
- ARV discount +15.0/15.0
- 1% rule +10.0/10.0
- DSCR +10.0/10.0
- Livability +4.4/5.0
- Schools +4.2/10.0
- Rent growth +2.5/5.0
- Condition / age +2.5/5.0
- Appreciation +0.0/10.0
$175,000
🖨 Deal sheet 📄 Offer letter ✓ Due diligence
Multi-family units
County records classify this as Multi-Family (2-4 Unit). Listing-text estimate: 2 units. confirmed
Listing remarks MLS
Fully rented, affordable 2 unit in a convenient location, walking distance to Market St. & many local conveniences. Freshly painted exterior, lower level unit has many upgrades, upper unit needs a little TLC. Separate utilities & off street parking in the back.
Key facts
- Updating siding
- Updating flooring
- Updating windows
Tags
Property features AI
Finance
- Financial info: Owner pays water; water included in rent; Operating expenses include water/sewer; Two units with separate gas and electric meters; Each unit currently rents for $1,400
Exterior
- Parking: Two or more parking spaces
- Utilities: Public water connected; Sewer connected
- Home design: Two-story building; Resale property
- Construction: Fiber cement exterior; Existing construction
- Exterior features: Deck; Rectangular lot
Interior
- Kitchen: Each unit includes an oven/range and refrigerator
- Bedrooms: Two 3-bedroom units (each unit has 3 bedrooms)
- Flooring: Carpet; Varies by area
- Bathrooms: Two full bathrooms (one per unit)
- Heating & cooling: Forced air heating; Electric and gas heating options
- Interior features: Full basement; Carpet and varied flooring
- Laundry & utility: Gas water heater
Neighborhood map
What this means for you Summary
Snapshot
- This is a 2 × 3-bed/1.0-bath units multifamily listed at $175k.
Deal economics
- At list price, monthly cash flow is $1k ($18k/yr) — positive. Per door: $735/mo.
- The deal already cash-flows at list — no discount required.
- Meets the 1% rule at list price ($3k rent vs $175k).
- Recommended offer: $172k (1.5% below list) — sets the bar for market timing.
- Cap rate 16.4% vs local median 8.0% in Corning — top-decile yield for the area; either an underpriced asset or a hidden risk that comps aren't pricing in. Stress-test before assuming the spread holds.
Location & tenants
- Location reads 87/100 on livability (#14 in NY, #334 nationally) — a professional / high-income tenant draw. Strengths: amenities A+, housing A+, health & safety A+; Watch: employment D.
- Corning City School District (town): math 44% / reading 53% proficiency, ranked #406 of 590 in NY (top 69%) — families likely to look elsewhere, expect single-tenant / working-renter base with shorter leases.
- Market conditions: 106 active listings in the ZIP; 1 comparable units currently listed for rent nearby; 196 units permitted in Steuben County in 2024 (0 in 5+ unit buildings).
- At $3,370/mo this rent would consume 55% of the median local household income ($73k/yr) (locally 565% of renters already pay >50% of income on rent) — very limited rent-growth headroom before tenants either downsize or default.
Forward outlook
- Local home prices are declining (-3.0%/yr); year-one equity from $1k of loan paydown is wiped out by about $5k of value loss. Plan a longer hold.
- Steuben County population projected at -20% by 2050 — secular population decline; favor cash flow + early exit over multi-decade hold.
- At projected returns (-3.0% appreciation + 3.0% rent growth), your $49k cash investment doubles in ~4 years — after that, you're playing with house money.
Negotiation context
- It's been on market 15 days — a 2% lower offer ($172k) is reasonable based on typical stale-listing flexibility.
- 3 sale attempts since 13y ago with the ask held roughly flat each time — persistent listings suggest the price (not the market) is what's stuck; bring a comps-based counter.
- Current owner paid $48k; list at $175k implies a 265% gain — meaningful room to come down on a strong offer.
Risks & watch-outs
- Watch-outs: built in 1900 — expect roof / HVAC / electrical / plumbing capex.
Questions for the listing agent
- Can we see the unit-by-unit rent roll, current vacancy, and any below-market leases? What's the average tenancy length?
- What capital expenditures (roof, boiler, parking lot, exteriors) have been made in the last 5 years, and what's planned in the next 2?
- Built in 1900 — when were the roof, HVAC, electrical panel, plumbing, and water heater last replaced?
- Is there a deadline driving the sale (1031 exchange, divorce, estate, relocation)? That informs how much negotiation room exists.
- Schools are A-rated — typically a magnet for longer-tenancy family renters. What's the average tenant stay here, and is there a school-zone premium baked into asking?
- What's the average days-on-market for RENTAL listings here right now (not sales)? A rising rental-DOM trend means longer vacancies and softer asking-rent achievability than the comps imply.
- What's the recent tenant-quality profile in this submarket — average credit score on applications, eviction rate, late-payment / NSF rate, and stable-employment percentage? A property-management company in the area should have these aggregated.
- How much new apartment / multifamily construction is in the pipeline within 1–3 miles? Heavy new supply (>2% of stock underway) typically softens rents 12–24 months out; light construction supports rent growth.
Investment metrics
- 1% rule
- 1.93% ✓
- Cap rate
- 16.37%
- Cash-on-cash
- 35.99%
- DSCR
- 2.60
- GRM
- 4.3
CMA / ARV
- ARV (median comp)
- $232,549
- List price
- $175,000
- Delta
- -24.75%
- Verdict
- UNDERPRICED
- Comps
- 19 within 1.0 mi
Show comp detail 4 sales within ~0.75 mi
| Address | Dist | Beds/Ba | Sqft | Sold | Price | $/sf | Match |
|---|---|---|---|---|---|---|---|
| 360 E 1st St | 0.03mi | 4/2.0 | 2,099 (+6%) | 2mo | $70,000 | $33 | 88 |
| 224 E 3rd St | 0.37mi | 4/2.0 | 1,960 (-1%) | 7mo | $155,000 | $79 | 75 |
| 211, 213-215 Conhocton St | 0.21mi | 4/2.0 | 2,248 (+13%) | 10mo | $247,200 | $110 | 60 |
| 196-198 Steuben St | 0.21mi | 4/2.0 | 1,836 (-8%) | 23mo | $195,000 | $106 | 59 |
Match score weights: distance 35% · size 25% · config 20% · recency 20%. Top-matched comps best support the ARV.
Projected returns pro-forma
-3.0% appreciation · 3.0% rent growth · sell at horizon
- IRR
- 31.7%
- Equity multiple
- 2.33×
- Total profit
- $65,285
- Equity at exit
- $26,093
- IRR
- 38.8%
- Equity multiple
- 4.62×
- Total profit
- $177,541
- Equity at exit
- $15,131
Cash invested: $49,000 (down + closing). Projections, not guarantees.
Landlord ↔ Tenant lean methodology
- Overall (STATE)
- 15 Strongly Tenant-Friendly
- State New York
- 15 Strongly Tenant-Friendly · D+10
- County
- — inherits STATE
- City
- — inherits STATE
ZIP-level market 14830
- Active inventory
- 106
- Price-to-rent
- 8.7×
Monthly cashflow live
- Estimated rent
- $3,370 medium interval (Pro) →
- Mortgage (P&I)
- −$918
- Tax from tax record
- −$202 /mo · $2,424/yr
- Insurance
- −$73
- HOA
- −$0
- Vacancy / Maint / Mgmt
- −$708
- Net cashflow
- $1,470
Break-even live
2-unit breakdown (identical units grouped — click to expand)
| Units | Beds | Baths | Est. rent |
|---|---|---|---|
| 2× units | 3 | 1 | $3,370 |
| #1 | 3 | 1 | $1,685 |
| #2 | 3 | 1 | $1,685 |
| Total (2 units) | $3,370 | ||
UW: 25.0% down · 7.5% · 30yr · 1.5% tax · 5.0% vac · 8.0% maint · 8.0% mgmt
Financing live
Cash to close
- Down payment
- $43,750
- Closing costs
- $5,250
- Reserves months
- —
- Total cash needed
- —
Loan-product check · same deal, 3 products live
Conventional
25% down · 7.5% · 30yr
- Down + closing
- —
- Monthly P&I
- —
- Monthly cashflow
- —
- DSCR
- —
- Eligible?
- —
Personal DTI + credit; lowest rate.
DSCR
20% down · 8.5% · 30yr
- Down + closing
- —
- Monthly P&I
- —
- Monthly cashflow
- —
- DSCR
- —
- Eligible?
- —
No personal income docs; deal must DSCR.
Hard money
10% down · 12.0% · 12mo
- Down + closing
- —
- Monthly P&I
- —
- Monthly cashflow
- —
- DSCR
- —
- Eligible?
- —
Short-term bridge; refi at stabilization.
Rent comps 1 comps
| Address | Beds | Baths | Sqft | Rent | $/sqft | DOM | Units | Dist |
|---|---|---|---|---|---|---|---|---|
| 171 E 1st St Corning, NY | 3.0 | 2.5 | 1569 | $3,352 | $2.14 | 44d | 1 | 0.41mi |
Listing history 7 events
-
2026-05-06$175,000 Active 552-char remark
-
2018-03-14soldstatus $48,000
-
2018-03-12soldstatus $48,000 272-char remark
Show marketing remark (272 chars)
Fully rented, affordable 2 unit in a convenient location, walking distance to Market St. & many local conveniences. Freshly painted exterior, lower level unit has many upgrades, upper unit needs a little TLC. Separate utilities & off street parking in the back.
-
2017-12-01$49,900 272-char remark
Show marketing remark (272 chars)
Fully rented, affordable 2 unit in a convenient location, walking distance to Market St. & many local conveniences. Freshly painted exterior, lower level unit has many upgrades, upper unit needs a little TLC. Separate utilities & off street parking in the back.
-
2015-06-04soldstatus $36,000
-
2015-06-03soldstatus $36,000
Show marketing remark (151 chars)
Income property with long term tenant. There is off street parking behind the house and Denison Park is a few steps away for activities or relaxation.
-
2013-09-05$40,000
Show marketing remark (151 chars)
Income property with long term tenant. There is off street parking behind the house and Denison Park is a few steps away for activities or relaxation.
ⓘ Source: listings_history table (triggers on properties + properties_extension) + one-shot
backfill from property_details.listing_events for pre-trigger history.
Tax reassessment forecast NY · Partial reset (capped growth)
- Current annual tax
- $2,424 · $202/mo
- Projected year-2 tax
- $2,691 · $224/mo
- Expected delta
- +$267/yr (+$22/mo · 11.0%)
ⓘ Screening estimate from a state-policy table — verify with the county assessor before closing.
Climate risk First Street
- Flood 1/10 Low FEMA zone X · 0% chance over 30 yrs
- Wildfire 2/10 Low
- Heat 3/10 Moderate 7 d/yr ≥94°F today · 16 d/yr by 30 yrs out
- Wind 1/10 Low 0% chance of damaging wind over 30 yrs
- Air quality 1/10 Low 0 unhealthy d/yr today · 0 by 30 yrs out
Nearby sold comps map
Loading sold comps map…
Walkable amenities ~0.75 mi
Loading nearby amenities…
Taxation est. · year 1
- Rental income
- $40,440
- − Mortgage interest
- −$9,803
- − Property taxes
- −$2,424
- − Insurance
- −$875
- − Repairs & maintenance
- −$3,235
- − Management
- −$3,235
- − Depreciation
- −$5,091
- Taxable income
- $15,777
- Est. tax owed @ 24.0%
- −$3,786
- After-tax cash flow
- $13,849/yr
For passive investors: Depreciation is non-cash, so a rental often shows a tax loss while cash-flowing — sheltering income. Rental losses are passive: they offset passive income freely, and up to $25,000/yr can offset ordinary (W-2) income if you actively participate and your MAGI is under $100k (phasing out to $0 by $150k); unused losses carry forward. On sale, claimed depreciation is recaptured at up to 25%, and gains may owe capital-gains tax (a 1031 exchange can defer both). Figures are a year-1 estimate at your 24.0% rate — not tax advice; consult a CPA.
Schools (NCES district)
- District
- Corning City School District
- NCES district ID
- 3608400
- Math proficiency
- 44% ▼ -12.00%
- Reading proficiency
- 53% ▲ 4.00%
- Median HH income
- $53,042
- Composite
- 41.8/100
- National rank
- #3392
- State rank
- #406 of 590 in NY
Livability — Corning
- Score
- 87/100
- State rank
- #14
- US rank
- #334
Category grades
Schools grade is shown separately in the Schools card above.
Census & demographics
- Census place
- Corning, NY
- County
- Steuben County · 41,193 people
- City population
- 19,015
- Metro
- Corning, NY
- Population (ZIP)
- 19,015
- Household income
- $73,263
- Rent vs Own
- Severe rent burden
- 565.0
Population outlook (Steuben County) Hauer SSP2
- Today (2025)
- 93,062 people
- By 2030
- 89,793 · -3.5%
- By 2040
- 82,353 · -11.5%
- By 2050
- 74,286 · -20.2%
- By 2075
- 55,589 · -40.3%
- By 2100
- 37,587 · -59.6%
Race, ethnicity, and origin ACS 2023
- Neighborhood character
- Predominantly White (91%)
- Race & ethnicity
- White 91% Two or more races 3% Black 3% Hispanic / Latino 3% Asian 2%
- Common ancestry
- Romanian 4% Slovak 3% Lithuanian 2%
- Foreign-born
- 5% · Canada, China
- Languages at home
- 95% English-only · Russian/Polish/Slavic 1% Spanish 1% Other Asian/Pacific 1%
Political lean MEDSL · Steuben
- 2024 margin
- Solid R (+31.8) · D 34.1% · R 65.9%
- 2008→2024 swing
- -15.0pp toward R · 2008: -16.8pp · 2024: -31.8pp
- All cycles
- 2024: R+31.8 2020: R+29.6 2016: R+36.2 2012: R+16.4 2008: R+16.8
Not yet ingested
- Civics
- —
Market trends
- HPI YoY
- ▼ -94.59%
- Current HPI
- 173.9857
- Rent YoY
- —
- Metro
- Corning, NY
- State GDP YoY
- ▲ 2.60%
- F500 in state
- 92
Industry mix (Fortune 500 HQ in NY)
| Industry | F500 HQs | Revenue |
|---|---|---|
| Financial Services | 10 | $950B |
|
||
| Consumer Goods | 9 | $162B |
|
||
| Insurance | 4 | $225B |
|
||
| Telecommunications | 2 | $144B |
|
||
| Pharmaceuticals | 2 | $112B |
|
||
| Media / Entertainment | 2 | $69B |
|
||
Price history
+337.5% since first listed8 events — show timeline
- 2026-05-26 Pending — UNYREIS
- 2026-05-06 Listed $175,000 UNYREIS
- 2018-03-14 Sold (Public Records) $48,000 Public Records
- 2018-03-12 Sold (MLS) $48,000 UNYREIS
- 2017-12-01 Listed $49,900 UNYREIS
- 2015-06-04 Sold (Public Records) $36,000 Public Records
- 2015-06-03 Sold (MLS) $36,000 UNYREIS
- 2013-09-05 Listed $40,000 UNYREIS
Property tax history
+7.1%/yrLatest (2025): $2,424 · -1.9% YoY. Source: county tax records.
Cash-flow waterfall
monthlySold comps — $/sqft
last 12 mo · ≤1 miLoading sold comps…