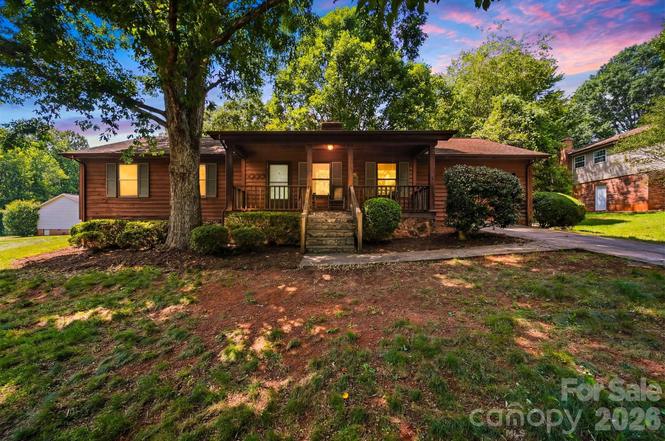
3315 23rd St NE · St. Stephens, NC
Flood risk 1/10 · Minimal
- FEMA flood zone
- X (unshaded)
- Chance of flooding over 30 yrs
- 0.0%
- Est. flood insurance / yr
- $507 – $1,088
Fire risk 4/10 · Minor
- Est. fire insurance / yr
- $906 – $1,684
Heat risk 5/10 · Moderate
- Hot days now (above 102°F)
- 7 days/yr
- Hot days in 30 yrs
- 18 days/yr
Wind risk 2/10 · Minimal
- Chance of severe wind over 30 yrs
- 2.0%
Air-quality risk 3/10 · Minor
- Unhealthy air days now
- 3 days/yr
- Unhealthy air days in 30 yrs
- 3 days/yr
Risk factors via First Street. Map © Google.
Why this score? — see what drove the B grade
The composite is a weighted blend of 9 inputs, each scored 0–100. Each bar is that input's sub-score; the figure is the points it added to the 100-point composite (weight × sub-score).
- Cash flow +27.3/30.0
- ARV discount +15.0/15.0
- DSCR +9.5/10.0
- 1% rule +6.7/10.0
- Schools +4.5/10.0
- Rent growth +3.5/5.0
- Livability +2.5/5.0
- Condition / age +2.5/5.0
- Appreciation +0.0/10.0
$149,900
🖨 Deal sheet 📄 Offer letter ✓ Due diligence
Listing remarks
Opportunity awaits in this ranch-style home in NE Hickory near Clyde Campbell School. Offering one-level living on 0.52-acre lot, this 3-bedroom, 2-bath home has excellent potential for someone ready to bring it back to life. A generous living room with fireplace, and a spacious dining area with a second fireplace where a wood stove once stood—perfect for those who want to reimagine or expand the kitchen. The home needs some updating, but the layout and location make it an excellent opportunity for anyone looking for affordable one-level living. Priced to sell and offered AS-IS. With some TLC, this home could truly shine.
Key facts
- 0.52-acre lot
- Second fireplace
- One-level living
Tags
Property features AI
Finance
- HOA & community: No HOA
Exterior
- Parking: Attached front-facing 1-car garage
- Utilities: City water; Septic installed
- Home design: Single-family residence (residential); One level; Crawl space foundation
- Construction: Site-built construction; Partial brick and wood exterior
- Exterior features: Covered front porch; Patio; Lot is level, sloped and wooded; Private maintained road access; Road surfaces include concrete, dirt and gravel
Interior
- Kitchen: Dishwasher; Refrigerator; Electric water heater
- Bedrooms: 3 bedrooms on the main level
- Flooring: Carpet; Vinyl
- Bathrooms: 2 full bathrooms on the main level
- Heating & cooling: Heat pump heating; Central air conditioning
- Interior features: 9 total rooms; Wood-burning fireplace with wood burning stove and additional features noted in remarks
- Laundry & utility: Dedicated laundry room on the main level; Washer; Dryer
Neighborhood map
What this means for you Summary
Snapshot
- This is a 3-bed/2.0-bath single-family listed at $150k.
Deal economics
- At list price, monthly cash flow is $435 ($5k/yr) — positive.
- The deal already cash-flows at list — no discount required.
- Meets the 1% rule at list price ($2k rent vs $150k).
- Cap rate 9.8% vs local median 4.3% in St. Stephens — top-decile yield for the area; either an underpriced asset or a hidden risk that comps aren't pricing in. Stress-test before assuming the spread holds.
Location & tenants
- Location reads: area grade B — affects rentability + tenant quality, not the cash-flow math above.
- Catawba County Schools (rural): math 54% / reading 51% proficiency, ranked #54 of 178 in NC (top 30%) — acceptable for families but not a draw, mixed tenant base, ~2y average lease.
- Zoned schools: Clyde Campbell Elementary (math 61% / reading 57%, grade B-, #228 of 1,410 statewide, top 16%, 479 students, 53% FRL); Saint Stephens High (math 68% / reading 60%, grade B-, #173 of 535 statewide, top 32%, 1,265 students, 53% FRL).
- Market conditions: Rents rising (+3.9%/yr); 423 active listings in the ZIP; 6 comparable units currently listed for rent nearby; rentals at typical pace (median 24d on market — plan ~3-4 weeks tenant-placement turnaround); 2,016 units permitted in Catawba County in 2024 (255 in 5+ unit buildings).
- This rent runs 31% of the median local income ($68k/yr) — at the standard rent-burdened threshold; future hikes will face affordability resistance.
Forward outlook
- Local home prices are declining (-3.0%/yr); year-one equity from $1k of loan paydown is wiped out by about $4k of value loss. Plan a longer hold.
- Catawba County population projected to shrink 7% by 2050 — rents likely to lag national; underwrite the cash flow, not the appreciation.
- At projected returns (-3.0% appreciation + 3.9% rent growth), your $42k cash investment doubles in ~9 years — after that, you're playing with house money.
Negotiation context
- Only 1 days on market — expect competitive offers; lowballing is unlikely to land.
Risks & watch-outs
- Climate carrying-cost: extreme-heat days projected 7→18/yr by 2055 (HVAC capex compounding) — expect insurance premiums to compound above CPI over the hold.
Questions for the listing agent
- Built in 1979 — when were the roof, HVAC, electrical panel, plumbing, and water heater last replaced?
- Is there a deadline driving the sale (1031 exchange, divorce, estate, relocation)? That informs how much negotiation room exists.
- What's the average days-on-market for RENTAL listings here right now (not sales)? A rising rental-DOM trend means longer vacancies and softer asking-rent achievability than the comps imply.
- What's the recent tenant-quality profile in this submarket — average credit score on applications, eviction rate, late-payment / NSF rate, and stable-employment percentage? A property-management company in the area should have these aggregated.
- How much new for-sale + rental construction is in the pipeline within 1–3 miles? Heavy new supply typically softens prices + rents 12–24 months out; constrained supply supports both.
Investment metrics
- 1% rule
- 1.17% ✓
- Cap rate
- 9.77%
- Cash-on-cash
- 12.42%
- DSCR
- 1.55
- GRM
- 7.1
CMA / ARV
- ARV (on-the-fly)
- $274,316
- Comps found
- 12
Show comp detail 12 sales within ~0.75 mi
| Address | Dist | Beds/Ba | Sqft | Sold | Price | $/sf | Match |
|---|---|---|---|---|---|---|---|
| 3157 28th St NE | 0.53mi | 3/1.5 | 1,345 (-1%) | 2mo | $267,200 | $199 | 70 |
| 2255 34th Avenue Dr NE | 0.03mi | 3/2.0 | 1,238 (-9%) | 18mo | $265,500 | $214 | 69 |
| 2416 33rd Ave NE | 0.14mi | 3/2.0 | 1,256 (-8%) | 22mo | $279,000 | $222 | 63 |
| 3230 25th St NE | 0.20mi | 3/1.5 | 1,250 (-8%) | 19mo | $185,000 | $148 | 60 |
| 2940 21st Street Ln NE | 0.55mi | 3/2.0 | 1,256 (-8%) | 3mo | $299,000 | $238 | 59 |
| 2745 33rd Ave NE | 0.46mi | 3/1.5 | 1,250 (-8%) | 11mo | $265,000 | $212 | 54 |
| 2002 34th Avenue Dr NE | 0.37mi | 3/1.5 | 1,250 (-8%) | 17mo | $252,275 | $202 | 53 |
| 3843 22nd St NE | 0.46mi | 3/2.0 | 1,555 (+14%) | 4mo | $176,000 | $113 | 51 |
| 1940 33rd Ave NE | 0.35mi | 3/1.0 | 1,203 (-11%) | 13mo | $219,500 | $182 | 50 |
| 2841 21st St NE | 0.72mi | 3/1.5 | 1,500 (+10%) | 8mo | $279,900 | $187 | 40 |
| 2825 21st Street Ln NE | 0.62mi | 2/2.0 (-1) | 1,247 (-8%) | 19mo | $284,400 | $228 | 37 |
| 4011 25th St NE | 0.71mi | 2/1.0 (-1) | 1,229 (-10%) | 19mo | $205,000 | $167 | 26 |
Match score weights: distance 35% · size 25% · config 20% · recency 20%. Top-matched comps best support the ARV.
Projected returns pro-forma
-3.0% appreciation · 3.91% rent growth · sell at horizon
- IRR
- 3.0%
- Equity multiple
- 1.12×
- Total profit
- $4,972
- Equity at exit
- $22,351
- IRR
- 13.4%
- Equity multiple
- 2.11×
- Total profit
- $46,605
- Equity at exit
- $12,961
Cash invested: $41,972 (down + closing). Projections, not guarantees.
Landlord ↔ Tenant lean methodology
- Overall (STATE)
- 85 Strongly Landlord-Friendly
- State North Carolina
- 85 Strongly Landlord-Friendly · R+3
- County
- — inherits STATE
- City
- — inherits STATE
ZIP-level market 28601
- Home prices YoY
- -27.2%
- Rents YoY
- 3.9%
- Active inventory
- 423
- Price-to-rent
- 7.1×
Monthly cashflow live
- Estimated rent
- $1,749 high interval (Pro) →
- Mortgage (P&I)
- −$786
- Tax from tax record
- −$99 /mo · $1,185/yr
- Insurance
- −$62
- HOA
- −$0
- Vacancy / Maint / Mgmt
- −$367
- Net cashflow
- $435
Break-even live
UW: 25.0% down · 7.5% · 30yr · 1.5% tax · 5.0% vac · 8.0% maint · 8.0% mgmt
Financing live
Cash to close
- Down payment
- $37,475
- Closing costs
- $4,497
- Reserves months
- —
- Total cash needed
- —
Loan-product check · same deal, 3 products live
Conventional
25% down · 7.5% · 30yr
- Down + closing
- —
- Monthly P&I
- —
- Monthly cashflow
- —
- DSCR
- —
- Eligible?
- —
Personal DTI + credit; lowest rate.
DSCR
20% down · 8.5% · 30yr
- Down + closing
- —
- Monthly P&I
- —
- Monthly cashflow
- —
- DSCR
- —
- Eligible?
- —
No personal income docs; deal must DSCR.
Hard money
10% down · 12.0% · 12mo
- Down + closing
- —
- Monthly P&I
- —
- Monthly cashflow
- —
- DSCR
- —
- Eligible?
- —
Short-term bridge; refi at stabilization.
Rent comps 6 comps
| Address | Beds | Baths | Sqft | Rent | $/sqft | DOM | Units | Dist |
|---|---|---|---|---|---|---|---|---|
| 1532 39th Avenue Loop NE #5 Hickory, NC | 3.0 | 2.5 | 1442 | $1,825 | $1.27 | 5d | 1 | 0.66mi |
| 1525 39th Avenue Loop NE #4 Hickory, NC | 3.0 | 2.5 | 1442 | $1,750 | $1.21 | 24d | 1 | 0.79mi |
| 1517 39th Avenue Loop NE Unit 7 Hickory, NC | 3.0 | 2.5 | 1500 | $1,775 | $1.18 | 14d | 1 | 0.83mi |
| 2830 16th St NE Hickory, NC | 1.0–3.0 | 1.0–2.0 | 959 | $1,620 | $1.69 | 12d | 1 | 1.07mi |
| 2753 34th Street Pl NE Unit A Hickory, NC | 3.0 | 2.5 | 1605 | $1,575 | $0.98 | 24d | 1 | 1.28mi |
| 2102 24th St NE Unit 29 Hickory, NC | 3.0 | 2.0 | 1248 | $1,600 | $1.28 | 24d | 1 | 1.39mi |
Listing history 2 events
-
2026-06-19remarks 629-char remark
-
2026-06-19$149,900 Active 1 DOM
ⓘ Source: listings_history table (triggers on properties + properties_extension) + one-shot
backfill from property_details.listing_events for pre-trigger history.
Tax reassessment forecast NC · Resets to sale price
- Current annual tax
- $1,185 · $99/mo
- Projected year-2 tax
- $1,229 · $102/mo
- Expected delta
- +$44/yr (+$4/mo · 3.7%)
ⓘ Screening estimate from a state-policy table — verify with the county assessor before closing.
Climate risk First Street
- Flood 1/10 Low FEMA zone X (unshaded) · 0% chance over 30 yrs
- Wildfire 4/10 Moderate
- Heat 5/10 Major 7 d/yr ≥102°F today · 18 d/yr by 30 yrs out
- Wind 2/10 Low 2% chance of damaging wind over 30 yrs
- Air quality 3/10 Moderate 3 unhealthy d/yr today · 3 by 30 yrs out
Nearby sold comps map
Loading sold comps map…
Walkable amenities ~0.75 mi
Loading nearby amenities…
Taxation est. · year 1
- Rental income
- $20,990
- − Mortgage interest
- −$8,397
- − Property taxes
- −$1,185
- − Insurance
- −$750
- − Repairs & maintenance
- −$1,679
- − Management
- −$1,679
- − Depreciation
- −$4,361
- Taxable income
- $2,939
- Est. tax owed @ 24.0%
- −$705
- After-tax cash flow
- $4,509/yr
For passive investors: Depreciation is non-cash, so a rental often shows a tax loss while cash-flowing — sheltering income. Rental losses are passive: they offset passive income freely, and up to $25,000/yr can offset ordinary (W-2) income if you actively participate and your MAGI is under $100k (phasing out to $0 by $150k); unused losses carry forward. On sale, claimed depreciation is recaptured at up to 25%, and gains may owe capital-gains tax (a 1031 exchange can defer both). Figures are a year-1 estimate at your 24.0% rate — not tax advice; consult a CPA.
Schools (NCES district)
- District
- Catawba County Schools
- NCES district ID
- 3700690
- Math proficiency
- 54% ▲ 9.00%
- Reading proficiency
- 51% ▲ 3.00%
- Median HH income
- $48,180
- Composite
- 44.71/100
- National rank
- #2754
- State rank
- #54 of 178 in NC
Livability — St. Stephens
No livability data for this city. (Only ~50 U.S. cities are tracked.)
Census & demographics
- Census place
- St. Stephens, NC
- County
- Catawba County · 105,763 people
- Metro
- Hickory-Lenoir-Morganton, NC
- Population (ZIP)
- 53,329
- Household income
- $67,817
- Rent vs Own
- Severe rent burden
- 1276.0
Population outlook (Catawba County) Hauer SSP2
- Today (2025)
- 156,513 people
- By 2030
- 155,267 · -0.8%
- By 2040
- 151,110 · -3.5%
- By 2050
- 145,524 · -7.0%
- By 2075
- 134,047 · -14.4%
- By 2100
- 119,424 · -23.7%
Race, ethnicity, and origin ACS 2023
- Neighborhood character
- Predominantly White (73%)
- Race & ethnicity
- White 73% Hispanic / Latino 9% Black 8% Two or more races 7% Asian 4%
- Hispanic origin (detail)
- Mexican 5% Puerto Rican 2%
- Common ancestry
- Italian 4% Slovak 2% Serbian 2%
- Foreign-born
- 8% · Canada, Vietnam
- Languages at home
- 88% English-only · Spanish 7% Other Asian/Pacific 3% Other Indo-European 1%
Political lean MEDSL · Catawba
- 2024 margin
- Solid R (+38.0) · D 30.6% · R 68.6%
- 2008→2024 swing
- -13.0pp toward R · 2008: -25.0pp · 2024: -38.0pp
- All cycles
- 2024: R+38.0 2020: R+37.0 2016: R+38.0 2012: R+29.6 2008: R+25.0
Not yet ingested
- Civics
- —
Market trends
- HPI YoY
- ▼ -89.98%
- Current HPI
- 241.0743
- Rent YoY
- ▲ 3.91%
- Metro
- Hickory-Lenoir-Morganton, NC
- State GDP YoY
- ▲ 3.28%
- F500 in state
- 26
Industry mix (Fortune 500 HQ in NC)
| Industry | F500 HQs | Revenue |
|---|---|---|
| Financial Services | 2 | $213B |
|
||
| Retail | 2 | $95B |
|
||
| Industrial Conglomerate | 1 | $38B |
|
||
| Metals / Steel | 1 | $35B |
|
||
| Utilities | 1 | $30B |
|
||
| Industrial Machinery | 1 | $19B |
|
||
Price history
1 event — show timeline
- 2026-06-18 Listed $149,900 CANOPYMLS as Distributed by MLS Grid
Property tax history
+5.2%/yrLatest (2024): $1,185 · +4.0% YoY. Source: county tax records.
Cash-flow waterfall
monthlySold comps — $/sqft
last 12 mo · ≤1 miLoading sold comps…