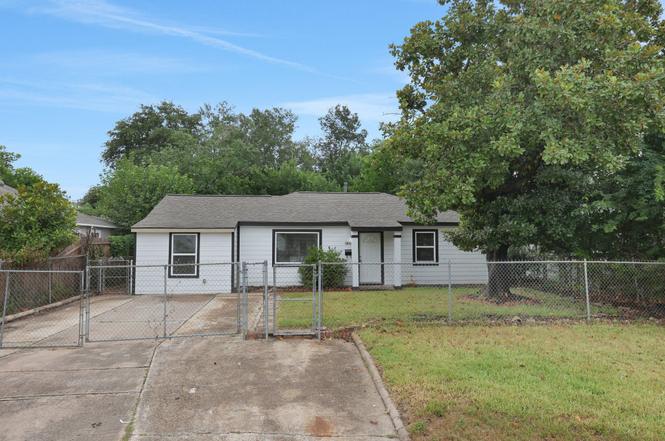
9409 Fairland Dr · Houston, TX
Flood risk 6/10 · Moderate
- FEMA flood zone
- X (unshaded)
- Chance of flooding over 30 yrs
- 0.69%
- Est. flood insurance / yr
- $507 – $1,088
Fire risk 2/10 · Minimal
- Est. fire insurance / yr
- $1,222 – $2,270
Heat risk 9/10 · Severe
- Hot days now (above 109°F)
- 7 days/yr
- Hot days in 30 yrs
- 24 days/yr
Wind risk 9/10 · Severe
- Chance of severe wind over 30 yrs
- 99.0%
Air-quality risk 2/10 · Minimal
- Unhealthy air days now
- 2 days/yr
- Unhealthy air days in 30 yrs
- 2 days/yr
Risk factors via First Street. Map © Google.
Why this score? — see what drove the D- grade
The composite is a weighted blend of 9 inputs, each scored 0–100. Each bar is that input's sub-score; the figure is the points it added to the 100-point composite (weight × sub-score).
- Appreciation +10.0/10.0
- Cash flow +8.5/30.0
- Rent growth +3.7/5.0
- Livability +3.7/5.0
- Schools +2.7/10.0
- 1% rule +2.6/10.0
- Condition / age +2.5/5.0
- DSCR +2.3/10.0
- ARV discount +0.3/15.0
$199,900
🖨 Deal sheet (PDF) 📄 Offer letter ✓ Due diligence
Listing remarks
This newly renovated home features 4 bedrooms and 2 updated bathrooms. The open-concept kitchen and living room create a welcoming space ideal for entertaining or family gatherings. Additional highlights include a dedicated laundry room, a brand-new roof, upgraded AC unit, new piping, and modern fixtures throughout. Move-in ready and thoughtfully updated—this home is a must-see!
Key facts
- Renovated
- Generously sized lot
- Shopping
Tags
Property features AI
Finance
- Financial info: Lease not considered
Exterior
- Utilities: Public water; Public sewer
- Home design: Residential property; Single-story (all main rooms on the first floor)
- Construction: Wood siding construction; Shingle and wood roof; Slab foundation; Built in 1955
- Exterior features: Cleared lot
Interior
- Kitchen: Dishwasher; Disposal; Gas oven; Gas range; Microwave
- Bedrooms: Primary bedroom on the first floor (approx. 12 x 10); Three additional first-floor bedrooms (approx. 12 x 10; 10 x 10; 9 x 10)
- Flooring: Laminate
- Bathrooms: 2 full bathrooms
- Heating & cooling: Central heating (gas); Central electric air conditioning
- Interior features: Washer hookup and gas dryer hookup; Dishwasher, Disposal, Gas Oven, Gas Range, Microwave; Laminate flooring
- Laundry & utility: Washer hookup; Gas dryer hookup
Neighborhood map
What this means for you Summary
Snapshot
- This is a 3-bed/1.0-bath single-family listed at $200k.
Deal economics
- At list price, monthly cash flow is $-176 ($-2k/yr) — negative.
- To cash-flow at today's rent, offer at most $169k (15.6% below list).
- To meet the 1% rule (rent ≥ 1% of price), the offer needs to be $151k (24.3% below list).
- Recommended offer: $151k (24.3% below list) — sets the bar for 1% rule.
- Cap rate 5.2% vs local median 3.2% in Houston — top-decile yield for the area; either an underpriced asset or a hidden risk that comps aren't pricing in. Stress-test before assuming the spread holds.
Location & tenants
- Location reads 74/100 on livability (#184 in TX, #4,771 nationally) — a middle-class / working-renter tenant base. Strengths: amenities A+, cost of living A+, housing A+; Watch: crime F.
- Houston ISD (urban): math 27% / reading 35% proficiency, ranked #593 of 826 in TX (top 72%) — families likely to look elsewhere, expect single-tenant / working-renter base with shorter leases; 71% free/reduced lunch — lower-income household profile, screen leases tightly.
- Zoned schools: Reynolds El (math 8% / reading 8%, grade F, #4,301 of 4,322 statewide, top 100%, 334 students, 98% FRL); Attucks Middle (math 15% / reading 22%, grade F, #1,478 of 1,662 statewide, top 90%, 439 students, 98% FRL); Worthing H S (math 22% / reading 21%, grade F, #1,377 of 1,632 statewide, top 85%, 827 students, 96% FRL) — zoned schools average 97% FRL vs 71% district-wide (26 pts higher); higher-poverty schools than district average — tighter screening recommended.
- Zoned-school proficiency averages 16% at this address vs 31% district-wide (-15 pts) — the specific schools serving this property underperform the Houston ISD average; the district grade overstates school quality for this exact location.
- Market conditions: Rents rising fast (+4.8%/yr); 321 active listings in the ZIP; 21 comparable units currently listed for rent nearby; rentals at typical pace (median 20d on market — plan ~3-4 weeks tenant-placement turnaround); lower-income renter base — watch delinquency; 29,883 units permitted in Harris County in 2024 (8,621 in 5+ unit buildings).
Forward outlook
- In year one you build about $21k of equity ($1k loan paydown + $20k appreciation (10.0% local appreciation)).
- Harris County population projected at +47% by 2050 — long-run rental-demand tailwind backs the buy-and-hold thesis.
- By year 2, paydown + projected appreciation supports a ~$34k cash-out refi (75% LTV) — recoverable capital for the next deal without selling this one.
Negotiation context
- Only 4 days on market — expect competitive offers; lowballing is unlikely to land.
- 6 sale attempts since 2y ago with the ask held roughly flat each time — persistent listings suggest the price (not the market) is what's stuck; bring a comps-based counter.
Risks & watch-outs
- Watch-outs: built in 1955 — expect roof / HVAC / electrical / plumbing capex.
- Climate carrying-cost: major flood risk; severe wind risk, 99% chance of damaging wind over 30y; extreme-heat days projected 7→24/yr by 2055 (HVAC capex compounding) — expect insurance premiums to compound above CPI over the hold.
Questions for the listing agent
- What do current leases actually rent for vs. the listed asking? Can we see a recent rent roll and the last 12 months of T-12 income?
- Built in 1955 — when were the roof, HVAC, electrical panel, plumbing, and water heater last replaced?
- Is there a deadline driving the sale (1031 exchange, divorce, estate, relocation)? That informs how much negotiation room exists.
- Schools are D-rated, which usually means shorter tenancies and higher turnover. Who's the typical renter profile here, and what's been the actual vacancy rate?
- Crime grade is F in this area — have there been break-ins, vandalism, or insurance claims at this property in the last 3 years? What carrier currently insures it and at what premium?
- The area grade is low — what's the realistic commute time and amenity access for the typical tenant pool here? Any planned neighborhood developments (good or bad) we should know about?
- What's the average days-on-market for RENTAL listings here right now (not sales)? A rising rental-DOM trend means longer vacancies and softer asking-rent achievability than the comps imply.
- What's the recent tenant-quality profile in this submarket — average credit score on applications, eviction rate, late-payment / NSF rate, and stable-employment percentage? A property-management company in the area should have these aggregated.
- How much new for-sale + rental construction is in the pipeline within 1–3 miles? Heavy new supply typically softens prices + rents 12–24 months out; constrained supply supports both.
Investment metrics
- 1% rule
- 0.76% ✗
- Cap rate
- 5.24%
- Cash-on-cash
- -3.77%
- DSCR
- 0.83
- GRM
- 11.0
CMA / ARV
- ARV (on-the-fly)
- $172,260
- Comps found
- 12
Show comp detail 12 sales within ~0.75 mi
| Address | Dist | Beds/Ba | Sqft | Sold | Price | $/sf | Match |
|---|---|---|---|---|---|---|---|
| 9321 Cathedral Dr | 0.13mi | 3/1.0 | 1,204 (+1%) | 4mo | $159,000 | $132 | 88 |
| 10006 Chesterfield Dr | 0.36mi | 3/1.0 | 1,170 (-2%) | 3mo | $125,000 | $107 | 78 |
| 10205 Sierra Dr | 0.46mi | 3/1.0 | 1,151 (-3%) | 3mo | $120,000 | $104 | 71 |
| 3034 Corksie St | 0.54mi | 3/2.0 | 1,225 (+3%) | 0mo | $219,900 | $180 | 65 |
| 10209 Cathedral Dr | 0.48mi | 3/1.5 | 1,244 (+5%) | 3mo | $180,000 | $145 | 65 |
| 9506 Sierra Dr | 0.12mi | 4/2.0 (+1) | 1,316 (+11%) | 3mo | $160,000 | $122 | 65 |
| 10014 Sierra Dr | 0.37mi | 4/2.0 (+1) | 1,243 (+5%) | 2mo | $185,000 | $149 | 65 |
| 3138 Sunbeam St | 0.39mi | 3/1.0 | 1,091 (-8%) | 7mo | $109,900 | $101 | 62 |
| 3334 Dulcrest St | 0.71mi | 3/1.0 | 1,122 (-6%) | 3mo | $90,000 | $80 | 55 |
| 3018 Elpyco St | 0.74mi | 4/2.0 (+1) | 1,215 (+2%) | 2mo | $187,000 | $154 | 52 |
| 10118 Cathedral Dr | 0.45mi | 4/2.0 (+1) | 1,293 (+9%) | 7mo | $200,000 | $155 | 49 |
| 4210 Larkspur St | 0.66mi | 3/2.0 | 1,281 (+8%) | 5mo | $199,000 | $155 | 48 |
Match score weights: distance 35% · size 25% · config 20% · recency 20%. Top-matched comps best support the ARV.
Projected returns pro-forma
10.0% appreciation · 4.77% rent growth · sell at horizon
- IRR
- 22.1%
- Equity multiple
- 2.79×
- Total profit
- $100,420
- Equity at exit
- $180,086
- IRR
- 20.3%
- Equity multiple
- 6.55×
- Total profit
- $310,556
- Equity at exit
- $388,362
Cash invested: $55,972 (down + closing). Projections, not guarantees.
Landlord ↔ Tenant lean methodology
- Overall (STATE)
- 87 Strongly Landlord-Friendly
- State Texas
- 87 Strongly Landlord-Friendly · R+5
- County
- — inherits STATE
- City
- — inherits STATE
ZIP-level market 77051
- Home prices YoY
- 9.7%
- Rents YoY
- 4.8%
- Active inventory
- 321
- Price-to-rent
- 11.0×
Monthly cashflow live
- Estimated rent
- $1,514 high interval (Pro) →
- Mortgage (P&I)
- −$1,048
- Tax from tax record
- −$241 /mo · $2,888/yr
- Insurance
- −$83
- HOA
- −$0
- Vacancy / Maint / Mgmt
- −$318
- Net cashflow
- $-176
Break-even live
Sensitivity live
| Price | -10% $-63 | -5% $-119 | +0% $-176 | +5% $-233 | +10% $-289 |
|---|---|---|---|---|---|
| Rent | -10% $-296 | -5% $-236 | +0% $-176 | +5% $-116 | +10% $-56 |
| Rate | -1.0pp $-75 | -0.5pp $-125 | base $-176 | +0.5pp $-228 | +1.0pp $-281 |
UW: 25.0% down · 7.5% · 30yr · 1.5% tax · 5.0% vac · 8.0% maint · 8.0% mgmt
Financing live
Cash to close
- Down payment
- $49,975
- Closing costs
- $5,997
- Reserves months
- —
- Total cash needed
- —
Loan-product check · same deal, 3 products live
Conventional
25% down · 7.5% · 30yr
- Down + closing
- —
- Monthly P&I
- —
- Monthly cashflow
- —
- DSCR
- —
- Eligible?
- —
Personal DTI + credit; lowest rate.
DSCR
20% down · 8.5% · 30yr
- Down + closing
- —
- Monthly P&I
- —
- Monthly cashflow
- —
- DSCR
- —
- Eligible?
- —
No personal income docs; deal must DSCR.
Hard money
10% down · 12.0% · 12mo
- Down + closing
- —
- Monthly P&I
- —
- Monthly cashflow
- —
- DSCR
- —
- Eligible?
- —
Short-term bridge; refi at stabilization.
Rent comps 21 comps
| Address | Beds | Baths | Sqft | Rent | $/sqft | DOM | Units | Dist |
|---|---|---|---|---|---|---|---|---|
| 9414 Heno St Unit 13 Houston, TX | 2.0 | 1.0 | 824 | $900 | $1.09 | 26d | 1 | 0.36mi |
| 4112 Grassmere St Houston, TX | 2.0 | 1.0 | 711 | $700 | $0.98 | 12d | 1 | 0.44mi |
| 4205 Grassmere St Houston, TX | 2.0 | 1.0 | 824 | $900 | $1.09 | 26d | 1 | 0.49mi |
| 2910 Reed Rd Houston, TX | 3.0 | 2.0 | 1221 | $1,228 | $1.01 | 1d | 3 | 0.51mi |
| 2889 Reed Rd Houston, TX | 1.0–2.0 | 1.0–2.0 | 997 | $1,648 | $1.65 | 4d | 2 | 0.61mi |
| 4205 Phlox St Unit 2 BEDROOM 6 Houston, TX | 2.0 | 1.0 | 736 | $860 | $1.17 | 19d | 1 | 0.61mi |
| 4207 Phlox St Houston, TX | 2.0 | 1.0 | 736 | $962 | $1.31 | 1d | 2 | 0.63mi |
| 10510 Cathedral Dr Houston, TX | 3.0 | 1.0 | 887 | $1,300 | $1.47 | 45d | 1 | 0.66mi |
| 2725 Reed Rd Houston, TX | 1.0–3.0 | 1.0–2.5 | 911 | $975 | $1.07 | 45d | 1 | 0.74mi |
| 4326 Larkspur St Unit 3 Houston, TX | 2.0 | 1.0 | 800 | $1,200 | $1.50 | 18d | 1 | 0.76mi |
| 3137 W Bellfort Ave Houston, TX | 2.0 | 2.0 | 1164 | $1,802 | $1.55 | 45d | 1 | 0.99mi |
| 8328 Corinth St Unit B Houston, TX | 3.0 | 2.5 | 1500 | $2,800 | $1.87 | 22d | 1 | 1.11mi |
| 4526 Knoxville St Unit A Houston, TX | 3.0 | 2.5 | 1474 | $1,775 | $1.20 | 16d | 1 | 1.14mi |
| 4117 Shelby Cir Unit 1230900P Houston, TX | 4.0 | 2.0 | 1367 | $5,253 | $3.84 | 1d | 1 | 1.16mi |
| 4410 Bellfort Ave Unit 4404 8 Houston, TX | 2.0 | 1.0 | 812 | $999 | $1.23 | 9d | 1 | 1.24mi |
| 4723 Mallow St Houston, TX | 3.0 | 2.5 | 1472 | $1,850 | $1.26 | 7d | 1 | 1.25mi |
| 4810 Wilmington St Unit A Houston, TX | 3.0 | 2.0 | 1165 | $1,650 | $1.42 | 45d | 1 | 1.32mi |
| 8521 Dosia St Houston, TX | 3.0 | 2.0 | 1028 | $1,665 | $1.62 | 14d | 1 | 1.34mi |
| 8010 Livingston St Houston, TX | 3.0 | 2.0 | 1400 | $1,800 | $1.29 | 45d | 1 | 1.40mi |
| 4322 Groton Dr Houston, TX | 3.0 | 1.0 | 858 | $1,395 | $1.63 | 45d | 1 | 1.41mi |
| 4918 Wilmington St Unit A Houston, TX | 3.0 | 3.0 | 1300 | $2,100 | $1.62 | 45d | 1 | 1.45mi |
Listing history 25 events
-
2026-06-21days on market $199,900 Active 4 DOM
-
2026-06-17pricedays on market $199,900 Active 1 DOM
-
2026-06-04days on market $195,990 Active 117 DOM
-
2026-06-01days on market $195,990 Active 114 DOM
-
2026-05-31days on market $195,990 Active 113 DOM
-
2026-05-22price $195,990
-
2026-05-20status Active
-
2026-04-25status Pending
-
2026-03-18price $180,990
-
2026-02-16price $189,990
-
2026-01-13$200,000 Active
-
2026-01-01historical $1,800
-
2025-12-13status Pending
-
2025-12-04historical
-
2025-10-30$1,800
-
2025-10-16$207,000 Active
-
2025-09-30historical
-
2025-07-29price $219,990
-
2025-05-21$239,990 Active
-
2024-03-12soldstatus
-
2024-03-07soldstatus Sold
-
2024-02-16status Pending, Continue to Show
-
2024-02-06$137,000 Active
-
2008-02-18soldstatus
-
1997-10-11soldstatus
ⓘ Source: listings_history table (triggers on properties + properties_extension) + one-shot
backfill from property_details.listing_events for pre-trigger history.
Tax reassessment forecast TX · Resets to sale price
- Current annual tax
- $2,888 · $241/mo
- Projected year-2 tax
- $3,658 · $305/mo
- Expected delta
- +$770/yr (+$64/mo · 26.7%)
ⓘ Screening estimate from a state-policy table — verify with the county assessor before closing.
Climate risk First Street
- Flood 6/10 Major FEMA zone X (unshaded) · 69% chance over 30 yrs
- Wildfire 2/10 Low
- Heat 9/10 Extreme 7 d/yr ≥109°F today · 24 d/yr by 30 yrs out
- Wind 9/10 Extreme 99% chance of damaging wind over 30 yrs
- Air quality 2/10 Low 2 unhealthy d/yr today · 2 by 30 yrs out
Nearby sold comps map
Loading sold comps map…
Walkable amenities ~0.75 mi
Loading nearby amenities…
Taxation est. · year 1
- Rental income
- $18,170
- − Mortgage interest
- −$11,198
- − Property taxes
- −$2,888
- − Insurance
- −$1,000
- − Repairs & maintenance
- −$1,454
- − Management
- −$1,454
- − Depreciation
- −$5,815
- Taxable loss
- −$5,637
- Est. tax savings @ 24.0%
- +$1,353
- After-tax cash flow
- $-760/yr
For passive investors: Depreciation is non-cash, so a rental often shows a tax loss while cash-flowing — sheltering income. Rental losses are passive: they offset passive income freely, and up to $25,000/yr can offset ordinary (W-2) income if you actively participate and your MAGI is under $100k (phasing out to $0 by $150k); unused losses carry forward. On sale, claimed depreciation is recaptured at up to 25%, and gains may owe capital-gains tax (a 1031 exchange can defer both). Figures are a year-1 estimate at your 24.0% rate — not tax advice; consult a CPA.
Schools (NCES district)
- District
- Houston ISD
- NCES district ID
- 4823640
- Math proficiency
- 27% ▼ -18.00%
- Reading proficiency
- 35% ▼ -6.00%
- Median HH income
- $46,054
- Composite
- 26.63/100
- National rank
- #7173
- State rank
- #593 of 826 in TX
Livability — Houston
- Score
- 74/100
- State rank
- #184
- US rank
- #4771
Category grades
Schools grade is shown separately in the Schools card above.
Census & demographics
- Census place
- Houston, TX
- County
- Harris County · 4,702,590 people
- City population
- 3,226,434
- Metro
- Houston-The Woodlands-Sugar Land, TX
- Population (ZIP)
- 19,795
- Household income
- $37,415
- Rent vs Own
- Severe rent burden
- 1446.0
Population outlook (Harris County) Hauer SSP2
- Today (2025)
- 5,571,493 people
- By 2030
- 6,089,821 · +9.3%
- By 2040
- 7,142,806 · +28.2%
- By 2050
- 8,185,864 · +46.9%
- By 2075
- 10,574,329 · +89.8%
- By 2100
- 12,109,958 · +117.4%
Race, ethnicity, and origin ACS 2023
- Neighborhood character
- Predominantly Black (77%)
- Race & ethnicity
- Black 77% Hispanic / Latino 16% Two or more races 11% White 3%
- Hispanic origin (detail)
- Mexican 6% Puerto Rican 1%
- Foreign-born
- 8% · Canada, China
- Languages at home
- 88% English-only · Spanish 10%
Political lean MEDSL · Harris
- 2024 margin
- Lean D (+5.5) · D 52.0% · R 46.4% · Other 1.6%
- 2008→2024 swing
- +3.9pp toward D · 2008: 1.6pp · 2024: 5.5pp
- All cycles
- 2024: D+5.5 2020: D+13.3 2016: D+12.4 2012: D+0.1 2008: D+1.6
Not yet ingested
- Civics
- —
Market trends
- HPI YoY
- ▲ 16.02%
- Current HPI
- 180.4283
- Rent YoY
- ▲ 4.77%
- Metro
- Houston-The Woodlands-Sugar Land, TX
- State GDP YoY
- ▲ 3.95%
- F500 in state
- 110
Industry mix (Fortune 500 HQ in TX)
| Industry | F500 HQs | Revenue |
|---|---|---|
| Energy | 16 | $1,198B |
|
||
| Technology | 5 | $198B |
|
||
| Engineering / Construction | 4 | $72B |
|
||
| Energy Services | 3 | $60B |
|
||
| Utilities | 3 | $41B |
|
||
| Healthcare | 2 | $330B |
|
||
Price history
+43.1% since first listed20 events — show timeline
- 2026-05-22 Price Changed $195,990 HARMLS
- 2026-05-20 Relisted — HARMLS
- 2026-04-25 Pending — HARMLS
- 2026-03-18 Price Changed $180,990 HARMLS
- 2026-02-16 Price Changed $189,990 HARMLS
- 2026-01-13 Listed $200,000 HARMLS
- 2026-01-01 Rental Removed $1,800 HARMLS
- 2025-12-13 Pending — HARMLS
- 2025-12-04 Listing Removed — HARMLS
- 2025-10-30 Listed for Rent $1,800 HARMLS
- 2025-10-16 Listed $207,000 HARMLS
- 2025-09-30 Listing Removed — HARMLS
- 2025-07-29 Price Changed $219,990 HARMLS
- 2025-05-21 Listed $239,990 HARMLS
- 2024-03-12 Sold (Public Records) — Public Records
- 2024-03-07 Sold (MLS) — HARMLS
- 2024-02-16 Pending — HARMLS
- 2024-02-06 Listed $137,000 HARMLS
- 2008-02-18 Sold (Public Records) — Public Records
- 1997-10-11 Sold (Public Records) — Public Records
Property tax history
+8.1%/yrLatest (2025): $2,888 · +6.2% YoY. Source: county tax records.
Cash-flow waterfall
monthlySold comps — $/sqft
last 12 mo · ≤1 miLoading sold comps…