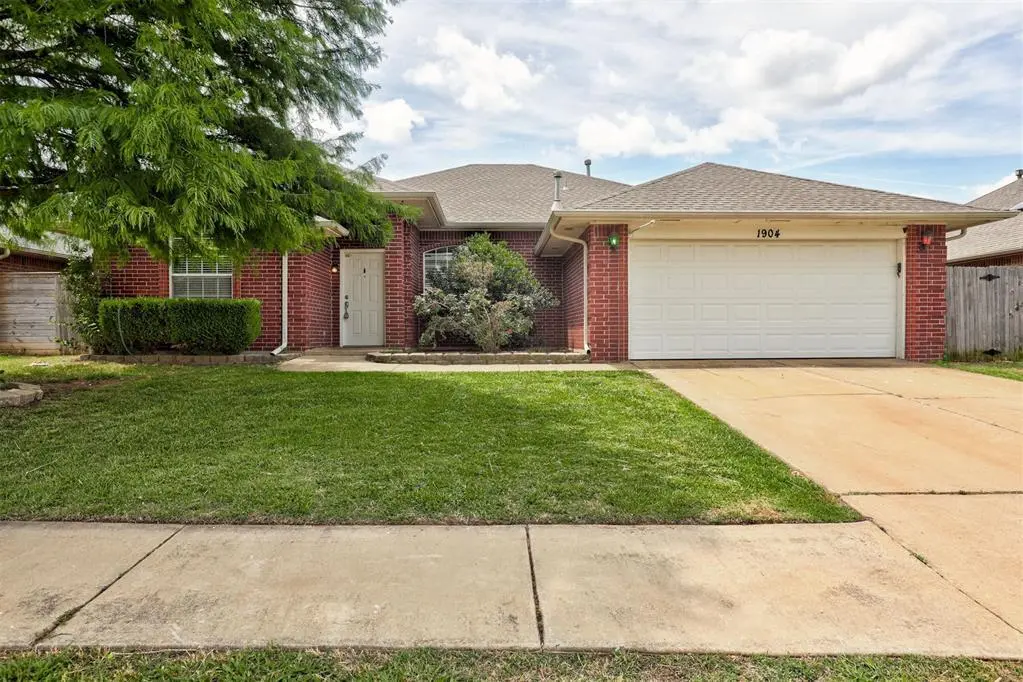
1904 NW 176th St · Oklahoma City, OK
Flood risk 1/10 · Minimal
- FEMA flood zone
- X (unshaded)
- Chance of flooding over 30 yrs
- 0.0%
- Est. flood insurance / yr
- $507 – $1,088
Fire risk 4/10 · Minor
- Est. fire insurance / yr
- $2,463 – $4,575
Heat risk 6/10 · Moderate
- Hot days now (above 108°F)
- 7 days/yr
- Hot days in 30 yrs
- 19 days/yr
Wind risk 2/10 · Minimal
- Chance of severe wind over 30 yrs
- 2.0%
Air-quality risk 2/10 · Minimal
- Unhealthy air days now
- 2 days/yr
- Unhealthy air days in 30 yrs
- 2 days/yr
Risk factors via First Street. Map © Google.
Why this score? — see what drove the D+ grade
The composite is a weighted blend of 9 inputs, each scored 0–100. Each bar is that input's sub-score; the figure is the points it added to the 100-point composite (weight × sub-score).
- ARV discount +15.0/15.0
- Cash flow +11.9/30.0
- Livability +4.0/5.0
- Schools +3.6/10.0
- DSCR +3.5/10.0
- 1% rule +3.3/10.0
- Rent growth +2.8/5.0
- Condition / age +2.5/5.0
- Appreciation +0.0/10.0
$265,000
🖨 Deal sheet 📄 Offer letter ✓ Due diligence
Listing remarks MLS
Open floor plan with space galore. 2 huge living areas; split floor plan; kitchen is open to living area with breakfast bar, lots of counter space, storage and pantry; big bedrooms with ample closet space and on a split floor plan. Many updated features: appliances, water tank in '14, new fencing in '11, whole house gutters; 15 SEER AC in '10 and flat safe shelter in '08 to name a few. Great Home.
Key facts
- Beautiful fireplace
- Natural light
- Two living areas
Tags
Property features AI
Finance
- Other: Living area reported as 2,058 (assessor); No storm shelter
- Financial info: Cash, Conventional, FHA or VA accepted; Loan qualification available; Not assumable
- HOA & community: Mandatory association dues; Association fee $230 (includes common area maintenance)
Exterior
- Parking: 2-car garage
- Home design: Single family residence; One-level entry
- Construction: Frame and masonry veneer construction; Composition roof; Slab foundation; Existing property
- Exterior features: Porch; Interior lot
Interior
- Bedrooms: 4 bedrooms
- Bathrooms: 2 full bathrooms; 1 half bathroom
- Interior features: One living area; Gas log fireplace
Neighborhood map
What this means for you Summary
Snapshot
- This is a 4-bed/3.0-bath single-family listed at $265k.
Deal economics
- At list price, monthly cash flow is $-70 ($-839/yr) — negative.
- To cash-flow at today's rent, offer at most $253k (4.7% below list).
- To meet the 1% rule (rent ≥ 1% of price), the offer needs to be $219k (17.4% below list).
- Recommended offer: $219k (17.4% below list) — sets the bar for 1% rule.
- Cap rate 6.0% vs local median 3.7% in Oklahoma City — top-decile yield for the area; either an underpriced asset or a hidden risk that comps aren't pricing in. Stress-test before assuming the spread holds.
Location & tenants
- Location reads 80/100 on livability (#3 in OK, #1,635 nationally) — a professional / high-income tenant draw. Strengths: amenities A+, commute A+, cost of living A+; Watch: crime F.
- Edmond (suburban): math 38% / reading 40% proficiency, ranked #11 of 270 in OK (top 4%) — families likely to look elsewhere, expect single-tenant / working-renter base with shorter leases.
- Zoned schools: West Field Es (math 40% / reading 45%, grade F, #83 of 845 statewide, top 10%, 852 students, 0% FRL); Santa Fe Hs (math 36% / reading 52%, grade F, #18 of 447 statewide, top 4%, 2,796 students, 0% FRL) — zoned schools average 0% FRL vs 22% district-wide (22 pts lower); this property's tenant base skews higher-income than the district average.
- Market conditions: Rents rising (+1.2%/yr); 626 active listings in the ZIP; 40 comparable units currently listed for rent nearby; rentals at typical pace (median 15d on market — plan ~3-4 weeks tenant-placement turnaround); high-income renter base; 5,365 units permitted in Oklahoma County in 2024 (569 in 5+ unit buildings).
Forward outlook
- Local home prices are declining (-3.0%/yr); year-one equity from $2k of loan paydown is wiped out by about $8k of value loss. Plan a longer hold.
- Oklahoma County population projected at +41% by 2050 — long-run rental-demand tailwind backs the buy-and-hold thesis.
Negotiation context
- Only 5 days on market — expect competitive offers; lowballing is unlikely to land.
- 5 sale attempts since 25y ago with the ask held roughly flat each time — persistent listings suggest the price (not the market) is what's stuck; bring a comps-based counter.
- Current owner paid $179k; 48% above their basis — modest negotiation headroom, anchor on the comps not their cost.
Risks & watch-outs
- Climate carrying-cost: extreme-heat days projected 7→19/yr by 2055 (HVAC capex compounding) — expect insurance premiums to compound above CPI over the hold.
Questions for the listing agent
- What do current leases actually rent for vs. the listed asking? Can we see a recent rent roll and the last 12 months of T-12 income?
- What does the HOA fee cover, when was the last increase, and are there any pending special assessments or reserve-fund shortfalls?
- Is there a deadline driving the sale (1031 exchange, divorce, estate, relocation)? That informs how much negotiation room exists.
- Schools are F-rated, which usually means shorter tenancies and higher turnover. Who's the typical renter profile here, and what's been the actual vacancy rate?
- Crime grade is F in this area — have there been break-ins, vandalism, or insurance claims at this property in the last 3 years? What carrier currently insures it and at what premium?
- The area grade is low — what's the realistic commute time and amenity access for the typical tenant pool here? Any planned neighborhood developments (good or bad) we should know about?
- What's the average days-on-market for RENTAL listings here right now (not sales)? A rising rental-DOM trend means longer vacancies and softer asking-rent achievability than the comps imply.
- What's the recent tenant-quality profile in this submarket — average credit score on applications, eviction rate, late-payment / NSF rate, and stable-employment percentage? A property-management company in the area should have these aggregated.
- How much new for-sale + rental construction is in the pipeline within 1–3 miles? Heavy new supply typically softens prices + rents 12–24 months out; constrained supply supports both.
Investment metrics
- 1% rule
- 0.83% ✗
- Cap rate
- 5.98%
- Cash-on-cash
- -1.13%
- DSCR
- 0.95
- GRM
- 10.1
CMA / ARV
- ARV (on-the-fly)
- $333,396
- Comps found
- 12
Show comp detail 12 sales within ~0.75 mi
| Address | Dist | Beds/Ba | Sqft | Sold | Price | $/sf | Match |
|---|---|---|---|---|---|---|---|
| 1828 NW 176th St | 0.03mi | 4/2.5 | 2,338 (+14%) | 1mo | $280,000 | $120 | 73 |
| 2213 NW 171st St | 0.33mi | 4/2.0 | 1,900 (-8%) | 1mo | $414,840 | $218 | 67 |
| 17729 Gold Dr | 0.20mi | 3/2.5 (-1) | 1,834 (-11%) | 0mo | $265,000 | $144 | 66 |
| 1300 NW 172nd St | 0.62mi | 3/2.0 (-1) | 2,041 (-1%) | 0mo | $369,530 | $181 | 61 |
| 17912 Marron Dr | 0.64mi | 3/2.0 (-1) | 2,079 (+1%) | 1mo | $380,000 | $183 | 59 |
| 1433 NW 182nd | 0.62mi | 4/2.0 | 2,181 (+6%) | 0mo | $298,000 | $137 | 57 |
| 16613 Farmington Way | 0.67mi | 3/2.0 (-1) | 2,005 (-3%) | 2mo | $325,000 | $162 | 54 |
| 17312 Parkgrove Dr | 0.50mi | 4/2.5 | 2,348 (+14%) | 0mo | $415,000 | $177 | 51 |
| 16909 Gladstone Cir | 0.53mi | 3/2.0 (-1) | 2,263 (+10%) | 1mo | $339,900 | $150 | 49 |
| 17820 Griffin Gate Dr | 0.42mi | 3/2.0 (-1) | 1,755 (-15%) | 2mo | $297,990 | $170 | 45 |
| 18321 English Oak Ln | 0.65mi | 5/3.0 (+1) | 2,320 (+13%) | 1mo | $375,000 | $162 | 42 |
| 1416 NW 182nd St | 0.63mi | 3/2.0 (-1) | 1,752 (-15%) | 1mo | $249,900 | $143 | 36 |
Match score weights: distance 35% · size 25% · config 20% · recency 20%. Top-matched comps best support the ARV.
Projected returns pro-forma
-3.0% appreciation · 1.21% rent growth · sell at horizon
- IRR
- -20.1%
- Equity multiple
- 0.31×
- Total profit
- $-51,255
- Equity at exit
- $39,512
- IRR
- -17.5%
- Equity multiple
- 0.12×
- Total profit
- $-65,645
- Equity at exit
- $22,912
Cash invested: $74,200 (down + closing). Projections, not guarantees.
Landlord ↔ Tenant lean methodology
- Overall (STATE)
- 83 Strongly Landlord-Friendly
- State Oklahoma
- 83 Strongly Landlord-Friendly · R+20
- County
- — inherits STATE
- City
- — inherits STATE
ZIP-level market 73012
- Home prices YoY
- -17.9%
- Rents YoY
- 1.2%
- Active inventory
- 626
- Price-to-rent
- 10.1×
Monthly cashflow live
- Estimated rent
- $2,189 high interval (Pro) →
- Mortgage (P&I)
- −$1,390
- Tax from tax record
- −$280 /mo · $3,361/yr
- Insurance
- −$110
- HOA
- −$19
- Vacancy / Maint / Mgmt
- −$460
- Net cashflow
- $-70
Break-even live
UW: 25.0% down · 7.5% · 30yr · 1.5% tax · 5.0% vac · 8.0% maint · 8.0% mgmt
Financing live
Cash to close
- Down payment
- $66,250
- Closing costs
- $7,950
- Reserves months
- —
- Total cash needed
- —
Loan-product check · same deal, 3 products live
Conventional
25% down · 7.5% · 30yr
- Down + closing
- —
- Monthly P&I
- —
- Monthly cashflow
- —
- DSCR
- —
- Eligible?
- —
Personal DTI + credit; lowest rate.
DSCR
20% down · 8.5% · 30yr
- Down + closing
- —
- Monthly P&I
- —
- Monthly cashflow
- —
- DSCR
- —
- Eligible?
- —
No personal income docs; deal must DSCR.
Hard money
10% down · 12.0% · 12mo
- Down + closing
- —
- Monthly P&I
- —
- Monthly cashflow
- —
- DSCR
- —
- Eligible?
- —
Short-term bridge; refi at stabilization.
Rent comps 40 comps
| Address | Beds | Baths | Sqft | Rent | $/sqft | DOM | Units | Dist |
|---|---|---|---|---|---|---|---|---|
| 17609 Gold Dr Edmond, OK | 4.0 | 2.0 | 1640 | $1,995 | $1.22 | 23d | 1 | 0.12mi |
| 17309 Platinum Ln Edmond, OK | 3.0 | 2.0 | 1840 | $1,895 | $1.03 | 14d | 1 | 0.23mi |
| 17405 Bronze Ln Edmond, OK | 4.0 | 2.0 | 1787 | $2,050 | $1.15 | 2d | 1 | 0.26mi |
| 1720 NW 172nd St Edmond, OK | 4.0 | 2.0 | 1868 | $1,975 | $1.06 | 23d | 1 | 0.32mi |
| 1528 NW 179th St Edmond, OK | 4.0 | 2.0 | 2067 | $2,221 | $1.07 | 14d | 1 | 0.40mi |
| 1517 NW 173rd Ter Edmond, OK | 3.0 | 2.5 | 2693 | $3,006 | $1.12 | 23d | 1 | 0.42mi |
| 17516 Black Hawk Dr Edmond, OK | 3.0 | 2.0 | 1846 | $2,095 | $1.13 | 2d | 1 | 0.50mi |
| 17904 Scarlet Oak Ln Edmond, OK | 3.0 | 2.0 | 1713 | $1,625 | $0.95 | 4d | 1 | 0.52mi |
| 18008 Jimenez Dr Edmond, OK | 4.0 | 2.5 | 2417 | $2,750 | $1.14 | 23d | 1 | 0.56mi |
| 17617 Wain Bridge Ave Edmond, OK | 4.0 | 2.0 | 1707 | $1,895 | $1.11 | 2d | 1 | 0.56mi |
| 17409 Wain Bridge Ave Edmond, OK | 3.0 | 2.0 | 2120 | $1,800 | $0.85 | 23d | 1 | 0.57mi |
| 1420 NW 183rd Ter Edmond, OK | 3.0 | 2.0 | 1767 | $1,950 | $1.10 | 21d | 1 | 0.62mi |
| 18509 Chestnut Oak Dr Edmond, OK | 3.0 | 2.0 | 1766 | $1,800 | $1.02 | 21d | 1 | 0.71mi |
| 16517 Tonka Trl Edmond, OK | 3.0 | 2.0 | 2301 | $2,495 | $1.08 | 23d | 1 | 0.72mi |
| 2433 NW 173rd St Edmond, OK | 3.0 | 2.5 | 2546 | $2,845 | $1.12 | 1d | 1 | 0.73mi |
| 16504 Village Garden Dr Edmond, OK | 3.0 | 2.5 | 2622 | $2,495 | $0.95 | 2d | 1 | 0.76mi |
| 1005 Valley Ct Edmond, OK | 3.0 | 2.0 | 1455 | $1,795 | $1.23 | 23d | 1 | 0.86mi |
| 1708 NW 163rd Cir Edmond, OK | 3.0 | 2.0 | 2128 | $1,950 | $0.92 | 14d | 1 | 0.90mi |
| 18704 Neri Dr Edmond, OK | 4.0 | 3.0 | 2579 | $3,195 | $1.24 | 2d | 1 | 0.92mi |
| 18301 Montoro Way Edmond, OK | 3.0 | 2.0 | 1556 | $1,695 | $1.09 | 2d | 1 | 0.99mi |
| 1037 NW 166th St Edmond, OK | 3.0 | 2.0 | 1630 | $1,595 | $0.98 | 23d | 1 | 1.03mi |
| 1037 NW 166th St Edmond, OK | 3.0 | 2.0 | 1600 | $1,595 | $1.00 | 4d | 1 | 1.03mi |
| 18509 Agua Dr Edmond, OK | 3.0 | 2.0 | 1595 | $1,800 | $1.13 | 1d | 1 | 1.06mi |
| 1018 NW 166th Ter Edmond, OK | 3.0 | 2.0 | 1835 | $1,650 | $0.90 | 23d | 1 | 1.06mi |
| 18600 Luna Dr Edmond, OK | 4.0 | 2.0 | 1989 | $2,395 | $1.20 | 1d | 1 | 1.07mi |
| 16224 Panther Way Edmond, OK | 3.0 | 2.0 | 1512 | $1,695 | $1.12 | 14d | 1 | 1.07mi |
| 18613 Vivo Dr Edmond, OK | 3.0 | 2.0 | 1682 | $1,995 | $1.19 | 19d | 1 | 1.07mi |
| 2609 NW 182nd St Edmond, OK | 3.0 | 2.0 | 1954 | $2,150 | $1.10 | 1d | 1 | 1.08mi |
| 17116 Sunny Hollow Rd Edmond, OK | 4.0 | 2.5 | 1690 | $2,100 | $1.24 | 2d | 1 | 1.09mi |
| 604A NW 175th St Unit 604A Edmond, OK | 4.0 | 2.5 | 1968 | $1,900 | $0.97 | 23d | 1 | 1.09mi |
| 605 NW 176th St Edmond, OK | 5.0 | 2.5 | 1900 | $1,800 | $0.95 | 14d | 1 | 1.11mi |
| 17029 Woodvine Dr Edmond, OK | 3.0 | 2.0 | 1838 | $1,970 | $1.07 | 17d | 1 | 1.13mi |
| 17629 Nantucket Ave Edmond, OK | 3.0 | 2.0 | 1632 | $1,925 | $1.18 | 2d | 1 | 1.13mi |
| 16001 Korie Dr Edmond, OK | 3.0 | 2.0 | 1778 | $1,995 | $1.12 | 23d | 1 | 1.16mi |
| 17225 Ridgewood Dr Edmond, OK | 4.0 | 2.5 | 2354 | $2,675 | $1.14 | 2d | 1 | 1.16mi |
| 18212 Viento Dr Edmond, OK | 3.0 | 2.0 | 1954 | $1,745 | $0.89 | 23d | 1 | 1.18mi |
| 17025 Canyonwood Ln Edmond, OK | 4.0 | 2.0 | 2075 | $1,799 | $0.87 | 2d | 1 | 1.18mi |
| 520 NW 176th Ter Edmond, OK | 3.0 | 2.5 | 2560 | $2,550 | $1.00 | 23d | 1 | 1.19mi |
| 525 NW 171st St Edmond, OK | 3.0 | 2.0 | 1607 | $1,900 | $1.18 | 2d | 1 | 1.19mi |
| 16401 Osceola Trl Edmond, OK | 3.0 | 2.0 | 1563 | $1,595 | $1.02 | 23d | 1 | 1.21mi |
HOA detail
- Monthly dues
- $19 · $228/yr
- Likely covers
- water
Listing history 5 events
-
2026-06-13statusdays on market $265,000 Pending 5 DOM
-
2026-06-09days on market $265,000 Active 4 DOM
-
2026-06-08days on market $265,000 Active 3 DOM
-
2026-06-07remarks 699-char remark
-
2026-06-07$265,000 Active 2 DOM
ⓘ Source: listings_history table (triggers on properties + properties_extension) + one-shot
backfill from property_details.listing_events for pre-trigger history.
Tax reassessment forecast OK · Resets to sale price
- Current annual tax
- $3,361 · $280/mo
- Projected year-2 tax
- $3,361 · $280/mo
- Expected delta
- $0/yr ($0/mo · -0.0%)
ⓘ Screening estimate from a state-policy table — verify with the county assessor before closing.
Climate risk First Street
- Flood 1/10 Low FEMA zone X (unshaded) · 0% chance over 30 yrs
- Wildfire 4/10 Moderate
- Heat 6/10 Major 7 d/yr ≥108°F today · 19 d/yr by 30 yrs out
- Wind 2/10 Low 2% chance of damaging wind over 30 yrs
- Air quality 2/10 Low 2 unhealthy d/yr today · 2 by 30 yrs out
Nearby sold comps map
Loading sold comps map…
Walkable amenities ~0.75 mi
Loading nearby amenities…
Taxation est. · year 1
- Rental income
- $26,268
- − Mortgage interest
- −$14,844
- − Property taxes
- −$3,361
- − Insurance
- −$1,325
- − Repairs & maintenance
- −$2,101
- − Management
- −$2,101
- − HOA
- −$228
- − Depreciation
- −$7,709
- Taxable loss
- −$5,403
- Est. tax savings @ 24.0%
- +$1,297
- After-tax cash flow
- $458/yr
For passive investors: Depreciation is non-cash, so a rental often shows a tax loss while cash-flowing — sheltering income. Rental losses are passive: they offset passive income freely, and up to $25,000/yr can offset ordinary (W-2) income if you actively participate and your MAGI is under $100k (phasing out to $0 by $150k); unused losses carry forward. On sale, claimed depreciation is recaptured at up to 25%, and gains may owe capital-gains tax (a 1031 exchange can defer both). Figures are a year-1 estimate at your 24.0% rate — not tax advice; consult a CPA.
Schools (NCES district)
- District
- Edmond
- NCES district ID
- 4010590
- Math proficiency
- 38% ▼ -12.00%
- Reading proficiency
- 40% ▼ -12.00%
- Median HH income
- $73,212
- Composite
- 35.88/100
- National rank
- #4814
- State rank
- #11 of 270 in OK
Livability — Oklahoma City
- Score
- 80/100
- State rank
- #3
- US rank
- #1635
Category grades
Schools grade is shown separately in the Schools card above.
Census & demographics
- Census place
- Oklahoma City, OK
- County
- Oklahoma County · 771,644 people
- City population
- 498,656
- Metro
- Oklahoma City, OK
- Population (ZIP)
- 46,993
- Household income
- $126,659
- Rent vs Own
- Severe rent burden
- 898.0
Population outlook (Oklahoma County) Hauer SSP2
- Today (2025)
- 911,875 people
- By 2030
- 982,413 · +7.7%
- By 2040
- 1,130,468 · +24.0%
- By 2050
- 1,288,422 · +41.3%
- By 2075
- 1,711,482 · +87.7%
- By 2100
- 2,088,448 · +129.0%
Race, ethnicity, and origin ACS 2023
- Neighborhood character
- Predominantly White (67%)
- Race & ethnicity
- White 67% Two or more races 10% Black 8% Asian 8% Hispanic / Latino 8% Native American 2%
- Hispanic origin (detail)
- Mexican 5%
- Common ancestry
- Italian 3% Slovak 2% Romanian 2%
- Foreign-born
- 11% · Canada, China, Vietnam
- Languages at home
- 86% English-only · Spanish 4% Other Indo-European 2% Chinese 2%
Political lean MEDSL · Oklahoma
- 2024 margin
- Toss-up / Even · D 48.0% · R 49.7% · Other 2.3%
- 2008→2024 swing
- +15.1pp toward D · 2008: -16.8pp · 2024: -1.7pp
- All cycles
- 2024: R+1.7 2020: R+1.1 2016: R+10.5 2012: R+16.7 2008: R+16.8
Not yet ingested
- Civics
- —
Market trends
- HPI YoY
- ▼ -44.41%
- Current HPI
- 203.1105
- Rent YoY
- ▲ 1.21%
- Metro
- Oklahoma City, OK
- State GDP YoY
- ▲ 1.55%
- F500 in state
- 6
Industry mix (Fortune 500 HQ in OK)
| Industry | F500 HQs | Revenue |
|---|---|---|
| Energy | 3 | $48B |
|
||
Price history
+77.0% since first listed14 events — show timeline
- 2026-06-05 Listed $265,000 MLSOK
- 2015-08-12 Sold (Public Records) $179,000 Public Records
- 2015-07-31 Sold (MLS) $179,000 MLSOK
- 2015-06-30 Pending — MLSOK
- 2015-06-24 Listed $179,900 MLSOK
- 2006-12-21 Sold (Public Records) $165,000 Public Records
- 2006-12-21 Sold (Public Records) $170,500 Public Records
- 2006-12-15 Sold (MLS) $165,000 MLSOK
- 2006-09-25 Listed $169,900 MLSOK
- 2004-02-18 Sold (Public Records) $155,000 Public Records
- 2004-02-13 Sold (MLS) $155,000 MLSOK
- 2003-09-30 Listed $156,900 MLSOK
- 2002-07-26 Sold (MLS) $149,700 MLSOK
- 2001-12-18 Listed $149,700 MLSOK
Property tax history
+5.0%/yrLatest (2025): $3,361 · +5.3% YoY. Source: county tax records.
Cash-flow waterfall
monthlySold comps — $/sqft
last 12 mo · ≤1 miLoading sold comps…