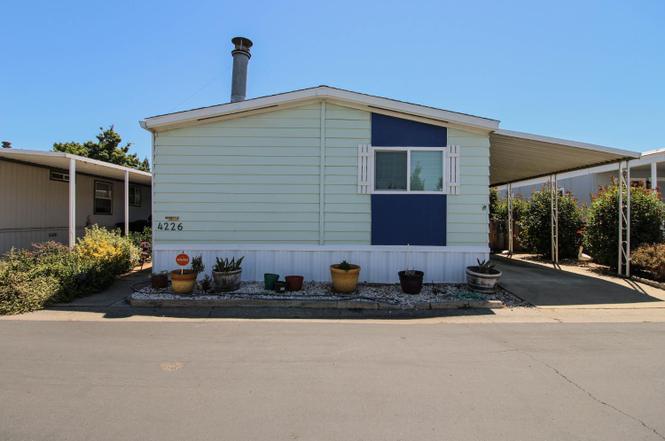
4226 Floral · Sacramento, CA
Flood risk 4/10 · Minor
- FEMA flood zone
- A99
- Chance of flooding over 30 yrs
- 0.2%
- Est. flood insurance / yr
- $1,009 – $1,996
Fire risk 5/10 · Moderate
- Est. fire insurance / yr
- $659 – $1,223
Heat risk 7/10 · Major
- Hot days now (above 103°F)
- 7 days/yr
- Hot days in 30 yrs
- 14 days/yr
Wind risk 1/10 · Minimal
- Chance of severe wind over 30 yrs
- —
Air-quality risk 10/10 · Severe
- Unhealthy air days now
- 27 days/yr
- Unhealthy air days in 30 yrs
- 33 days/yr
Risk factors via First Street. Map © Google.
Why this score? — see what drove the B+ grade
The composite is a weighted blend of 9 inputs, each scored 0–100. Each bar is that input's sub-score; the figure is the points it added to the 100-point composite (weight × sub-score).
- Cash flow +30.0/30.0
- ARV discount +15.0/15.0
- 1% rule +10.0/10.0
- DSCR +10.0/10.0
- Schools +4.1/10.0
- Livability +3.6/5.0
- Rent growth +2.7/5.0
- Condition / age +2.5/5.0
- Appreciation +0.0/10.0
$89,000
🖨 Deal sheet 📄 Offer letter ✓ Due diligence
Listing remarks
Welcome to Stadium Club Estates, one of Sacramento's most desirable 55+ manufactured home communities. This well-maintained 2-bedroom, 2-bath home offers approximately 1,536 square feet of comfortable living space and has been thoughtfully updated throughout. The spacious floor plan features newer laminate flooring, updated ceiling lighting, higher ceilings in portions of the home, a dining area, and a cozy fireplace that creates a warm and inviting atmosphere. The kitchen has been refreshed with newer cabinets and appliances, while both bathrooms have been updated with newer cabinetry. The spacious primary suite offers a large bedroom and an oversized bathroom designed for comfort and conv
Key facts
- Newer cabinets
- Cozy fireplace
- Updated cabinetry
Tags
Property features AI
Finance
- Other: Not a land lease (land lease: No); Located in Stadium Club Estates
- HOA & community: No homeowners association; Located in a senior community
Exterior
- Parking: Covered parking
- Security: Leased security system; Fire alarm; Carbon monoxide detector
- Utilities: Public sewer; Electric service (other)
- Home design: Manufactured in park (double wide); Original and updated/remodeled condition
- Construction: Shingle roof; Aluminum skirting; Manufacturer: Hlark
- Exterior features: Fenced yard; Backyard
Interior
- Kitchen: No built-in kitchen features listed
- Bedrooms: 2 bedrooms
- Flooring: Laminate
- Bathrooms: 2 full bathrooms
- Heating & cooling: Central heating; Central air conditioning
- Interior features: Laminate flooring; Fire alarm; Leased security system; Carbon monoxide detector; Shower stall(s)
- Laundry & utility: Washer included; Dryer included
Neighborhood map
What this means for you Summary
Snapshot
- This is a 2-bed/2.0-bath manufactured listed at $89k.
Deal economics
- At list price, monthly cash flow is $1k ($16k/yr) — positive.
- The deal already cash-flows at list — no discount required.
- Meets the 1% rule at list price ($3k rent vs $89k).
- Cap rate 26.0% vs local median 3.0% in Sacramento — top-decile yield for the area; either an underpriced asset or a hidden risk that comps aren't pricing in. Stress-test before assuming the spread holds.
Location & tenants
- Location reads 71/100 on livability (#218 in CA) — a middle-class / working-renter tenant base. Strengths: amenities A+, commute A+, housing A; Watch: schools D+, crime F, cost of living F.
- Natomas Unified (urban): math 33% / reading 60% proficiency, ranked #155 of 517 in CA (top 30%) — families likely to look elsewhere, expect single-tenant / working-renter base with shorter leases.
- Market conditions: Rents flat; 145 active listings in the ZIP; 38 comparable units currently listed for rent nearby; rentals at typical pace (median 15d on market — plan ~3-4 weeks tenant-placement turnaround); solid renter incomes; 6,825 units permitted in Sacramento County in 2024 (1,752 in 5+ unit buildings).
- This rent runs 31% of the median local income ($101k/yr) — at the standard rent-burdened threshold; future hikes will face affordability resistance.
Forward outlook
- Local home prices are declining (-3.0%/yr); year-one equity from $615 of loan paydown is wiped out by about $3k of value loss. Plan a longer hold.
- Sacramento County population projected at +17% by 2050 — long-run rental-demand tailwind backs the buy-and-hold thesis.
- At projected returns (-3.0% appreciation + 0.8% rent growth), your $25k cash investment doubles in ~2 years — after that, you're playing with house money.
Negotiation context
- Only 3 days on market — expect competitive offers; lowballing is unlikely to land.
Risks & watch-outs
- Watch-outs: flood insurance adds $125/mo.
- Climate carrying-cost: in FEMA flood zone A99 (mandatory federal flood insurance); moderate wildfire risk; extreme-heat days projected 7→14/yr by 2055 (HVAC capex compounding) — expect insurance premiums to compound above CPI over the hold.
Questions for the listing agent
- What's the actual annual flood-insurance premium (NFIP or private), and is the property in a SFHA with mandatory coverage?
- Is there a deadline driving the sale (1031 exchange, divorce, estate, relocation)? That informs how much negotiation room exists.
- Schools are D-rated, which usually means shorter tenancies and higher turnover. Who's the typical renter profile here, and what's been the actual vacancy rate?
- Crime grade is F in this area — have there been break-ins, vandalism, or insurance claims at this property in the last 3 years? What carrier currently insures it and at what premium?
- What's the average days-on-market for RENTAL listings here right now (not sales)? A rising rental-DOM trend means longer vacancies and softer asking-rent achievability than the comps imply.
- What's the recent tenant-quality profile in this submarket — average credit score on applications, eviction rate, late-payment / NSF rate, and stable-employment percentage? A property-management company in the area should have these aggregated.
- How much new for-sale + rental construction is in the pipeline within 1–3 miles? Heavy new supply typically softens prices + rents 12–24 months out; constrained supply supports both.
Investment metrics
- 1% rule
- 2.95% ✓
- Cap rate
- 25.96%
- Cash-on-cash
- 70.24%
- DSCR
- 4.13
- GRM
- 2.8
CMA / ARV
- ARV (on-the-fly)
- $136,704
- Comps found
- 10
Show comp detail 10 sales within ~0.75 mi
| Address | Dist | Beds/Ba | Sqft | Sold | Price | $/sf | Match |
|---|---|---|---|---|---|---|---|
| 4922 N Brookdale Dr #128 | 0.12mi | 2/2.0 | 1,536 (0%) | 5mo | $74,900 | $49 | 90 |
| 4208 Bouquet Way #38 | 0.11mi | 1/2.0 (-1) | 1,560 (+2%) | 11mo | $152,000 | $97 | 78 |
| 4901 Gardendell Rd #84 | 0.03mi | 2/2.0 | 1,344 (-12%) | 5mo | $119,000 | $89 | 74 |
| 4916 Brookdale Dr #130 | 0.10mi | 2/2.0 | 1,344 (-12%) | 2mo | $40,000 | $30 | 73 |
| 4203 Bouquet Way | 0.13mi | 2/2.0 | 1,440 (-6%) | 14mo | $120,000 | $83 | 72 |
| 4872 Brookdale #163 | 0.02mi | 2/2.0 | 1,400 (-9%) | 16mo | $110,000 | $79 | 71 |
| 4907 Gardendell Rd #87 | 0.12mi | 3/2.0 (+1) | 1,440 (-6%) | 12mo | $145,000 | $101 | 69 |
| 4213 Floral Dr #60 | 0.06mi | 3/2.0 (+1) | 1,680 (+9%) | 20mo | $164,000 | $98 | 60 |
| 4215 Atrium Way #102 | 0.08mi | 2/2.0 | 1,344 (-12%) | 22mo | $120,000 | $89 | 57 |
| 4211 Brookside Dr #153 | 0.15mi | 2/2.0 | 1,344 (-12%) | 23mo | $105,400 | $78 | 53 |
Match score weights: distance 35% · size 25% · config 20% · recency 20%. Top-matched comps best support the ARV.
Projected returns pro-forma
-3.0% appreciation · 0.82% rent growth · sell at horizon
- IRR
- 60.7%
- Equity multiple
- 3.61×
- Total profit
- $64,989
- Equity at exit
- $13,270
- IRR
- 64.6%
- Equity multiple
- 6.79×
- Total profit
- $144,290
- Equity at exit
- $7,695
Cash invested: $24,920 (down + closing). Projections, not guarantees.
Landlord ↔ Tenant lean methodology
- Overall (STATE)
- 18 Strongly Tenant-Friendly
- State California
- 18 Strongly Tenant-Friendly · D+13
- County
- — inherits STATE
- City
- — inherits STATE
ZIP-level market 95834
- Home prices YoY
- -13.2%
- Rents YoY
- 0.8%
- Active inventory
- 145
- Price-to-rent
- 2.8×
Monthly cashflow live
- Estimated rent
- $2,625 high interval (Pro) →
- Mortgage (P&I)
- −$467
- Tax est. 1.5%
- −$111 /mo · $1,335/yr
- Insurance
- −$37
- Flood insurance flood zone
- −$125 /mo · $1,502/yr
- HOA
- −$0
- Vacancy / Maint / Mgmt
- −$551
- Net cashflow
- $1,333
Break-even live
UW: 25.0% down · 7.5% · 30yr · 1.5% tax · 5.0% vac · 8.0% maint · 8.0% mgmt
Financing live
Cash to close
- Down payment
- $22,250
- Closing costs
- $2,670
- Reserves months
- —
- Total cash needed
- —
Loan-product check · same deal, 3 products live
Conventional
25% down · 7.5% · 30yr
- Down + closing
- —
- Monthly P&I
- —
- Monthly cashflow
- —
- DSCR
- —
- Eligible?
- —
Personal DTI + credit; lowest rate.
DSCR
20% down · 8.5% · 30yr
- Down + closing
- —
- Monthly P&I
- —
- Monthly cashflow
- —
- DSCR
- —
- Eligible?
- —
No personal income docs; deal must DSCR.
Hard money
10% down · 12.0% · 12mo
- Down + closing
- —
- Monthly P&I
- —
- Monthly cashflow
- —
- DSCR
- —
- Eligible?
- —
Short-term bridge; refi at stabilization.
Rent comps 38 comps
| Address | Beds | Baths | Sqft | Rent | $/sqft | DOM | Units | Dist |
|---|---|---|---|---|---|---|---|---|
| 3301 Arena Blvd Sacramento, CA | 1.0–3.0 | 1.0–2.5 | 952 | $2,300 | $2.42 | 2d | 1 | 0.17mi |
| 4138 Hydo Lake Way Sacramento, CA | 3.0 | 2.5 | 1954 | $3,000 | $1.54 | 18d | 1 | 0.21mi |
| 101 Lily Bay Cir Sacramento, CA | 3.0 | 2.5 | 1950 | $2,900 | $1.49 | 20d | 1 | 0.23mi |
| 4032 Vittoria Ln Sacramento, CA | 3.0 | 2.5 | 1601 | $2,795 | $1.75 | 23d | 1 | 0.27mi |
| 4118 Adriatic Sea Way Sacramento, CA | 3.0 | 2.5 | 1593 | $2,995 | $1.88 | 18d | 1 | 0.34mi |
| 4045 Neapolis Ln Sacramento, CA | 3.0 | 2.5 | 1811 | $2,800 | $1.55 | 3d | 1 | 0.34mi |
| 4237 Malta Island St Sacramento, CA | 3.0 | 2.5 | 1954 | $2,895 | $1.48 | 44d | 1 | 0.36mi |
| 17 Hertford Cir Sacramento, CA | 3.0 | 2.5 | 1511 | $2,450 | $1.62 | 23d | 1 | 0.50mi |
| 17 Advantage Ct Sacramento, CA | 3.0 | 2.5 | 1394 | $2,595 | $1.86 | 44d | 1 | 0.68mi |
| 4470 Saone Walk Sacramento, CA | 3.0–4.0 | 2.5–3.5 | 1846 | $2,595 | $1.41 | 2d | 1 | 0.72mi |
| 4190 E Commerce Way Sacramento, CA | 1.0–3.0 | 1.0–2.0 | 940 | $2,675 | $2.85 | 2d | 20 | 0.83mi |
| 3635 Poppy Hill Way Sacramento, CA | 3.0 | 2.0 | 1441 | $2,895 | $2.01 | 23d | 1 | 0.84mi |
| 4800 Westlake Pkwy Sacramento, CA | 1.0–2.0 | 1.5–2.5 | 1214 | $2,250 | $1.85 | 2d | 3 | 0.90mi |
| 3610 Duckhorn Dr Sacramento, CA | 1.0–3.0 | 1.0–2.0 | 927 | $2,635 | $2.84 | 2d | 29 | 0.91mi |
| 4800 Westlake Pkwy #3008 Sacramento, CA | 2.0 | 2.0 | 1304 | $2,250 | $1.73 | 44d | 1 | 0.93mi |
| 301 Candela Cir Sacramento, CA | 3.0 | 2.5 | 1541 | $2,750 | $1.78 | 15d | 1 | 0.97mi |
| 3791 E Commerce Way Sacramento, CA | 2.0 | 1.0–2.0 | 865 | $2,970 | $3.43 | 2d | 21 | 1.00mi |
| 3900 E Commerce Way Sacramento, CA | 3.0 | 2.0 | 1311 | $2,600 | $1.98 | 44d | 1 | 1.01mi |
| 3547 Jumilla Way Sacramento, CA | 3.0 | 2.0 | 1323 | $2,650 | $2.00 | 12d | 1 | 1.02mi |
| 620 Candela Cir Sacramento, CA | 3.0 | 2.5 | 1681 | $2,595 | $1.54 | 44d | 1 | 1.03mi |
| 3761 E Commerce Way Sacramento, CA | 2.0 | 1.0–2.0 | 865 | $3,231 | $3.74 | 2d | 29 | 1.04mi |
| 5050 Trouville Ln Sacramento, CA | 3.0 | 2.5 | 1583 | $2,950 | $1.86 | 44d | 1 | 1.15mi |
| 3828 Aircraft Way Sacramento, CA | 3.0 | 2.5 | 1826 | $2,395 | $1.31 | 23d | 1 | 1.15mi |
| 2201 Arena Blvd Sacramento, CA | 1.0–2.0 | 1.0–2.0 | 1015 | $2,777 | $2.74 | 2d | 14 | 1.18mi |
| 570 Wapello Cir Sacramento, CA | 3.0 | 2.5 | 1697 | $3,000 | $1.77 | 44d | 1 | 1.19mi |
| 4800 Kokomo Dr Sacramento, CA | 1.0–3.0 | 1.0–3.5 | 1229 | $2,906 | $2.36 | 2d | 26 | 1.25mi |
| 260 Wapello Cir Sacramento, CA | 3.0 | 3.0 | 1697 | $2,650 | $1.56 | 7d | 1 | 1.30mi |
| 4101 Innovator Dr Sacramento, CA | 1.0–2.0 | 1.0–2.0 | 950 | $2,695 | $2.84 | 2d | 10 | 1.30mi |
| 3351 Duckhorn Dr Sacramento, CA | 1.0 | 1.0 | 981 | $2,030 | $2.07 | 2d | 8 | 1.35mi |
| 2442 Buzz Aldrin Way Sacramento, CA | 3.0 | 2.5 | 1826 | $2,795 | $1.53 | 15d | 1 | 1.37mi |
| 2490 Quiet Trail Ln Sacramento, CA | 1.0–3.0 | 1.0–2.0 | 1113 | $2,899 | $2.60 | 2d | 14 | 1.37mi |
| 2445 Buzz Aldrin Way Sacramento, CA | 3.0 | 3.0 | 1826 | $2,995 | $1.64 | 22d | 1 | 1.38mi |
| 2445 Buzz Aldrin Way Sacramento, CA | 3.0 | 2.5 | 1826 | $2,995 | $1.64 | 23d | 1 | 1.38mi |
| 2445 Buzz Aldrin Way Sacramento, CA | 3.0 | 2.5 | 1826 | $2,895 | $1.59 | 4d | 1 | 1.38mi |
| 3301 N Park Dr Sacramento, CA | 3.0 | 2.5 | 1678 | $2,672 | $1.59 | 44d | 2 | 1.38mi |
| 4100 Innovator Dr Sacramento, CA | 2.0 | 1.0–2.0 | 860 | $2,990 | $3.47 | 2d | 18 | 1.39mi |
| 4000 Innovator Dr Sacramento, CA | 2.0–4.0 | 2.0–3.0 | 1403 | $2,295 | $1.64 | 15d | 1 | 1.45mi |
| 3065 Touchman St Sacramento, CA | 3.0 | 2.5 | 1473 | $2,395 | $1.63 | 20d | 1 | 1.50mi |
Listing history 4 events
-
2026-06-18days on market $89,000 Active 3 DOM
-
2026-06-17days on market $89,000 Active 2 DOM
-
2026-06-15remarks 699-char remark
-
2026-06-15$89,000 Active 1 DOM
ⓘ Source: listings_history table (triggers on properties + properties_extension) + one-shot
backfill from property_details.listing_events for pre-trigger history.
Climate risk First Street
- Flood 4/10 Moderate FEMA zone A99 · 20% chance over 30 yrs
- Wildfire 5/10 Major
- Heat 7/10 Severe 7 d/yr ≥103°F today · 14 d/yr by 30 yrs out
- Wind 1/10 Low
- Air quality 10/10 Extreme 27 unhealthy d/yr today · 33 by 30 yrs out
Nearby sold comps map
Loading sold comps map…
Walkable amenities ~0.75 mi
Loading nearby amenities…
Taxation est. · year 1
- Rental income
- $31,500
- − Mortgage interest
- −$4,985
- − Property taxes
- −$1,335
- − Insurance
- −$1,948
- − Repairs & maintenance
- −$2,520
- − Management
- −$2,520
- − Depreciation
- −$2,589
- Taxable income
- $15,603
- Est. tax owed @ 24.0%
- −$3,745
- After-tax cash flow
- $12,257/yr
For passive investors: Depreciation is non-cash, so a rental often shows a tax loss while cash-flowing — sheltering income. Rental losses are passive: they offset passive income freely, and up to $25,000/yr can offset ordinary (W-2) income if you actively participate and your MAGI is under $100k (phasing out to $0 by $150k); unused losses carry forward. On sale, claimed depreciation is recaptured at up to 25%, and gains may owe capital-gains tax (a 1031 exchange can defer both). Figures are a year-1 estimate at your 24.0% rate — not tax advice; consult a CPA.
Schools (NCES district)
- District
- Natomas Unified
- NCES district ID
- 0600036
- Math proficiency
- 33% ▼ -1.00%
- Reading proficiency
- 60% ▲ 13.00%
- Median HH income
- $67,969
- Composite
- 41.49/100
- National rank
- #3457
- State rank
- #155 of 517 in CA
Livability — Sacramento
- Score
- 71/100
- State rank
- #218
- US rank
- #6957
Category grades
Schools grade is shown separately in the Schools card above.
Census & demographics
- Census place
- Sacramento, CA
- County
- Sacramento County · 1,539,646 people
- City population
- 761,410
- Metro
- Sacramento-Roseville-Folsom, CA
- Population (ZIP)
- 36,245
- Household income
- $101,260
- Rent vs Own
- Severe rent burden
- 1444.0
Population outlook (Sacramento County) Hauer SSP2
- Today (2025)
- 1,660,763 people
- By 2030
- 1,732,990 · +4.3%
- By 2040
- 1,855,755 · +11.7%
- By 2050
- 1,941,335 · +16.9%
- By 2075
- 2,046,162 · +23.2%
- By 2100
- 1,961,444 · +18.1%
Race, ethnicity, and origin ACS 2023
- Neighborhood character
- Highly diverse neighborhood (Simpson 0.78)
- Race & ethnicity
- Asian 29% Hispanic / Latino 28% White 19% Two or more races 16% Black 15% Pacific Islander 1%
- Hispanic origin (detail)
- Mexican 21%
- Common ancestry
- Lithuanian 2% Subsaharan African 1% Russian 1%
- Foreign-born
- 30% · Canada, China, Vietnam
- Languages at home
- 58% English-only · Spanish 15% Other Indo-European 14% Other Asian/Pacific 3%
Political lean MEDSL · Sacramento
- 2024 margin
- D (+19.7) · D 58.1% · R 38.4% · Other 3.5%
- 2008→2024 swing
- +0.7pp no change · 2008: 19.0pp · 2024: 19.7pp
- All cycles
- 2024: D+19.7 2020: D+25.3 2016: D+23.7 2012: D+16.3 2008: D+19.0
Not yet ingested
- Civics
- —
Market trends
- HPI YoY
- ▼ -45.12%
- Current HPI
- 295.8305
- Rent YoY
- ▲ 0.82%
- Metro
- Sacramento-Roseville-Folsom, CA
- State GDP YoY
- ▲ 3.21%
- F500 in state
- 116
Industry mix (Fortune 500 HQ in CA)
| Industry | F500 HQs | Revenue |
|---|---|---|
| Technology | 27 | $1,492B |
|
||
| Financial Services | 3 | $174B |
|
||
| Retail | 3 | $44B |
|
||
| Insurance | 3 | $26B |
|
||
| Media / Entertainment | 2 | $115B |
|
||
| Pharmaceuticals / Biotech | 2 | $62B |
|
||
Price history
1 event — show timeline
- 2026-06-15 Listed $89,000 BAREIS
Cash-flow waterfall
monthlySold comps — $/sqft
last 12 mo · ≤1 miLoading sold comps…