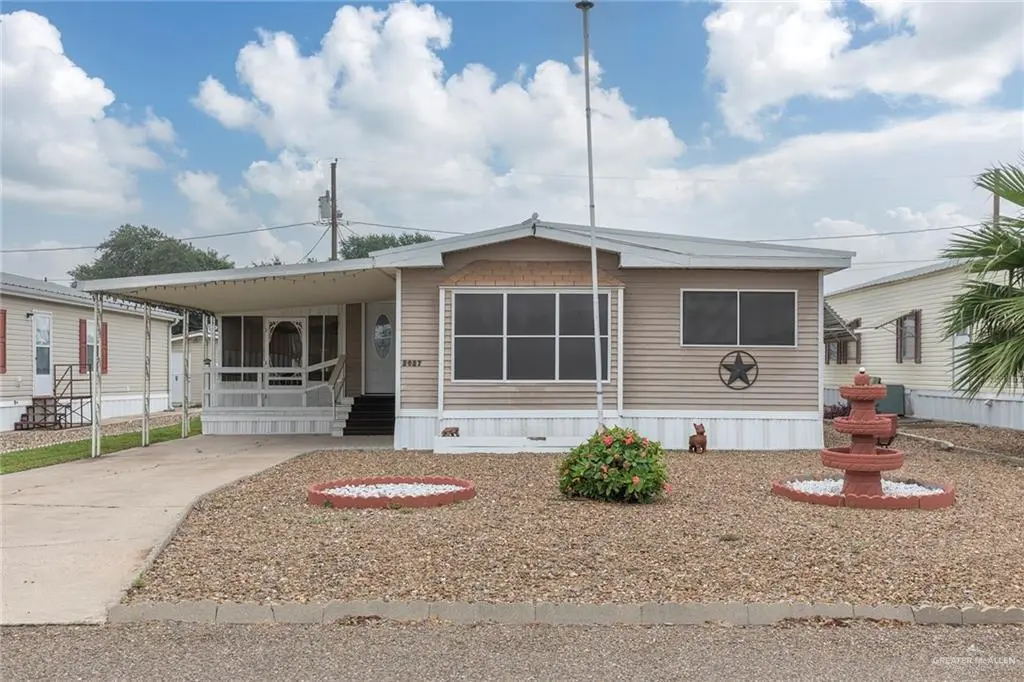
2027 N Kelly St N · Mission, TX
Flood risk 1/10 · Minimal
- FEMA flood zone
- X (shaded)
- Chance of flooding over 30 yrs
- 0.0%
- Est. flood insurance / yr
- $507 – $1,088
Fire risk 3/10 · Minor
- Est. fire insurance / yr
- $1,222 – $2,270
Heat risk 9/10 · Severe
- Hot days now (above 111°F)
- 7 days/yr
- Hot days in 30 yrs
- 22 days/yr
Wind risk 8/10 · Major
- Chance of severe wind over 30 yrs
- 96.0%
Air-quality risk 2/10 · Minimal
- Unhealthy air days now
- 1 days/yr
- Unhealthy air days in 30 yrs
- 2 days/yr
Risk factors via First Street. Map © Google.
Why this score? — see what drove the D+ grade
The composite is a weighted blend of 9 inputs, each scored 0–100. Each bar is that input's sub-score; the figure is the points it added to the 100-point composite (weight × sub-score).
- ARV discount +15.0/15.0
- Cash flow +13.7/30.0
- DSCR +4.1/10.0
- Livability +3.8/5.0
- 1% rule +3.5/10.0
- Schools +3.4/10.0
- Rent growth +2.7/5.0
- Condition / age +2.5/5.0
- Appreciation +0.0/10.0
$132,500
🖨 Deal sheet 📄 Offer letter ✓ Due diligence
Listing remarks
Welcome to easy living in this beautifully maintained 3 bedroom, 2 bath home located in a desirable 55+ community! This spacious mobile home features tile flooring throughout, 2 living areas and a dedicated dining space perfect for entertaining or everyday comfort. Lots of natural light and an open concept with move in ready vibe and so very clean! Enjoy your morning coffee or evening relaxation in the enclosed patio, while the low-maintenance rock yard makes upkeep a breeze. The property also includes a detached one-car garage with convenient alley access for added functionality and storage. Lots of room on the patio as well as the double living areas with easy access to front, side and ba
Key facts
- Alley access
- Storage options
- Double living areas
Tags
Property features AI
Finance
- Other: Golf cart available
- HOA & community: Community association: Valley View Estates; Association fee $350 annually; POA mandatory with $50 transfer fee; POA contact email available; Community features include sidewalks; Senior community
Exterior
- Parking: Total of 3.5 parking spaces; 1.5 garage spaces; 2 carport spaces; Detached garage that faces the rear; Has carport; Has garage
- Security: Smoke detector(s)
- Utilities: Public water; City sewer; Cable available; Electric service
- Home design: Not new construction; Living area reported by HidalgoCAD
- Construction: Siding exterior; Metal roof; Slab foundation; Built area reported as 1,378
- Exterior features: Mature trees; Rock yard; Covered patio; Deck / balcony / porch; Patio slab; Alley access; Sidewalks; Paved road
Interior
- Kitchen: Gas cooktop; Dishwasher; Electric water heater
- Flooring: Vinyl flooring
- Bathrooms: 2 full bathrooms
- Heating & cooling: Central heating (electric); Central air conditioning (electric)
- Interior features: Solid-surface countertops; Ceiling fans; Walk-in closet(s); Mini blinds; Smoke detector(s)
- Laundry & utility: Laundry area; Washer and dryer present
Neighborhood map
What this means for you Summary
Snapshot
- This is a 2-bed/2.0-bath manufactured listed at $132k.
Deal economics
- At list price, monthly cash flow is $9 ($108/yr) — positive.
- The deal already cash-flows at list — no discount required.
- To meet the 1% rule (rent ≥ 1% of price), the offer needs to be $112k (15.3% below list).
- Recommended offer: $112k (15.3% below list) — sets the bar for 1% rule.
- Cap rate 6.4% vs local median 3.5% in Mission — top-decile yield for the area; either an underpriced asset or a hidden risk that comps aren't pricing in. Stress-test before assuming the spread holds.
Location & tenants
- Location reads 75/100 on livability (#148 in TX, #4,155 nationally) — a middle-class / working-renter tenant base. Strengths: cost of living A+, housing A+, health & safety A+; Watch: amenities F, commute F, employment D-.
- Sharyland ISD (urban): math 34% / reading 44% proficiency, ranked #406 of 826 in TX (top 49%) — families likely to look elsewhere, expect single-tenant / working-renter base with shorter leases.
- Zoned schools: Lloyd & Dolly Bentsen El (math 25% / reading 33%, grade F, #2,668 of 4,322 statewide, top 63%, 559 students, 83% FRL); B L Gray J H (math 50% / reading 55%, grade C+, #293 of 1,662 statewide, top 18%, 730 students, 67% FRL); Sharyland H S (math 36% / reading 58%, grade D-, #591 of 1,632 statewide, top 38%, 1,546 students, 57% FRL).
- Market conditions: Rents flat; 852 active listings in the ZIP; 36 comparable units currently listed for rent nearby; rentals lingering (median 44d on market — plan ~5-8 weeks vacancy on turnover, expect pricing pressure); 69% of comp listings sitting > 30 days — soft ceiling on asking rent; 7,378 units permitted in Hidalgo County in 2024 (641 in 5+ unit buildings).
Forward outlook
- Local home prices are declining (-3.0%/yr); year-one equity from $916 of loan paydown is wiped out by about $4k of value loss. Plan a longer hold.
- Hidalgo County population projected at +28% by 2050 — long-run rental-demand tailwind backs the buy-and-hold thesis.
Negotiation context
- It's been on market 38 days — a 3% lower offer ($129k) is reasonable based on typical stale-listing flexibility.
Risks & watch-outs
- Climate carrying-cost: severe wind risk, 96% chance of damaging wind over 30y; extreme-heat days projected 7→22/yr by 2055 (HVAC capex compounding) — expect insurance premiums to compound above CPI over the hold.
Questions for the listing agent
- It's been on market 38 days. Have you received any prior offers? Is the seller open to a 15% concession, seller financing, or rate buy-down credit?
- What does the HOA fee cover, when was the last increase, and are there any pending special assessments or reserve-fund shortfalls?
- Is there a deadline driving the sale (1031 exchange, divorce, estate, relocation)? That informs how much negotiation room exists.
- The area grade is low — what's the realistic commute time and amenity access for the typical tenant pool here? Any planned neighborhood developments (good or bad) we should know about?
- What's the average days-on-market for RENTAL listings here right now (not sales)? A rising rental-DOM trend means longer vacancies and softer asking-rent achievability than the comps imply.
- What's the recent tenant-quality profile in this submarket — average credit score on applications, eviction rate, late-payment / NSF rate, and stable-employment percentage? A property-management company in the area should have these aggregated.
- How much new for-sale + rental construction is in the pipeline within 1–3 miles? Heavy new supply typically softens prices + rents 12–24 months out; constrained supply supports both.
Investment metrics
- 1% rule
- 0.85% ✗
- Cap rate
- 6.37%
- Cash-on-cash
- 0.29%
- DSCR
- 1.01
- GRM
- 9.8
CMA / ARV
- ARV (median comp)
- $187,717
- List price
- $132,500
- Delta
- -29.42%
- Verdict
- UNDERPRICED
- Comps
- 20 within 1.0 mi
Show comp detail 2 sales within ~0.75 mi
| Address | Dist | Beds/Ba | Sqft | Sold | Price | $/sf | Match |
|---|---|---|---|---|---|---|---|
| 2029 Loker St | 0.06mi | 2/2.0 | 980 (+4%) | 13mo | $70,000 | $71 | 79 |
| 2026 Loker Ave | 0.03mi | 2/2.0 | 980 (+4%) | 20mo | $80,000 | $82 | 75 |
Match score weights: distance 35% · size 25% · config 20% · recency 20%. Top-matched comps best support the ARV.
Projected returns pro-forma
-3.0% appreciation · 0.93% rent growth · sell at horizon
- IRR
- -18.1%
- Equity multiple
- 0.37×
- Total profit
- $-23,195
- Equity at exit
- $19,756
- IRR
- -14.8%
- Equity multiple
- 0.23×
- Total profit
- $-28,504
- Equity at exit
- $11,456
Cash invested: $37,100 (down + closing). Projections, not guarantees.
Landlord ↔ Tenant lean methodology
- Overall (STATE)
- 87 Strongly Landlord-Friendly
- State Texas
- 87 Strongly Landlord-Friendly · R+5
- County
- — inherits STATE
- City
- — inherits STATE
ZIP-level market 78572
- Home prices YoY
- -22.9%
- Rents YoY
- 0.9%
- Active inventory
- 852
- Price-to-rent
- 9.8×
Monthly cashflow live
- Estimated rent
- $1,123 high interval (Pro) →
- Mortgage (P&I)
- −$695
- Tax from tax record
- −$99 /mo · $1,187/yr
- Insurance
- −$55
- HOA
- −$29
- Vacancy / Maint / Mgmt
- −$236
- Net cashflow
- $9
Break-even live
UW: 25.0% down · 7.5% · 30yr · 1.5% tax · 5.0% vac · 8.0% maint · 8.0% mgmt
Financing live
Cash to close
- Down payment
- $33,125
- Closing costs
- $3,975
- Reserves months
- —
- Total cash needed
- —
Loan-product check · same deal, 3 products live
Conventional
25% down · 7.5% · 30yr
- Down + closing
- —
- Monthly P&I
- —
- Monthly cashflow
- —
- DSCR
- —
- Eligible?
- —
Personal DTI + credit; lowest rate.
DSCR
20% down · 8.5% · 30yr
- Down + closing
- —
- Monthly P&I
- —
- Monthly cashflow
- —
- DSCR
- —
- Eligible?
- —
No personal income docs; deal must DSCR.
Hard money
10% down · 12.0% · 12mo
- Down + closing
- —
- Monthly P&I
- —
- Monthly cashflow
- —
- DSCR
- —
- Eligible?
- —
Short-term bridge; refi at stabilization.
Rent comps 36 comps
| Address | Beds | Baths | Sqft | Rent | $/sqft | DOM | Units | Dist |
|---|---|---|---|---|---|---|---|---|
| 2113 Amy St Mission, TX | 2.0 | 2.0 | 784 | $875 | $1.12 | 23d | 1 | 0.08mi |
| 716 Ragland Rd #3 Mission, TX | 1.0 | 1.0 | 651 | $925 | $1.42 | 43d | 1 | 0.15mi |
| 720 Ragland Rd #8 Mission, TX | 3.0 | 2.0 | 1053 | $1,300 | $1.23 | 23d | 1 | 0.16mi |
| 720 Ragland Rd #6 Mission, TX | 1.0 | 1.0 | 651 | $925 | $1.42 | 43d | 1 | 0.16mi |
| 800 Ragland Rd Unit 5 Mission, TX | 1.0 | 1.0 | 651 | $925 | $1.42 | 43d | 1 | 0.21mi |
| 800 Ragland Rd Unit 9 Mission, TX | 2.0 | 2.0 | 913 | $1,150 | $1.26 | 43d | 1 | 0.21mi |
| 800 Ragland Rd Unit 10 Mission, TX | 3.0 | 2.0 | 1053 | $1,325 | $1.26 | 43d | 1 | 0.21mi |
| 806 Ragland Rd Unit 1 Mission, TX | 1.0 | 1.0 | 651 | $925 | $1.42 | 43d | 1 | 0.21mi |
| 2008 Selena St Unit 3 Mission, TX | 3.0 | 2.0 | 1092 | $1,450 | $1.33 | 43d | 1 | 0.33mi |
| 606 San Antonio Ave Unit 4 Mission, TX | 2.0 | 2.0 | 900 | $895 | $0.99 | 21d | 1 | 0.36mi |
| 606 San Antonio Ave Unit 606-4 Mission, TX | 2.0 | 1.0 | 900 | $850 | $0.94 | 43d | 1 | 0.36mi |
| 606 San Antonio Ave Unit 1 Mission, TX | 2.0 | 2.0 | 900 | $850 | $0.94 | 23d | 1 | 0.37mi |
| 600 San Antonio Ave Unit 7 Mission, TX | 2.0 | 2.0 | 900 | $880 | $0.98 | 43d | 1 | 0.37mi |
| 2105 Selena St Mission, TX | 3.0 | 2.0 | 1100 | $1,500 | $1.36 | 14d | 1 | 0.37mi |
| 2002 E 1st St Mission, TX | 3.0 | 2.0 | 1017 | $1,300 | $1.28 | 43d | 1 | 0.40mi |
| 2112 Cassandra St Unit 2 Mission, TX | 3.0 | 2.0 | 1050 | $1,395 | $1.33 | 43d | 1 | 0.40mi |
| 513 San Antonio Ave Apt 8 Mission, TX | 1.0 | 1.5 | 971 | $975 | $1.00 | 43d | 1 | 0.41mi |
| 104 Sunflower St Unit 5 Mission, TX | 3.0 | 2.0 | 950 | $1,550 | $1.63 | 14d | 1 | 0.41mi |
| 2210 E 1st St Unit 34 Mission, TX | 1.0 | 1.0 | 700 | $850 | $1.21 | 23d | 1 | 0.43mi |
| 2510 E U.S. Business 83 Unit 8 Mission, TX | 2.0 | 1.5 | 940 | $800 | $0.85 | 14d | 1 | 0.78mi |
| 804 N Taylor Rd Mission, TX | 2.0 | 2.0 | 1020 | $850 | $0.83 | 43d | 1 | 0.79mi |
| 804 N Taylor Rd Unit 34 Mission, TX | 2.0 | 2.0 | 1020 | $850 | $0.83 | 43d | 1 | 0.79mi |
| 400 S 49th St Unit 2 McAllen, TX | 2.0 | 2.5 | 1080 | $950 | $0.88 | 43d | 1 | 1.00mi |
| 400 S 49th St Unit 4 McAllen, TX | 3.0 | 2.5 | 1080 | $1,100 | $1.02 | 43d | 1 | 1.00mi |
| 401 S 49th St Unit 3 McAllen, TX | 2.0 | 2.5 | 1100 | $1,100 | $1.00 | 43d | 1 | 1.03mi |
| 103 Yosemite Dr Unit 2 Mission, TX | 3.0 | 2.0 | 1116 | $1,375 | $1.23 | 43d | 1 | 1.05mi |
| 1901 N Glasscock Rd Unit 17-A Mission, TX | 3.0 | 2.0 | 924 | $950 | $1.03 | 43d | 1 | 1.10mi |
| 1901 N Glasscock Rd Lot 61 Mission, TX | 3.0 | 2.0 | 960 | $526 | $0.55 | 19d | 1 | 1.10mi |
| 1901 N Glasscock Rd Unit 150 Mission, TX | 2.0 | 2.0 | 800 | $850 | $1.06 | 43d | 1 | 1.11mi |
| 810 S Taylor Rd Mission, TX | 2.0 | 2.0 | 957 | $1,100 | $1.15 | 43d | 1 | 1.19mi |
| 816 Travis St Mission, TX | 1.0–2.0 | 1.0–2.0 | 952 | $1,215 | $1.28 | 43d | 12 | 1.21mi |
| 106 S Bryan Rd Unit 13 Mission, TX | 2.0 | 1.0 | 720 | $725 | $1.01 | 43d | 1 | 1.27mi |
| 900 Travis St Mission, TX | 1.0–2.0 | 1.0–2.0 | 1053 | $1,250 | $1.19 | 14d | 1 | 1.29mi |
| 4900 Tyler Ave McAllen, TX | 2.0–3.0 | 2.5 | 1244 | $1,520 | $1.22 | 14d | 1 | 1.41mi |
| 4801 Tyler Ave Unit 2 McAllen, TX | 2.0 | 2.5 | 1077 | $1,750 | $1.62 | 43d | 1 | 1.50mi |
| 4905 Tyler Ave Unit 4 McAllen, TX | 2.0 | 2.5 | 1077 | $1,750 | $1.62 | 43d | 1 | 1.50mi |
HOA detail
- Monthly dues
- $29 · $348/yr
Listing history 18 events
-
2026-06-18days on market $132,500 Active 38 DOM
-
2026-06-17days on market $132,500 Active 37 DOM
-
2026-06-16days on market $132,500 Active 36 DOM
-
2026-06-15days on market $132,500 Active 35 DOM
-
2026-06-14days on market $132,500 Active 33 DOM
-
2026-06-10days on market $132,500 Active 30 DOM
-
2026-06-09days on market $132,500 Active 29 DOM
-
2026-06-08days on market $132,500 Active 28 DOM
-
2026-06-07pricedays on market $132,500 Active 27 DOM
-
2026-06-03days on market $135,000 Active 23 DOM
-
2026-06-02days on market $135,000 Active 22 DOM
-
2026-06-01days on market $135,000 Active 21 DOM
-
2026-05-31days on market $135,000 Active 20 DOM
-
2026-05-31days on market $135,000 Active 19 DOM
-
2026-05-11$135,000 Active 995-char remark
-
2025-07-23soldstatus
-
2018-03-02soldstatus
-
1997-01-09soldstatus
ⓘ Source: listings_history table (triggers on properties + properties_extension) + one-shot
backfill from property_details.listing_events for pre-trigger history.
Tax reassessment forecast TX · Resets to sale price
- Current annual tax
- $1,187 · $99/mo
- Projected year-2 tax
- $2,425 · $202/mo
- Expected delta
- +$1,238/yr (+$103/mo · 104.4%)
ⓘ Screening estimate from a state-policy table — verify with the county assessor before closing.
Climate risk First Street
- Flood 1/10 Low FEMA zone X (shaded) · 0% chance over 30 yrs
- Wildfire 3/10 Moderate
- Heat 9/10 Extreme 7 d/yr ≥111°F today · 22 d/yr by 30 yrs out
- Wind 8/10 Severe 96% chance of damaging wind over 30 yrs
- Air quality 2/10 Low 1 unhealthy d/yr today · 2 by 30 yrs out
Nearby sold comps map
Loading sold comps map…
Walkable amenities ~0.75 mi
Loading nearby amenities…
Taxation est. · year 1
- Rental income
- $13,472
- − Mortgage interest
- −$7,422
- − Property taxes
- −$1,187
- − Insurance
- −$662
- − Repairs & maintenance
- −$1,078
- − Management
- −$1,078
- − HOA
- −$348
- − Depreciation
- −$3,855
- Taxable loss
- −$2,157
- Est. tax savings @ 24.0%
- +$518
- After-tax cash flow
- $626/yr
For passive investors: Depreciation is non-cash, so a rental often shows a tax loss while cash-flowing — sheltering income. Rental losses are passive: they offset passive income freely, and up to $25,000/yr can offset ordinary (W-2) income if you actively participate and your MAGI is under $100k (phasing out to $0 by $150k); unused losses carry forward. On sale, claimed depreciation is recaptured at up to 25%, and gains may owe capital-gains tax (a 1031 exchange can defer both). Figures are a year-1 estimate at your 24.0% rate — not tax advice; consult a CPA.
Schools (NCES district)
- District
- Sharyland ISD
- NCES district ID
- 4839930
- Math proficiency
- 34% ▼ -35.00%
- Reading proficiency
- 44% ▼ -15.00%
- Median HH income
- $57,792
- Composite
- 34.38/100
- National rank
- #5214
- State rank
- #406 of 826 in TX
Livability — Mission
- Score
- 75/100
- State rank
- #148
- US rank
- #4155
Category grades
Schools grade is shown separately in the Schools card above.
Census & demographics
- Census place
- Mission, TX
- County
- Hidalgo County · 623,128 people
- City population
- 78,024
- Metro
- McAllen-Edinburg-Mission, TX
- Population (ZIP)
- 78,024
- Household income
- $54,298
- Rent vs Own
- Severe rent burden
- 1714.0
Population outlook (Hidalgo County) Hauer SSP2
- Today (2025)
- 955,232 people
- By 2030
- 1,009,774 · +5.7%
- By 2040
- 1,120,332 · +17.3%
- By 2050
- 1,225,036 · +28.2%
- By 2075
- 1,439,189 · +50.7%
- By 2100
- 1,533,429 · +60.5%
Race, ethnicity, and origin ACS 2023
- Neighborhood character
- Predominantly Hispanic (85%)
- Race & ethnicity
- Hispanic / Latino 85% Two or more races 47% White 12% Asian 2%
- Hispanic origin (detail)
- Mexican 80%
- Common ancestry
- Slovak 1% Portuguese 0%
- Foreign-born
- 28% · Canada, South Korea
- Languages at home
- 22% English-only · Spanish 76%
Political lean MEDSL · Hidalgo
- 2024 margin
- Toss-up / Even · D 48.1% · R 51.0%
- 2008→2024 swing
- -41.6pp toward R · 2008: 38.7pp · 2024: -2.9pp
- All cycles
- 2024: R+2.9 2020: D+17.1 2016: D+40.5 2012: D+41.8 2008: D+38.7
Not yet ingested
- Civics
- —
Market trends
- HPI YoY
- ▼ -62.35%
- Current HPI
- 209.3573
- Rent YoY
- ▲ 0.93%
- Metro
- McAllen-Edinburg-Mission, TX
- State GDP YoY
- ▲ 3.95%
- F500 in state
- 110
Industry mix (Fortune 500 HQ in TX)
| Industry | F500 HQs | Revenue |
|---|---|---|
| Energy | 16 | $1,198B |
|
||
| Technology | 5 | $198B |
|
||
| Engineering / Construction | 4 | $72B |
|
||
| Energy Services | 3 | $60B |
|
||
| Utilities | 3 | $41B |
|
||
| Healthcare | 2 | $330B |
|
||
Price history
-1.9% since first listed5 events — show timeline
- 2026-06-06 Price Changed $132,500 MCALLENMLS
- 2026-05-11 Listed $135,000 MCALLENMLS
- 2025-07-23 Sold (Public Records) — Public Records
- 2018-03-02 Sold (Public Records) — Public Records
- 1997-01-09 Sold (Public Records) — Public Records
Property tax history
+3.7%/yrLatest (2025): $1,187 · +10.0% YoY. Source: county tax records.
Cash-flow waterfall
monthlySold comps — $/sqft
last 12 mo · ≤1 miLoading sold comps…