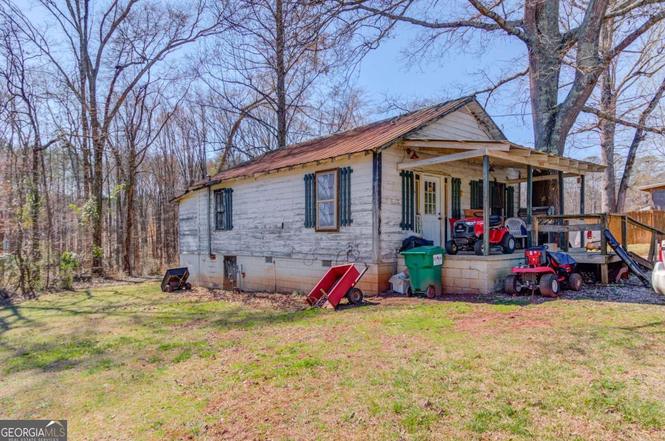
382 Dixie Red Ave · Jefferson, GA
Flood risk 1/10 · Minimal
- FEMA flood zone
- X (unshaded)
- Chance of flooding over 30 yrs
- 0.0%
- Est. flood insurance / yr
- $507 – $1,088
Fire risk 3/10 · Minor
- Est. fire insurance / yr
- $963 – $1,789
Heat risk 5/10 · Moderate
- Hot days now (above 105°F)
- 7 days/yr
- Hot days in 30 yrs
- 17 days/yr
Wind risk 4/10 · Minor
- Chance of severe wind over 30 yrs
- 14.0%
Air-quality risk 4/10 · Minor
- Unhealthy air days now
- 4 days/yr
- Unhealthy air days in 30 yrs
- 5 days/yr
Risk factors via First Street. Map © Google.
Why this score? — see what drove the B- grade
The composite is a weighted blend of 9 inputs, each scored 0–100. Each bar is that input's sub-score; the figure is the points it added to the 100-point composite (weight × sub-score).
- Cash flow +26.5/30.0
- DSCR +9.1/10.0
- ARV discount +9.1/15.0
- 1% rule +6.1/10.0
- Schools +5.9/10.0
- Rent growth +4.4/5.0
- Livability +3.7/5.0
- Condition / age +2.5/5.0
- Appreciation +0.0/10.0
$129,000
🖨 Deal sheet 📄 Offer letter ✓ Due diligence
Listing remarks MLS
INVESTOR SPECIAL! 382 & 362 Dixie Red Avenue are being sold together as adjacent properties, offering a rare opportunity to acquire two income-producing 2 bed, 1 bath homes in one transaction. 382 Dixie Red Avenue is a charming 1940s cottage with a tenant already in place who intends to stay, providing potential immediate cash flow. 362 Dixie Red Avenue, built in 1985, is the larger home and offers great potential for updates to increase rental income or resale value. Sold "As-Is", cash buyers only. Secure two assets with income potential in one smart investment.
Key facts
- 0.73 acre lot
- Built 1940
- Listed 22 days
Neighborhood map
What this means for you Summary
Snapshot
- This is a 2-bed/1.0-bath single-family listed at $129k.
Deal economics
- At list price, monthly cash flow is $342 ($4k/yr) — positive.
- The deal already cash-flows at list — no discount required.
- Meets the 1% rule at list price ($1k rent vs $129k).
- Recommended offer: $127k (1.5% below list) — sets the bar for market timing.
- Cap rate 9.5% vs local median 3.1% in Jefferson — top-decile yield for the area; either an underpriced asset or a hidden risk that comps aren't pricing in. Stress-test before assuming the spread holds.
Location & tenants
- Location reads 74/100 on livability (#40 in GA, #4,690 nationally) — a middle-class / working-renter tenant base. Strengths: crime A+, housing A+, employment A; Watch: amenities F, commute F.
- Jefferson City (town): math 73% / reading 65% proficiency, ranked #4 of 174 in GA (top 2%) — acceptable for families but not a draw, mixed tenant base, ~2y average lease.
- Zoned schools: Jefferson Academy (math 81% / reading 64%, grade A, #44 of 1,228 statewide, top 4%, 931 students, 20% FRL); Jefferson Middle School (math 68% / reading 66%, grade A-, #22 of 470 statewide, top 5%, 1,014 students, 20% FRL); Jefferson High School (math 67% / reading 64%, grade B, #6 of 424 statewide, top 1%, 1,214 students, 17% FRL).
- Market conditions: Rents rising fast (+7.5%/yr); 570 active listings in the ZIP; 1 comparable units currently listed for rent nearby; solid renter incomes; 2,167 units permitted in Jackson County in 2024 (59 in 5+ unit buildings).
- This rent is only 18% of the median local income ($96k/yr) — well below the 30% rent-burden line; pricing power to push rent on renewal without tenant pushback.
Forward outlook
- Local home prices are declining (-3.0%/yr); year-one equity from $892 of loan paydown is wiped out by about $4k of value loss. Plan a longer hold.
- Jackson County population projected at +14% by 2050 — modest demand growth; plan on rents tracking national, not racing it.
- At projected returns (-3.0% appreciation + 7.5% rent growth), your $36k cash investment doubles in ~8 years — after that, you're playing with house money.
Negotiation context
- It's been on market 22 days — a 2% lower offer ($127k) is reasonable based on typical stale-listing flexibility.
- 2 sale attempts with the ask held roughly flat each time — persistent listings suggest the price (not the market) is what's stuck; bring a comps-based counter.
Risks & watch-outs
- Watch-outs: built in 1940 — expect roof / HVAC / electrical / plumbing capex.
- Climate carrying-cost: extreme-heat days projected 7→17/yr by 2055 (HVAC capex compounding) — expect insurance premiums to compound above CPI over the hold.
Questions for the listing agent
- Built in 1940 — when were the roof, HVAC, electrical panel, plumbing, and water heater last replaced?
- Is there a deadline driving the sale (1031 exchange, divorce, estate, relocation)? That informs how much negotiation room exists.
- What's the average days-on-market for RENTAL listings here right now (not sales)? A rising rental-DOM trend means longer vacancies and softer asking-rent achievability than the comps imply.
- What's the recent tenant-quality profile in this submarket — average credit score on applications, eviction rate, late-payment / NSF rate, and stable-employment percentage? A property-management company in the area should have these aggregated.
- How much new for-sale + rental construction is in the pipeline within 1–3 miles? Heavy new supply typically softens prices + rents 12–24 months out; constrained supply supports both.
Investment metrics
- 1% rule
- 1.11% ✓
- Cap rate
- 9.48%
- Cash-on-cash
- 11.37%
- DSCR
- 1.51
- GRM
- 7.5
CMA / ARV
- ARV (on-the-fly)
- $133,632
- Comps found
- 3
Show comp detail 3 sales within ~0.75 mi
| Address | Dist | Beds/Ba | Sqft | Sold | Price | $/sf | Match |
|---|---|---|---|---|---|---|---|
| 382 Dixie Red Ave | 0.00mi | 2/1.0 | 768 (0%) | 2mo | $134,000 | $174 | 98 |
| 336 Gordon St | 0.74mi | 3/2.0 (+1) | 851 (+11%) | 2mo | $239,900 | $282 | 37 |
| 442 Gordon St | 0.65mi | 1/1.0 (-1) | 672 (-12%) | 23mo | $84,776 | $126 | 25 |
Match score weights: distance 35% · size 25% · config 20% · recency 20%. Top-matched comps best support the ARV.
Projected returns pro-forma
-3.0% appreciation · 7.48% rent growth · sell at horizon
- IRR
- 5.2%
- Equity multiple
- 1.21×
- Total profit
- $7,599
- Equity at exit
- $19,234
- IRR
- 18.1%
- Equity multiple
- 2.80×
- Total profit
- $64,893
- Equity at exit
- $11,154
Cash invested: $36,120 (down + closing). Projections, not guarantees.
Landlord ↔ Tenant lean methodology
- Overall (STATE)
- 90 Strongly Landlord-Friendly
- State Georgia
- 90 Strongly Landlord-Friendly · R+3
- County
- — inherits STATE
- City
- — inherits STATE
ZIP-level market 30549
- Home prices YoY
- -13.1%
- Rents YoY
- 7.5%
- Active inventory
- 570
- Price-to-rent
- 7.5×
Monthly cashflow live
- Estimated rent
- $1,432 medium interval (Pro) →
- Mortgage (P&I)
- −$676
- Tax from tax record
- −$59 /mo · $709/yr
- Insurance
- −$54
- HOA
- −$0
- Vacancy / Maint / Mgmt
- −$301
- Net cashflow
- $342
Break-even live
UW: 25.0% down · 7.5% · 30yr · 1.5% tax · 5.0% vac · 8.0% maint · 8.0% mgmt
Financing live
Cash to close
- Down payment
- $32,250
- Closing costs
- $3,870
- Reserves months
- —
- Total cash needed
- —
Loan-product check · same deal, 3 products live
Conventional
25% down · 7.5% · 30yr
- Down + closing
- —
- Monthly P&I
- —
- Monthly cashflow
- —
- DSCR
- —
- Eligible?
- —
Personal DTI + credit; lowest rate.
DSCR
20% down · 8.5% · 30yr
- Down + closing
- —
- Monthly P&I
- —
- Monthly cashflow
- —
- DSCR
- —
- Eligible?
- —
No personal income docs; deal must DSCR.
Hard money
10% down · 12.0% · 12mo
- Down + closing
- —
- Monthly P&I
- —
- Monthly cashflow
- —
- DSCR
- —
- Eligible?
- —
Short-term bridge; refi at stabilization.
Rent comps 1 comps
| Address | Beds | Baths | Sqft | Rent | $/sqft | DOM | Units | Dist |
|---|---|---|---|---|---|---|---|---|
| 339 Mahaffey St Jefferson, GA | 2.0 | 1.0 | 910 | $1,250 | $1.37 | 44d | 1 | 1.24mi |
Listing history 6 events
-
2026-04-01status Under Contract 584-char remark
Show marketing remark (584 chars)
INVESTOR SPECIAL! 382 & 362 Dixie Red Avenue are being sold together as adjacent properties, offering a rare opportunity to acquire two income-producing 2 bed, 1 bath homes in one transaction. 382 Dixie Red Avenue is a charming 1940s cottage with a tenant already in place who intends to stay, providing potential immediate cash flow. 362 Dixie Red Avenue, built in 1985, is the larger home and offers great potential for updates to increase rental income or resale value. Sold "As-Is", cash buyers only. Secure two assets with income potential in one smart investment.
-
2026-03-27status Pending
-
2026-03-21historical Active Under Contract 584-char remark
Show marketing remark (584 chars)
INVESTOR SPECIAL! 382 & 362 Dixie Red Avenue are being sold together as adjacent properties, offering a rare opportunity to acquire two income-producing 2 bed, 1 bath homes in one transaction. 382 Dixie Red Avenue is a charming 1940s cottage with a tenant already in place who intends to stay, providing potential immediate cash flow. 362 Dixie Red Avenue, built in 1985, is the larger home and offers great potential for updates to increase rental income or resale value. Sold "As-Is", cash buyers only. Secure two assets with income potential in one smart investment.
-
2026-03-21historical Active Under Contract
Show marketing remark (584 chars)
INVESTOR SPECIAL! 382 & 362 Dixie Red Avenue are being sold together as adjacent properties, offering a rare opportunity to acquire two income-producing 2 bed, 1 bath homes in one transaction. 382 Dixie Red Avenue is a charming 1940s cottage with a tenant already in place who intends to stay, providing potential immediate cash flow. 362 Dixie Red Avenue, built in 1985, is the larger home and offers great potential for updates to increase rental income or resale value. Sold "As-Is", cash buyers only. Secure two assets with income potential in one smart investment.
-
2026-03-03$129,000 New 584-char remark
Show marketing remark (584 chars)
INVESTOR SPECIAL! 382 & 362 Dixie Red Avenue are being sold together as adjacent properties, offering a rare opportunity to acquire two income-producing 2 bed, 1 bath homes in one transaction. 382 Dixie Red Avenue is a charming 1940s cottage with a tenant already in place who intends to stay, providing potential immediate cash flow. 362 Dixie Red Avenue, built in 1985, is the larger home and offers great potential for updates to increase rental income or resale value. Sold "As-Is", cash buyers only. Secure two assets with income potential in one smart investment.
-
2026-03-03$129,000 Active
Show marketing remark (584 chars)
INVESTOR SPECIAL! 382 & 362 Dixie Red Avenue are being sold together as adjacent properties, offering a rare opportunity to acquire two income-producing 2 bed, 1 bath homes in one transaction. 382 Dixie Red Avenue is a charming 1940s cottage with a tenant already in place who intends to stay, providing potential immediate cash flow. 362 Dixie Red Avenue, built in 1985, is the larger home and offers great potential for updates to increase rental income or resale value. Sold "As-Is", cash buyers only. Secure two assets with income potential in one smart investment.
ⓘ Source: listings_history table (triggers on properties + properties_extension) + one-shot
backfill from property_details.listing_events for pre-trigger history.
Tax reassessment forecast GA · Resets to sale price
- Current annual tax
- $709 · $59/mo
- Projected year-2 tax
- $1,187 · $99/mo
- Expected delta
- +$478/yr (+$40/mo · 67.3%)
ⓘ Screening estimate from a state-policy table — verify with the county assessor before closing.
Climate risk First Street
- Flood 1/10 Low FEMA zone X (unshaded) · 0% chance over 30 yrs
- Wildfire 3/10 Moderate
- Heat 5/10 Major 7 d/yr ≥105°F today · 17 d/yr by 30 yrs out
- Wind 4/10 Moderate 14% chance of damaging wind over 30 yrs
- Air quality 4/10 Moderate 4 unhealthy d/yr today · 5 by 30 yrs out
Nearby sold comps map
Loading sold comps map…
Walkable amenities ~0.75 mi
Loading nearby amenities…
Taxation est. · year 1
- Rental income
- $17,188
- − Mortgage interest
- −$7,226
- − Property taxes
- −$709
- − Insurance
- −$645
- − Repairs & maintenance
- −$1,375
- − Management
- −$1,375
- − Depreciation
- −$3,753
- Taxable income
- $2,105
- Est. tax owed @ 24.0%
- −$505
- After-tax cash flow
- $3,601/yr
For passive investors: Depreciation is non-cash, so a rental often shows a tax loss while cash-flowing — sheltering income. Rental losses are passive: they offset passive income freely, and up to $25,000/yr can offset ordinary (W-2) income if you actively participate and your MAGI is under $100k (phasing out to $0 by $150k); unused losses carry forward. On sale, claimed depreciation is recaptured at up to 25%, and gains may owe capital-gains tax (a 1031 exchange can defer both). Figures are a year-1 estimate at your 24.0% rate — not tax advice; consult a CPA.
Schools (NCES district)
- District
- Jefferson City
- NCES district ID
- 1303030
- Math proficiency
- 73% ▲ 2.00%
- Reading proficiency
- 65% ▼ -3.00%
- Median HH income
- $51,957
- Composite
- 58.77/100
- National rank
- #976
- State rank
- #4 of 174 in GA
Livability — Jefferson
- Score
- 74/100
- State rank
- #40
- US rank
- #4690
Category grades
Schools grade is shown separately in the Schools card above.
Census & demographics
- Census place
- Jefferson, GA
- County
- Jackson County · 50,436 people
- City population
- 32,075
- Metro
- Jefferson, GA
- Population (ZIP)
- 32,075
- Household income
- $96,195
- Rent vs Own
- Severe rent burden
- 354.0
Population outlook (Jackson County) Hauer SSP2
- Today (2025)
- 68,403 people
- By 2030
- 70,771 · +3.5%
- By 2040
- 75,050 · +9.7%
- By 2050
- 78,022 · +14.1%
- By 2075
- 82,646 · +20.8%
- By 2100
- 80,701 · +18.0%
Race, ethnicity, and origin ACS 2023
- Neighborhood character
- Predominantly White (79%)
- Race & ethnicity
- White 79% Black 9% Hispanic / Latino 6% Two or more races 5% Asian 2%
- Hispanic origin (detail)
- Mexican 2%
- Common ancestry
- Italian 3% Slovak 3% Serbian 1%
- Foreign-born
- 5% · Canada, Jamaica
- Languages at home
- 93% English-only · Spanish 4% Russian/Polish/Slavic 1% Other Asian/Pacific 1%
Political lean MEDSL · Jackson
- 2024 margin
- Solid R (+55.1) · D 22.2% · R 77.2%
- 2008→2024 swing
- +0.8pp no change · 2008: -55.9pp · 2024: -55.1pp
- All cycles
- 2024: R+55.1 2020: R+58.0 2016: R+63.9 2012: R+62.9 2008: R+55.9
Not yet ingested
- Civics
- —
Market trends
- HPI YoY
- ▼ -49.79%
- Current HPI
- 330.992
- Rent YoY
- ▲ 7.48%
- Metro
- Jefferson, GA
- State GDP YoY
- ▲ 2.66%
- F500 in state
- 28
Industry mix (Fortune 500 HQ in GA)
| Industry | F500 HQs | Revenue |
|---|---|---|
| Paper / Packaging | 2 | $29B |
|
||
| Retail | 1 | $160B |
|
||
| Transportation / Logistics | 1 | $91B |
|
||
| Airlines | 1 | $62B |
|
||
| Consumer Goods | 1 | $47B |
|
||
| Utilities | 1 | $25B |
|
||
Price history
+0.0% since first listed6 events — show timeline
- 2026-04-01 Pending — GAMLS
- 2026-03-27 Pending — FMLS
- 2026-03-21 Contingent — GAMLS
- 2026-03-21 Contingent — FMLS
- 2026-03-03 Listed $129,000 FMLS
- 2026-03-03 Listed $129,000 GAMLS
Property tax history
+13.1%/yrLatest (2025): $709 · -0.4% YoY. Source: county tax records.
Cash-flow waterfall
monthlySold comps — $/sqft
last 12 mo · ≤1 miLoading sold comps…