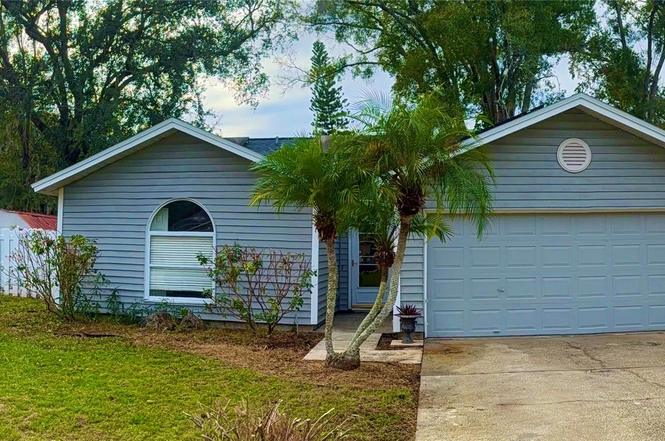
2635 Glenview Dr · Land O' Lakes, FL
Flood risk 1/10 · Minimal
- FEMA flood zone
- X (unshaded)
- Chance of flooding over 30 yrs
- 0.0%
- Est. flood insurance / yr
- $507 – $1,088
Fire risk 3/10 · Minor
- Est. fire insurance / yr
- $947 – $1,759
Heat risk 10/10 · Severe
- Hot days now (above 109°F)
- 7 days/yr
- Hot days in 30 yrs
- 25 days/yr
Wind risk 9/10 · Severe
- Chance of severe wind over 30 yrs
- 99.0%
Air-quality risk 2/10 · Minimal
- Unhealthy air days now
- 2 days/yr
- Unhealthy air days in 30 yrs
- 2 days/yr
Risk factors via First Street. Map © Google.
Why this score? — see what drove the B- grade
The composite is a weighted blend of 9 inputs, each scored 0–100. Each bar is that input's sub-score; the figure is the points it added to the 100-point composite (weight × sub-score).
- Cash flow +24.8/30.0
- ARV discount +15.0/15.0
- DSCR +8.0/10.0
- 1% rule +5.3/10.0
- Schools +4.3/10.0
- Rent growth +2.7/5.0
- Livability +2.5/5.0
- Condition / age +2.5/5.0
- Appreciation +0.0/10.0
$230,000
🖨 Deal sheet 📄 Offer letter ✓ Due diligence
Listing remarks
Land O' Lakes, Florida in-ground pool home near I-75, shopping, medical facilities including the VA hospitalBaycare, and ZSt. Josephs Hospital, Advent Health, and just minutes from the Land O' Lakes Recreation Center and Public Library. 3-bedroom, 2-bath 2 gar attached garage is located in Lake Padgett Estates in Land O'Lakes and is priced under appraised value and ready for your vision. Florida home features a private in-ground pool, a modern granite and wood cabinet kitchen with gas cooktop and double oven, a cozy fireplace, and walk-in closets in all bedrooms. While it needs new flooring and a thorough cleaning, the bones look solid with a newer roof and 10 year young 13 SeeR AC. House o
Key facts
- Gas cooktop
- In-ground pool
- Walk-in closets
Tags
Property features AI
Finance
- Other: Property zoned PUD; Lot approximately 0.19 acres; Solar energy generation present; Turnkey furnished
- HOA & community: Pets allowed (cats and dogs)
Exterior
- Parking: Attached garage with 2 spaces
- Utilities: Public water; Public sewer; Electricity connected; Propane available; Cable and high-speed internet available; Underground utilities
- Home design: Single-family residence; Residential property; One story; Faces east; Condition listed as fixer
- Construction: Vinyl siding; Shingle roof; Slab foundation; Built with approximately 1,566 total building area
- Exterior features: Sliding doors; In-ground private pool with deck; Spa (in-ground)
Interior
- Kitchen: Built-in oven; Cooktop
- Bedrooms: 3 bedrooms
- Flooring: Tile
- Bathrooms: 2 full bathrooms
- Heating & cooling: Electric heating; Central air conditioning
- Interior features: Ceiling fans; High ceilings; Open floor plan; Wood-burning fireplace in living room
- Laundry & utility: Laundry area located in the garage
Neighborhood map
What this means for you Summary
Snapshot
- This is a 3-bed/2.0-bath single-family listed at $230k.
Deal economics
- At list price, monthly cash flow is $486 ($6k/yr) — positive.
- The deal already cash-flows at list — no discount required.
- Meets the 1% rule at list price ($2k rent vs $230k).
- Recommended offer: $216k (6.0% below list) — sets the bar for market timing.
- Cap rate 8.8% vs local median 3.7% in Land O' Lakes — top-decile yield for the area; either an underpriced asset or a hidden risk that comps aren't pricing in. Stress-test before assuming the spread holds.
Location & tenants
- Location reads: area grade B — affects rentability + tenant quality, not the cash-flow math above.
- Pasco (suburban): math 50% / reading 52% proficiency, ranked #32 of 73 in FL (top 44%) — acceptable for families but not a draw, mixed tenant base, ~2y average lease.
- Zoned schools: Pasco Elementary School (math 29% / reading 30%, grade F, #1,896 of 2,144 statewide, top 90%, 586 students, 89% FRL); Land O' Lakes High School (math 56% / reading 64%, grade C+, #106 of 667 statewide, top 16%, 2,248 students, 27% FRL).
- Market conditions: Rents flat; 173 active listings in the ZIP; 14 comparable units currently listed for rent nearby; rentals leasing fast (median 13d on market — plan ~1-2 weeks tenant-placement turnaround); solid renter incomes; 6,765 units permitted in Pasco County in 2024 (1,250 in 5+ unit buildings).
Forward outlook
- Local home prices are declining (-3.0%/yr); year-one equity from $2k of loan paydown is wiped out by about $7k of value loss. Plan a longer hold.
- Pasco County population projected at +29% by 2050 — long-run rental-demand tailwind backs the buy-and-hold thesis.
Negotiation context
- It's been on market 63 days — a 6% lower offer ($216k) is reasonable based on typical stale-listing flexibility.
- 4 sale attempts; this cycle's ask has dropped $70k (23%) from the opening price — seller is motivated, your offer sets the floor, not the list.
- Current owner paid $110k; list at $230k implies a 109% gain — meaningful room to come down on a strong offer.
Risks & watch-outs
- Climate carrying-cost: severe wind risk, 99% chance of damaging wind over 30y; extreme-heat days projected 7→25/yr by 2055 (HVAC capex compounding) — expect insurance premiums to compound above CPI over the hold.
Questions for the listing agent
- It's been on market 63 days. Have you received any prior offers? Is the seller open to a 6% concession, seller financing, or rate buy-down credit?
- Why hasn't it sold? Are there any deal-killer items the seller is aware of (foundation, flood, title, zoning, code violations)?
- Is there a deadline driving the sale (1031 exchange, divorce, estate, relocation)? That informs how much negotiation room exists.
- What's the average days-on-market for RENTAL listings here right now (not sales)? A rising rental-DOM trend means longer vacancies and softer asking-rent achievability than the comps imply.
- What's the recent tenant-quality profile in this submarket — average credit score on applications, eviction rate, late-payment / NSF rate, and stable-employment percentage? A property-management company in the area should have these aggregated.
- How much new for-sale + rental construction is in the pipeline within 1–3 miles? Heavy new supply typically softens prices + rents 12–24 months out; constrained supply supports both.
Investment metrics
- 1% rule
- 1.03% ✓
- Cap rate
- 8.83%
- Cash-on-cash
- 9.05%
- DSCR
- 1.40
- GRM
- 8.1
CMA / ARV
- ARV (on-the-fly)
- $324,072
- Comps found
- 9
Show comp detail 9 sales within ~0.75 mi
| Address | Dist | Beds/Ba | Sqft | Sold | Price | $/sf | Match |
|---|---|---|---|---|---|---|---|
| 22716 Penny Loop | 0.26mi | 3/2.0 | 1,256 (-2%) | 8mo | $348,000 | $277 | 77 |
| 2518 Shadecrest Rd | 0.14mi | 3/2.0 | 1,390 (+8%) | 8mo | $350,000 | $252 | 74 |
| 2906 Martha Ln | 0.26mi | 4/2.0 (+1) | 1,308 (+2%) | 15mo | $329,000 | $252 | 67 |
| 2715 Shadecrest Rd | 0.14mi | 3/2.0 | 1,208 (-6%) | 20mo | $329,900 | $273 | 67 |
| 22700 Southshore Dr | 0.61mi | 3/2.0 | 1,400 (+9%) | 14mo | $395,000 | $282 | 45 |
| 22644 Saint Thomas Cir | 0.74mi | 3/2.0 | 1,444 (+12%) | 1mo | $342,000 | $237 | 44 |
| 3128 Gulfwind Dr | 0.52mi | 3/2.0 | 1,415 (+10%) | 20mo | $375,000 | $265 | 42 |
| 22443 Crows Nest Ct | 0.75mi | 4/2.0 (+1) | 1,438 (+12%) | 11mo | $330,000 | $229 | 31 |
| 22621 Saint Thomas Cir | 0.70mi | 4/2.0 (+1) | 1,444 (+12%) | 14mo | $330,000 | $229 | 30 |
Match score weights: distance 35% · size 25% · config 20% · recency 20%. Top-matched comps best support the ARV.
Projected returns pro-forma
-3.0% appreciation · 0.87% rent growth · sell at horizon
- IRR
- -4.8%
- Equity multiple
- 0.82×
- Total profit
- $-11,388
- Equity at exit
- $34,294
- IRR
- 2.4%
- Equity multiple
- 1.16×
- Total profit
- $10,036
- Equity at exit
- $19,886
Cash invested: $64,400 (down + closing). Projections, not guarantees.
Landlord ↔ Tenant lean methodology
- Overall (STATE)
- 87 Strongly Landlord-Friendly
- State Florida
- 87 Strongly Landlord-Friendly · R+3
- County
- — inherits STATE
- City
- — inherits STATE
ZIP-level market 34639
- Home prices YoY
- -21.9%
- Rents YoY
- 0.9%
- Active inventory
- 173
- Price-to-rent
- 8.1×
Monthly cashflow live
- Estimated rent
- $2,364 high interval (Pro) →
- Mortgage (P&I)
- −$1,206
- Tax from tax record
- −$80 /mo · $960/yr
- Insurance
- −$96
- HOA
- −$0
- Vacancy / Maint / Mgmt
- −$496
- Net cashflow
- $486
Break-even live
UW: 25.0% down · 7.5% · 30yr · 1.5% tax · 5.0% vac · 8.0% maint · 8.0% mgmt
Financing live
Cash to close
- Down payment
- $57,500
- Closing costs
- $6,900
- Reserves months
- —
- Total cash needed
- —
Loan-product check · same deal, 3 products live
Conventional
25% down · 7.5% · 30yr
- Down + closing
- —
- Monthly P&I
- —
- Monthly cashflow
- —
- DSCR
- —
- Eligible?
- —
Personal DTI + credit; lowest rate.
DSCR
20% down · 8.5% · 30yr
- Down + closing
- —
- Monthly P&I
- —
- Monthly cashflow
- —
- DSCR
- —
- Eligible?
- —
No personal income docs; deal must DSCR.
Hard money
10% down · 12.0% · 12mo
- Down + closing
- —
- Monthly P&I
- —
- Monthly cashflow
- —
- DSCR
- —
- Eligible?
- —
Short-term bridge; refi at stabilization.
Rent comps 14 comps
| Address | Beds | Baths | Sqft | Rent | $/sqft | DOM | Units | Dist |
|---|---|---|---|---|---|---|---|---|
| 22743 Preakness Blvd Land O' Lakes, FL | 1.0–3.0 | 1.0–2.0 | 1115 | $2,154 | $1.93 | 2d | 23 | 0.44mi |
| 1851 Falling Star Ln Lutz, FL | 3.0 | 2.0 | 1194 | $2,150 | $1.80 | 5d | 1 | 0.80mi |
| 3306 Lake Saxon Dr Land O Lakes, FL | 3.0 | 2.0 | 1782 | $2,775 | $1.56 | 18d | 1 | 0.84mi |
| 2052 Park Crescent Dr Land O Lakes, FL | 3.0 | 2.5 | 1806 | $2,150 | $1.19 | 12d | 1 | 0.91mi |
| 1827 Hammocks Ave Unit 1827 Lutz, FL | 2.0 | 2.0 | 1233 | $1,975 | $1.60 | 24d | 1 | 0.97mi |
| 2608 20 Mile Level Rd Land O Lakes, FL | 3.0 | 2.0 | 1504 | $2,400 | $1.60 | 24d | 1 | 0.99mi |
| 1901 Cypress Preserve Dr Lutz, FL | 1.0–3.0 | 1.0–2.0 | 1027 | $2,251 | $2.19 | 2d | 26 | 1.07mi |
| 23700 Viento Dr Land O' Lakes, FL | 1.0–3.0 | 1.0–2.0 | 1102 | $2,315 | $2.10 | 2d | 23 | 1.20mi |
| 1828 Osprey Ln Lutz, FL | 4.0 | 2.0 | 1763 | $2,800 | $1.59 | 24d | 1 | 1.23mi |
| 23320 Papyrus Way Lutz, FL | 3.0 | 2.5 | 1634 | $2,045 | $1.25 | 11d | 1 | 1.24mi |
| 23802 Coral Ridge Ln Land O Lakes, FL | 2.0 | 2.0 | 1555 | $2,600 | $1.67 | 5d | 1 | 1.24mi |
| 3816 Fieldflower Ct Land O Lakes, FL | 3.0 | 2.0 | 1833 | $2,151 | $1.17 | 5d | 1 | 1.27mi |
| 21606 Rosewood Ct Lutz, FL | 3.0 | 2.0 | 1393 | $2,255 | $1.62 | 24d | 1 | 1.33mi |
| 1726 Roseville St Lutz, FL | 3.0 | 2.5 | 1801 | $2,700 | $1.50 | 22d | 1 | 1.41mi |
Listing history 20 events
-
2026-06-18days on market $230,000 Active 63 DOM
-
2026-06-17pricedays on market $230,000 Active 62 DOM
-
2026-06-16days on market $250,000 Active 61 DOM
-
2026-06-15days on market $250,000 Active 60 DOM
-
2026-06-13days on market $250,000 Active 58 DOM
-
2026-06-09days on market $250,000 Active 54 DOM
-
2026-06-08days on market $250,000 Active 53 DOM
-
2026-06-07statusdays on market $250,000 Active 52 DOM
-
2026-05-07status Active
-
2026-05-04status Pending
-
2026-04-28price $250,000
-
2026-04-25status Active
-
2026-04-09status Pending
-
2026-04-07status Active
-
2026-04-07price $275,000
-
2025-12-26status Pending
-
2025-12-19price $299,000
-
2025-12-09$300,000 Active
-
2001-11-20soldstatus $110,000
-
1996-10-29soldstatus $86,000
ⓘ Source: listings_history table (triggers on properties + properties_extension) + one-shot
backfill from property_details.listing_events for pre-trigger history.
Tax reassessment forecast FL · Resets to sale price
- Current annual tax
- $960 · $80/mo
- Projected year-2 tax
- $1,909 · $159/mo
- Expected delta
- +$949/yr (+$79/mo · 98.9%)
ⓘ Screening estimate from a state-policy table — verify with the county assessor before closing.
Climate risk First Street
- Flood 1/10 Low FEMA zone X (unshaded) · 0% chance over 30 yrs
- Wildfire 3/10 Moderate
- Heat 10/10 Extreme 7 d/yr ≥109°F today · 25 d/yr by 30 yrs out
- Wind 9/10 Extreme 99% chance of damaging wind over 30 yrs
- Air quality 2/10 Low 2 unhealthy d/yr today · 2 by 30 yrs out
Nearby sold comps map
Loading sold comps map…
Walkable amenities ~0.75 mi
Loading nearby amenities…
Taxation est. · year 1
- Rental income
- $28,370
- − Mortgage interest
- −$12,884
- − Property taxes
- −$960
- − Insurance
- −$1,150
- − Repairs & maintenance
- −$2,270
- − Management
- −$2,270
- − Depreciation
- −$6,691
- Taxable income
- $2,146
- Est. tax owed @ 24.0%
- −$515
- After-tax cash flow
- $5,313/yr
For passive investors: Depreciation is non-cash, so a rental often shows a tax loss while cash-flowing — sheltering income. Rental losses are passive: they offset passive income freely, and up to $25,000/yr can offset ordinary (W-2) income if you actively participate and your MAGI is under $100k (phasing out to $0 by $150k); unused losses carry forward. On sale, claimed depreciation is recaptured at up to 25%, and gains may owe capital-gains tax (a 1031 exchange can defer both). Figures are a year-1 estimate at your 24.0% rate — not tax advice; consult a CPA.
Schools (NCES district)
- District
- Pasco
- NCES district ID
- 1201530
- Math proficiency
- 50% ▼ -10.00%
- Reading proficiency
- 52% ▼ -5.00%
- Median HH income
- $45,039
- Composite
- 43.14/100
- National rank
- #3074
- State rank
- #32 of 73 in FL
Livability — Land O' Lakes
No livability data for this city. (Only ~50 U.S. cities are tracked.)
Census & demographics
- Census place
- Land O' Lakes, FL
- County
- Pasco County · 524,098 people
- Metro
- Tampa-St. Petersburg-Clearwater, FL
- Population (ZIP)
- 30,831
- Household income
- $101,486
- Rent vs Own
- Severe rent burden
- 383.0
Population outlook (Pasco County) Hauer SSP2
- Today (2025)
- 570,045 people
- By 2030
- 605,844 · +6.3%
- By 2040
- 674,806 · +18.4%
- By 2050
- 736,022 · +29.1%
- By 2075
- 862,900 · +51.4%
- By 2100
- 906,364 · +59.0%
Race, ethnicity, and origin ACS 2023
- Neighborhood character
- Predominantly White (66%)
- Race & ethnicity
- White 66% Hispanic / Latino 20% Two or more races 11% Black 6% Asian 2%
- Hispanic origin (detail)
- Mexican 2% Puerto Rican 6% Cuban 4% Dominican 2%
- Common ancestry
- Romanian 4% Slovak 2% Lithuanian 2%
- Foreign-born
- 12% · Canada, Jamaica, Vietnam
- Languages at home
- 81% English-only · Spanish 12% Russian/Polish/Slavic 2% Arabic 1%
Political lean MEDSL · Pasco
- 2024 margin
- Strong R (+25.2) · D 36.9% · R 62.1% · Other 1.0%
- 2008→2024 swing
- -21.6pp toward R · 2008: -3.6pp · 2024: -25.2pp
- All cycles
- 2024: R+25.2 2020: R+20.1 2016: R+21.6 2012: R+6.7 2008: R+3.6
Not yet ingested
- Civics
- —
Market trends
- HPI YoY
- ▼ -78.35%
- Current HPI
- 280.2986
- Rent YoY
- ▲ 0.87%
- Metro
- Tampa-St. Petersburg-Clearwater, FL
- State GDP YoY
- ▲ 3.28%
- F500 in state
- 36
Industry mix (Fortune 500 HQ in FL)
| Industry | F500 HQs | Revenue |
|---|---|---|
| Industrial Technology | 2 | $29B |
|
||
| Insurance | 2 | $17B |
|
||
| Retail | 1 | $60B |
|
||
| Technology Distribution | 1 | $58B |
|
||
| Homebuilding | 1 | $35B |
|
||
| Technology Manufacturing | 1 | $35B |
|
||
Price history
+190.7% since first listed12 events — show timeline
- 2026-05-07 Relisted — Stellar MLS as Distributed by MLS Grid
- 2026-05-04 Pending — Stellar MLS as Distributed by MLS Grid
- 2026-04-28 Price Changed $250,000 Stellar MLS as Distributed by MLS Grid
- 2026-04-25 Relisted — Stellar MLS as Distributed by MLS Grid
- 2026-04-09 Pending — Stellar MLS as Distributed by MLS Grid
- 2026-04-07 Relisted — Stellar MLS as Distributed by MLS Grid
- 2026-04-07 Price Changed $275,000 Stellar MLS as Distributed by MLS Grid
- 2025-12-26 Pending — Stellar MLS as Distributed by MLS Grid
- 2025-12-19 Price Changed $299,000 Stellar MLS as Distributed by MLS Grid
- 2025-12-09 Listed $300,000 Stellar MLS as Distributed by MLS Grid
- 2001-11-20 Sold (Public Records) $110,000 Public Records
- 1996-10-29 Sold (Public Records) $86,000 Public Records
Property tax history
+2.1%/yrLatest (2025): $960 · +3.6% YoY. Source: county tax records.
Cash-flow waterfall
monthlySold comps — $/sqft
last 12 mo · ≤1 miLoading sold comps…