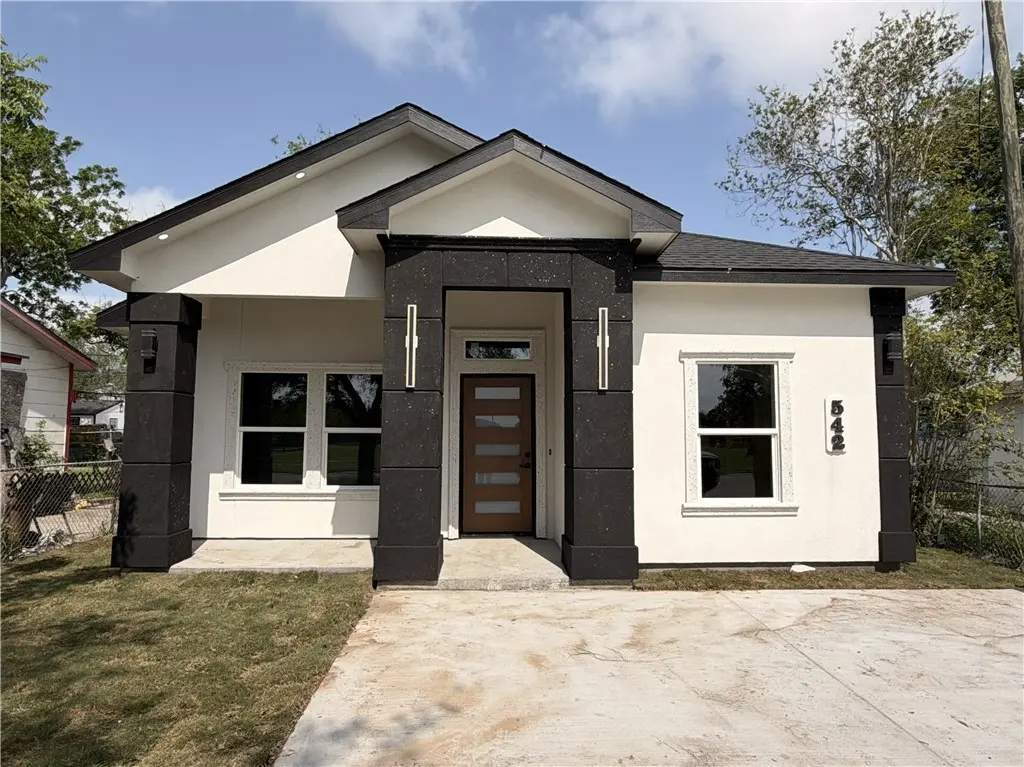
542 Balboa St · Corpus Christi, TX
Flood risk 3/10 · Minor
- FEMA flood zone
- X (unshaded)
- Chance of flooding over 30 yrs
- 0.2%
- Est. flood insurance / yr
- $507 – $1,088
Fire risk 1/10 · Minimal
- Est. fire insurance / yr
- $1,222 – $2,270
Heat risk 10/10 · Severe
- Hot days now (above 107°F)
- 7 days/yr
- Hot days in 30 yrs
- 24 days/yr
Wind risk 9/10 · Severe
- Chance of severe wind over 30 yrs
- 99.0%
Air-quality risk 1/10 · Minimal
- Unhealthy air days now
- 0 days/yr
- Unhealthy air days in 30 yrs
- 0 days/yr
Risk factors via First Street. Map © Google.
Why this score? — see what drove the F grade
The composite is a weighted blend of 9 inputs, each scored 0–100. Each bar is that input's sub-score; the figure is the points it added to the 100-point composite (weight × sub-score).
- ARV discount +7.5/15.0
- Appreciation +5.7/10.0
- Cash flow +5.1/30.0
- Livability +3.9/5.0
- Schools +2.8/10.0
- Rent growth +2.5/5.0
- Condition / age +2.5/5.0
- 1% rule +0.0/10.0
- DSCR +0.0/10.0
$210,000
🖨 Deal sheet 📄 Offer letter ✓ Due diligence
Listing remarks MLS
Welcome to 542 Balboa Street—a prime investment opportunity in Corpus Christi! This 448 sq. ft. home, set on a 4,321 sq. ft. lot, is ready for transformation. Renovate and restore its charm or start fresh and build your dream home. With exciting new developments reshaping the area, now is the time to invest in this growing community. Don’t miss out—seize this opportunity today!
Key facts
- Quartz countertops
- Custom cabinets
- Modern fixtures
Tags
Property features AI
Finance
- HOA & community: Short-term rentals allowed
Exterior
- Parking: Concrete parking surface
- Utilities: Public water; Public sewer
- Home design: Single-story; New construction; Shingle roof; Stucco exterior; Slab foundation
- Construction: Built as new construction; Stucco construction; Shingle roof; Slab foundation
- Exterior features: Wood fencing; No additional exterior features listed
Interior
- Kitchen: Dishwasher; Electric oven; Electric range; Microwave
- Flooring: Tile
- Bathrooms: 2 full bathrooms
- Heating & cooling: Central heating (electric); Central air conditioning
- Interior features: Open floor plan; Ceiling fan(s)
- Laundry & utility: Washer hookup; Dryer hookup
Neighborhood map
What this means for you Summary
Snapshot
- This is a 3-bed/2.0-bath single-family listed at $210k.
Deal economics
- At list price, monthly cash flow is $-487 ($-6k/yr) — negative.
- To cash-flow at today's rent, offer at most $124k (41.0% below list).
- To meet the 1% rule (rent ≥ 1% of price), the offer needs to be $98k (53.2% below list).
- Recommended offer: $98k (53.2% below list) — sets the bar for 1% rule.
Location & tenants
- Location reads 78/100 on livability (#66 in TX, #2,404 nationally) — a middle-class / working-renter tenant base. Strengths: commute A+, cost of living A+, housing A+; Watch: crime F.
- Corpus Christi ISD (urban): math 31% / reading 35% proficiency, ranked #562 of 826 in TX (top 68%) — families likely to look elsewhere, expect single-tenant / working-renter base with shorter leases; 63% free/reduced lunch — lower-income household profile, screen leases tightly.
- Market conditions: 74 active listings in the ZIP; 1 comparable units currently listed for rent nearby; lower-income renter base — watch delinquency; 1,397 units permitted in Nueces County in 2024 (47 in 5+ unit buildings).
- This rent runs 31% of the median local income ($38k/yr) — at the standard rent-burdened threshold; future hikes will face affordability resistance.
Forward outlook
- In year one you build about $4k of equity ($1k loan paydown + $3k appreciation (1.4% local appreciation)).
- Nueces County population projected at +36% by 2050 — long-run rental-demand tailwind backs the buy-and-hold thesis.
- By year 8, paydown + projected appreciation supports a ~$34k cash-out refi (75% LTV) — recoverable capital for the next deal without selling this one.
Negotiation context
- Only 3 days on market — expect competitive offers; lowballing is unlikely to land.
- 6 sale attempts since 5y ago with the ask held roughly flat each time — persistent listings suggest the price (not the market) is what's stuck; bring a comps-based counter.
Risks & watch-outs
- Climate carrying-cost: severe wind risk, 99% chance of damaging wind over 30y; extreme-heat days projected 7→24/yr by 2055 (HVAC capex compounding) — expect insurance premiums to compound above CPI over the hold.
Questions for the listing agent
- What do current leases actually rent for vs. the listed asking? Can we see a recent rent roll and the last 12 months of T-12 income?
- Is there a deadline driving the sale (1031 exchange, divorce, estate, relocation)? That informs how much negotiation room exists.
- Crime grade is F in this area — have there been break-ins, vandalism, or insurance claims at this property in the last 3 years? What carrier currently insures it and at what premium?
- The area grade is low — what's the realistic commute time and amenity access for the typical tenant pool here? Any planned neighborhood developments (good or bad) we should know about?
- What's the average days-on-market for RENTAL listings here right now (not sales)? A rising rental-DOM trend means longer vacancies and softer asking-rent achievability than the comps imply.
- What's the recent tenant-quality profile in this submarket — average credit score on applications, eviction rate, late-payment / NSF rate, and stable-employment percentage? A property-management company in the area should have these aggregated.
- How much new for-sale + rental construction is in the pipeline within 1–3 miles? Heavy new supply typically softens prices + rents 12–24 months out; constrained supply supports both.
Investment metrics
- 1% rule
- 0.47% ✗
- Cap rate
- 3.51%
- Cash-on-cash
- -9.94%
- DSCR
- 0.56
- GRM
- 17.8
CMA / ARV
No comps found within radius.
Projected returns pro-forma
1.42% appreciation · 3.0% rent growth · sell at horizon
- IRR
- -7.5%
- Equity multiple
- 0.61×
- Total profit
- $-22,831
- Equity at exit
- $76,325
- IRR
- -2.0%
- Equity multiple
- 0.74×
- Total profit
- $-15,330
- Equity at exit
- $105,114
Cash invested: $58,800 (down + closing). Projections, not guarantees.
Landlord ↔ Tenant lean methodology
- Overall (STATE)
- 87 Strongly Landlord-Friendly
- State Texas
- 87 Strongly Landlord-Friendly · R+5
- County
- — inherits STATE
- City
- — inherits STATE
ZIP-level market 78405
- Home prices YoY
- 1.3%
- Active inventory
- 74
- Price-to-rent
- 17.8×
Monthly cashflow live
- Estimated rent
- $983 medium interval (Pro) →
- Mortgage (P&I)
- −$1,101
- Tax from tax record
- −$74 /mo · $893/yr
- Insurance
- −$88
- HOA
- −$0
- Vacancy / Maint / Mgmt
- −$206
- Net cashflow
- $-487
Break-even live
UW: 25.0% down · 7.5% · 30yr · 1.5% tax · 5.0% vac · 8.0% maint · 8.0% mgmt
Financing live
Cash to close
- Down payment
- $52,500
- Closing costs
- $6,300
- Reserves months
- —
- Total cash needed
- —
Loan-product check · same deal, 3 products live
Conventional
25% down · 7.5% · 30yr
- Down + closing
- —
- Monthly P&I
- —
- Monthly cashflow
- —
- DSCR
- —
- Eligible?
- —
Personal DTI + credit; lowest rate.
DSCR
20% down · 8.5% · 30yr
- Down + closing
- —
- Monthly P&I
- —
- Monthly cashflow
- —
- DSCR
- —
- Eligible?
- —
No personal income docs; deal must DSCR.
Hard money
10% down · 12.0% · 12mo
- Down + closing
- —
- Monthly P&I
- —
- Monthly cashflow
- —
- DSCR
- —
- Eligible?
- —
Short-term bridge; refi at stabilization.
Rent comps 1 comps
| Address | Beds | Baths | Sqft | Rent | $/sqft | DOM | Units | Dist |
|---|---|---|---|---|---|---|---|---|
| 3115 Agnes St Corpus Christi, TX | 2.0 | 1.0 | 428 | $828 | $1.93 | 43d | 3 | 0.79mi |
Listing history 22 events
-
2026-05-05status Pending
-
2026-05-03$210,000 Active
-
2026-04-30historical
-
2026-04-29$210,000 Active
-
2025-12-22soldstatus
-
2025-11-25soldstatus
-
2025-03-26soldstatus Closed 398-char remark
Show marketing remark (398 chars)
Welcome to 542 Balboa Street—a prime investment opportunity in Corpus Christi! This 448 sq. ft. home, set on a 4,321 sq. ft. lot, is ready for transformation. Renovate and restore its charm or start fresh and build your dream home. With exciting new developments reshaping the area, now is the time to invest in this growing community. Don’t miss out—seize this opportunity today!
-
2025-03-26soldstatus
Show marketing remark (398 chars)
Welcome to 542 Balboa Street—a prime investment opportunity in Corpus Christi! This 448 sq. ft. home, set on a 4,321 sq. ft. lot, is ready for transformation. Renovate and restore its charm or start fresh and build your dream home. With exciting new developments reshaping the area, now is the time to invest in this growing community. Don’t miss out—seize this opportunity today!
-
2025-03-06status Pending 398-char remark
Show marketing remark (398 chars)
Welcome to 542 Balboa Street—a prime investment opportunity in Corpus Christi! This 448 sq. ft. home, set on a 4,321 sq. ft. lot, is ready for transformation. Renovate and restore its charm or start fresh and build your dream home. With exciting new developments reshaping the area, now is the time to invest in this growing community. Don’t miss out—seize this opportunity today!
-
2025-02-27historical Active Under Contract 398-char remark
Show marketing remark (398 chars)
Welcome to 542 Balboa Street—a prime investment opportunity in Corpus Christi! This 448 sq. ft. home, set on a 4,321 sq. ft. lot, is ready for transformation. Renovate and restore its charm or start fresh and build your dream home. With exciting new developments reshaping the area, now is the time to invest in this growing community. Don’t miss out—seize this opportunity today!
-
2025-02-20$35,000 Active 398-char remark
Show marketing remark (398 chars)
Welcome to 542 Balboa Street—a prime investment opportunity in Corpus Christi! This 448 sq. ft. home, set on a 4,321 sq. ft. lot, is ready for transformation. Renovate and restore its charm or start fresh and build your dream home. With exciting new developments reshaping the area, now is the time to invest in this growing community. Don’t miss out—seize this opportunity today!
-
2023-08-07historical
-
2023-04-27price $45,000
-
2023-02-06$50,000 Active
-
2022-12-15soldstatus
-
2022-09-07historical
-
2022-07-07$40,000 Active
-
2022-04-27historical
-
2022-03-28price $49,000
-
2021-12-19price $55,000
-
2021-12-15$50,000 Active
-
1998-11-16soldstatus
ⓘ Source: listings_history table (triggers on properties + properties_extension) + one-shot
backfill from property_details.listing_events for pre-trigger history.
Tax reassessment forecast TX · Resets to sale price
- Current annual tax
- $893 · $74/mo
- Projected year-2 tax
- $3,843 · $320/mo
- Expected delta
- +$2,950/yr (+$246/mo · 330.3%)
ⓘ Screening estimate from a state-policy table — verify with the county assessor before closing.
Climate risk First Street
- Flood 3/10 Moderate FEMA zone X (unshaded) · 20% chance over 30 yrs
- Wildfire 1/10 Low
- Heat 10/10 Extreme 7 d/yr ≥107°F today · 24 d/yr by 30 yrs out
- Wind 9/10 Extreme 99% chance of damaging wind over 30 yrs
- Air quality 1/10 Low 0 unhealthy d/yr today · 0 by 30 yrs out
Nearby sold comps map
Loading sold comps map…
Walkable amenities ~0.75 mi
Loading nearby amenities…
Taxation est. · year 1
- Rental income
- $11,791
- − Mortgage interest
- −$11,763
- − Property taxes
- −$893
- − Insurance
- −$1,050
- − Repairs & maintenance
- −$943
- − Management
- −$943
- − Depreciation
- −$6,109
- Taxable loss
- −$9,911
- Est. tax savings @ 24.0%
- +$2,379
- After-tax cash flow
- $-3,465/yr
For passive investors: Depreciation is non-cash, so a rental often shows a tax loss while cash-flowing — sheltering income. Rental losses are passive: they offset passive income freely, and up to $25,000/yr can offset ordinary (W-2) income if you actively participate and your MAGI is under $100k (phasing out to $0 by $150k); unused losses carry forward. On sale, claimed depreciation is recaptured at up to 25%, and gains may owe capital-gains tax (a 1031 exchange can defer both). Figures are a year-1 estimate at your 24.0% rate — not tax advice; consult a CPA.
Schools (NCES district)
- District
- Corpus Christi ISD
- NCES district ID
- 4815270
- Math proficiency
- 31% ▼ -18.00%
- Reading proficiency
- 35% ▼ -7.00%
- Median HH income
- $45,672
- Composite
- 28.27/100
- National rank
- #6793
- State rank
- #562 of 826 in TX
Livability — Corpus Christi
- Score
- 78/100
- State rank
- #66
- US rank
- #2404
Category grades
Schools grade is shown separately in the Schools card above.
Census & demographics
- Census place
- Corpus Christi, TX
- County
- Nueces County · 296,836 people
- City population
- 296,836
- Metro
- Corpus Christi, TX
- Population (ZIP)
- 14,602
- Household income
- $38,294
- Rent vs Own
- Severe rent burden
- 867.0
Population outlook (Nueces County) Hauer SSP2
- Today (2025)
- 418,037 people
- By 2030
- 447,123 · +7.0%
- By 2040
- 505,911 · +21.0%
- By 2050
- 567,522 · +35.8%
- By 2075
- 729,686 · +74.6%
- By 2100
- 847,087 · +102.6%
Race, ethnicity, and origin ACS 2023
- Neighborhood character
- Predominantly Hispanic (91%)
- Race & ethnicity
- Hispanic / Latino 91% Two or more races 48% Black 4% White 4%
- Hispanic origin (detail)
- Mexican 83%
- Foreign-born
- 18% · Canada
- Languages at home
- 52% English-only · Spanish 48%
Political lean MEDSL · Nueces
- 2024 margin
- R (+11.5) · D 43.8% · R 55.3%
- 2008→2024 swing
- -7.1pp toward R · 2008: -4.4pp · 2024: -11.5pp
- All cycles
- 2024: R+11.5 2020: R+2.9 2016: R+1.5 2012: R+3.2 2008: R+4.4
Not yet ingested
- Civics
- —
Market trends
- HPI YoY
- ▲ 1.42%
- Current HPI
- 113.2227
- Rent YoY
- —
- Metro
- Corpus Christi, TX
- State GDP YoY
- ▲ 3.95%
- F500 in state
- 110
Industry mix (Fortune 500 HQ in TX)
| Industry | F500 HQs | Revenue |
|---|---|---|
| Energy | 16 | $1,198B |
|
||
| Technology | 5 | $198B |
|
||
| Engineering / Construction | 4 | $72B |
|
||
| Energy Services | 3 | $60B |
|
||
| Utilities | 3 | $41B |
|
||
| Healthcare | 2 | $330B |
|
||
Price history
+320.0% since first listed22 events — show timeline
- 2026-05-05 Pending — CBMLS
- 2026-05-03 Listed $210,000 CBMLS
- 2026-04-30 Delisted — CBMLS
- 2026-04-29 Listed $210,000 CBMLS
- 2025-12-22 Sold (Public Records) — Public Records
- 2025-11-25 Sold (Public Records) — Public Records
- 2025-03-26 Sold (Public Records) — Public Records
- 2025-03-26 Sold (MLS) — CBMLS
- 2025-03-06 Pending — CBMLS
- 2025-02-27 Contingent — CBMLS
- 2025-02-20 Listed $35,000 CBMLS
- 2023-08-07 Delisted — CBMLS
- 2023-04-27 Price Changed $45,000 CBMLS
- 2023-02-06 Listed $50,000 CBMLS
- 2022-12-15 Sold (Public Records) — Public Records
- 2022-09-07 Delisted — CBMLS
- 2022-07-07 Listed $40,000 CBMLS
- 2022-04-27 Delisted — CBMLS
- 2022-03-28 Price Changed $49,000 CBMLS
- 2021-12-19 Price Changed $55,000 CBMLS
- 2021-12-15 Listed $50,000 CBMLS
- 1998-11-16 Sold (Public Records) — Public Records
Property tax history
+4.5%/yrLatest (2025): $893 · -18.4% YoY. Source: county tax records.
Cash-flow waterfall
monthlySold comps — $/sqft
last 12 mo · ≤1 miLoading sold comps…