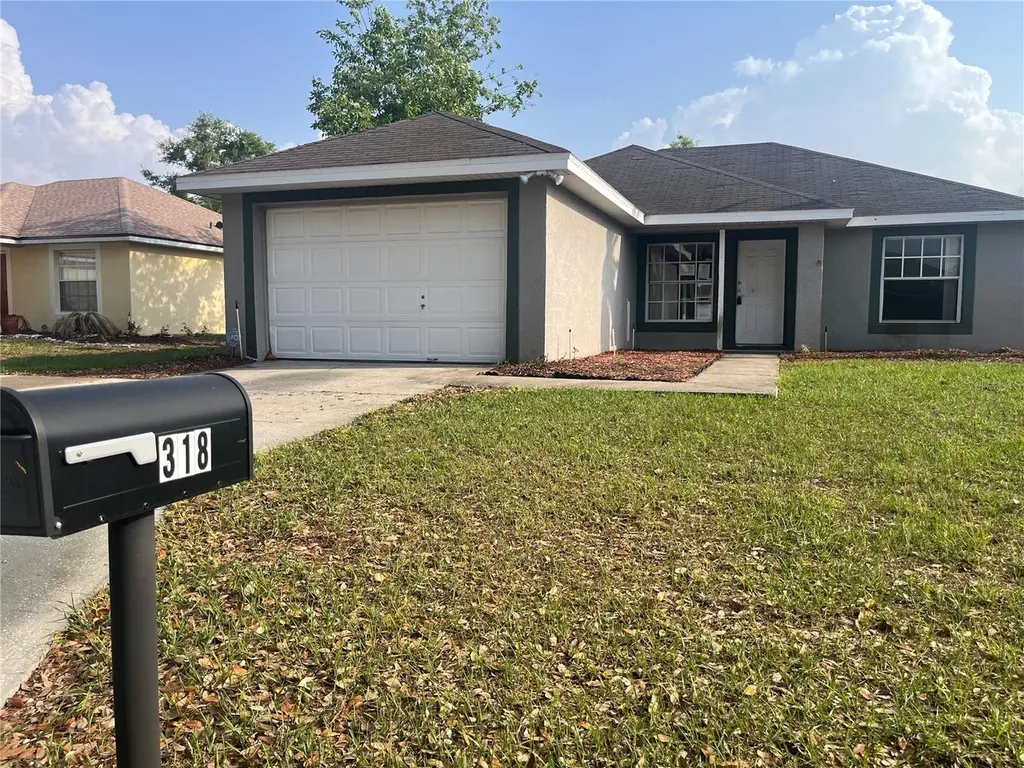
318 Walpole Loop · Four Corners, FL
Flood risk 1/10 · Minimal
- FEMA flood zone
- X (unshaded)
- Chance of flooding over 30 yrs
- 0.0%
- Est. flood insurance / yr
- $507 – $1,088
Fire risk 5/10 · Moderate
- Est. fire insurance / yr
- $947 – $1,759
Heat risk 8/10 · Major
- Hot days now (above 107°F)
- 7 days/yr
- Hot days in 30 yrs
- 24 days/yr
Wind risk 9/10 · Severe
- Chance of severe wind over 30 yrs
- 99.0%
Air-quality risk 1/10 · Minimal
- Unhealthy air days now
- 0 days/yr
- Unhealthy air days in 30 yrs
- 0 days/yr
Risk factors via First Street. Map © Google.
Why this score? — see what drove the D grade
The composite is a weighted blend of 9 inputs, each scored 0–100. Each bar is that input's sub-score; the figure is the points it added to the 100-point composite (weight × sub-score).
- Cash flow +12.3/30.0
- ARV discount +7.5/15.0
- Appreciation +4.7/10.0
- DSCR +3.6/10.0
- Schools +3.5/10.0
- Livability +3.5/5.0
- 1% rule +2.7/10.0
- Condition / age +2.5/5.0
- Rent growth +1.8/5.0
$264,900
🖨 Deal sheet (PDF) 📄 Offer letter ✓ Due diligence
Listing remarks
INGROUND POOL!!, Wow!! Freshly to this HOT market, Investor opportunity, or 1st time home buyer. A Unique opportunity to work on your next project and be added to your Investment portfolio. Do not miss out this great opportunity to own this 3-BEDROOM 2 BATH, Dining and living room combo. Property offers a large/spacious backyard with plenty of potential for your family and friends gathering or just enjoying your morning or evening strolls, and you can build your own oasis. This home is the perfect opportunity for a FIXER-UPPER that can generate income. Whether used as a primary residence, a short-term vacation rental or a long-term investment. Property is sold AS IS ONLY. Don't miss out on
Key facts
- Large backyard
- Inground pool
- Fixer-upper
Tags
Property features AI
Finance
- Other: Living area listed as 1,140 sq ft (public records); Building area total 1,514 sq ft (public records)
- HOA & community: Has HOA (Wellington Homeowners) — $561 annually ($46.75/month); Pets allowed
Exterior
- Parking: Attached garage (1 car)
- Utilities: Public water; Public sewer; Electricity available; Natural gas available
- Home design: Single family residence; One story; Faces south
- Construction: Stucco construction; Shingle roof; Slab foundation; Built on 0.15-acre lot
- Exterior features: Sidewalk; Sliding doors; In-ground private pool; Paved road access
Interior
- Kitchen: No appliances included
- Bedrooms: 3 bedrooms
- Flooring: Laminate flooring
- Bathrooms: 2 full bathrooms
- Heating & cooling: Central heating (electric); Central air conditioning
- Interior features: Ceiling fans
- Laundry & utility: No laundry features specified
Neighborhood map
What this means for you Summary
Snapshot
- This is a 3-bed/2.0-bath single-family listed at $265k.
Deal economics
- At list price, monthly cash flow is $-50 ($-598/yr) — negative.
- To cash-flow at today's rent, offer at most $256k (3.3% below list).
- To meet the 1% rule (rent ≥ 1% of price), the offer needs to be $203k (23.3% below list).
- Recommended offer: $203k (23.3% below list) — sets the bar for 1% rule.
- Cap rate 6.1% vs local median 3.2% in Four Corners — top-decile yield for the area; either an underpriced asset or a hidden risk that comps aren't pricing in. Stress-test before assuming the spread holds.
Location & tenants
- Location reads 69/100 on livability (#453 in FL) — a middle-class / working-renter tenant base. Strengths: housing A+, cost of living A-; Watch: amenities F, health & safety F.
- Polk (suburban): math 39% / reading 43% proficiency, ranked #62 of 73 in FL (top 85%) — families likely to look elsewhere, expect single-tenant / working-renter base with shorter leases.
- Zoned schools: Loughman Oaks Elementary School (math 36% / reading 36%, grade F, #1,670 of 2,144 statewide, top 78%, 1,052 students, 37% FRL); Lake Alfred Polytech Academy (math 41% / reading 43%, grade D-, #340 of 571 statewide, top 61%, 645 students, 59% FRL); Davenport High School (2,333 students, 37% FRL) — zoned schools average 44% FRL vs 60% district-wide (15 pts lower); this property's tenant base skews higher-income than the district average.
- Market conditions: Rents soft (-2.7%/yr); 648 active listings in the ZIP; 40 comparable units currently listed for rent nearby; rentals at typical pace (median 25d on market — plan ~3-4 weeks tenant-placement turnaround); 10,384 units permitted in Polk County in 2024 (1,716 in 5+ unit buildings).
- This rent runs 34% of the median local income ($71k/yr) — at the standard rent-burdened threshold; future hikes will face affordability resistance.
Forward outlook
- In year one you build about $217 of equity ($2k loan paydown + $-2k appreciation (-0.6% local appreciation)).
- Polk County population projected at +33% by 2050 — long-run rental-demand tailwind backs the buy-and-hold thesis.
Negotiation context
- It's been on market 44 days — a 3% lower offer ($257k) is reasonable based on typical stale-listing flexibility.
- Current owner paid $137k; list at $265k implies a 93% gain — meaningful room to come down on a strong offer.
Risks & watch-outs
- Climate carrying-cost: severe wind risk, 99% chance of damaging wind over 30y; moderate wildfire risk; extreme-heat days projected 7→24/yr by 2055 (HVAC capex compounding) — expect insurance premiums to compound above CPI over the hold.
Questions for the listing agent
- What do current leases actually rent for vs. the listed asking? Can we see a recent rent roll and the last 12 months of T-12 income?
- It's been on market 44 days. Have you received any prior offers? Is the seller open to a 23% concession, seller financing, or rate buy-down credit?
- What does the HOA fee cover, when was the last increase, and are there any pending special assessments or reserve-fund shortfalls?
- Is there a deadline driving the sale (1031 exchange, divorce, estate, relocation)? That informs how much negotiation room exists.
- Schools are F-rated, which usually means shorter tenancies and higher turnover. Who's the typical renter profile here, and what's been the actual vacancy rate?
- The area grade is low — what's the realistic commute time and amenity access for the typical tenant pool here? Any planned neighborhood developments (good or bad) we should know about?
- What's the average days-on-market for RENTAL listings here right now (not sales)? A rising rental-DOM trend means longer vacancies and softer asking-rent achievability than the comps imply.
- What's the recent tenant-quality profile in this submarket — average credit score on applications, eviction rate, late-payment / NSF rate, and stable-employment percentage? A property-management company in the area should have these aggregated.
- How much new for-sale + rental construction is in the pipeline within 1–3 miles? Heavy new supply typically softens prices + rents 12–24 months out; constrained supply supports both.
Investment metrics
- 1% rule
- 0.77% ✗
- Cap rate
- 6.07%
- Cash-on-cash
- -0.81%
- DSCR
- 0.96
- GRM
- 10.9
CMA / ARV
No comps found within radius.
Projected returns pro-forma
-0.61% appreciation · 0.0% rent growth · sell at horizon
- IRR
- -7.5%
- Equity multiple
- 0.67×
- Total profit
- $-24,447
- Equity at exit
- $68,949
- IRR
- -3.3%
- Equity multiple
- 0.70×
- Total profit
- $-22,187
- Equity at exit
- $76,760
Cash invested: $74,172 (down + closing). Projections, not guarantees.
Landlord ↔ Tenant lean methodology
- Overall (STATE)
- 87 Strongly Landlord-Friendly
- State Florida
- 87 Strongly Landlord-Friendly · R+3
- County
- — inherits STATE
- City
- — inherits STATE
ZIP-level market 33897
- Home prices YoY
- -0.3%
- Rents YoY
- -2.7%
- Active inventory
- 648
- Price-to-rent
- 10.9×
Monthly cashflow live
- Estimated rent
- $2,032 high interval (Pro) →
- Mortgage (P&I)
- −$1,389
- Tax from tax record
- −$110 /mo · $1,318/yr
- Insurance
- −$110
- HOA
- −$46
- Vacancy / Maint / Mgmt
- −$427
- Net cashflow
- $-50
Break-even live
Sensitivity live
| Price | -10% $100 | -5% $25 | +0% $-50 | +5% $-125 | +10% $-200 |
|---|---|---|---|---|---|
| Rent | -10% $-210 | -5% $-130 | +0% $-50 | +5% $30 | +10% $111 |
| Rate | -1.0pp $84 | -0.5pp $18 | base $-50 | +0.5pp $-118 | +1.0pp $-188 |
UW: 25.0% down · 7.5% · 30yr · 1.5% tax · 5.0% vac · 8.0% maint · 8.0% mgmt
Financing live
Cash to close
- Down payment
- $66,225
- Closing costs
- $7,947
- Reserves months
- —
- Total cash needed
- —
Loan-product check · same deal, 3 products live
Conventional
25% down · 7.5% · 30yr
- Down + closing
- —
- Monthly P&I
- —
- Monthly cashflow
- —
- DSCR
- —
- Eligible?
- —
Personal DTI + credit; lowest rate.
DSCR
20% down · 8.5% · 30yr
- Down + closing
- —
- Monthly P&I
- —
- Monthly cashflow
- —
- DSCR
- —
- Eligible?
- —
No personal income docs; deal must DSCR.
Hard money
10% down · 12.0% · 12mo
- Down + closing
- —
- Monthly P&I
- —
- Monthly cashflow
- —
- DSCR
- —
- Eligible?
- —
Short-term bridge; refi at stabilization.
Rent comps 40 comps
| Address | Beds | Baths | Sqft | Rent | $/sqft | DOM | Units | Dist |
|---|---|---|---|---|---|---|---|---|
| 1316 Mirabella Cir Davenport, FL | 3.0 | 2.5 | 1489 | $2,050 | $1.38 | 25d | 1 | 0.09mi |
| 1492 Mirabella Cir Davenport, FL | 3.0 | 2.5 | 1435 | $1,950 | $1.36 | 16d | 1 | 0.13mi |
| 1492 Mirabella Cir Davenport, FL | 3.0 | 2.0 | 1435 | $1,995 | $1.39 | 25d | 1 | 0.13mi |
| 1556 Mirabella Cir Davenport, FL | 3.0 | 2.5 | 1371 | $1,950 | $1.42 | 5d | 1 | 0.15mi |
| 904 Charo Pkwy #517 Davenport, FL | 3.0 | 3.0 | 1217 | $1,800 | $1.48 | 25d | 1 | 0.19mi |
| 904 Charo Pkwy #533 Davenport, FL | 4.0 | 3.0 | 1437 | $1,795 | $1.25 | 16d | 1 | 0.19mi |
| 333 Terra Lago St Unit 1031923P Davenport, FL | 3.0 | 3.0 | 1453 | $2,170 | $1.49 | 4d | 1 | 0.22mi |
| 1042 Calabria Ave Unit 1261192P Davenport, FL | 4.0 | 3.0 | 1485 | $5,169 | $3.48 | 16d | 1 | 0.24mi |
| 761 Caribbean Dr Davenport, FL | 3.0 | 2.0 | 1400 | $1,700 | $1.21 | 5d | 1 | 0.28mi |
| 564 Orchid Dr Unit A Davenport, FL | 2.0 | 2.0 | 1348 | $1,500 | $1.11 | 25d | 1 | 0.28mi |
| 711 Caribbean Dr Unit Main Unit Davenport, FL | 3.0 | 2.0 | 1200 | $1,850 | $1.54 | 25d | 1 | 0.30mi |
| 515 Orchid Dr Unit A Davenport, FL | 3.0 | 2.0 | 1348 | $1,650 | $1.22 | 25d | 1 | 0.31mi |
| 402 Orchid Dr Unit Main Davenport, FL | 3.0 | 2.0 | 1500 | $1,900 | $1.27 | 25d | 1 | 0.34mi |
| 536 Caribbean Dr Unit A Davenport, FL | 3.0 | 2.0 | 1420 | $1,650 | $1.16 | 25d | 1 | 0.34mi |
| 807 Chelsea Dr Davenport, FL | 2.0 | 2.5 | 1076 | $1,450 | $1.35 | 25d | 1 | 0.35mi |
| 237 Somerset Dr Davenport, FL | 2.0 | 1.0 | 1330 | $1,900 | $1.43 | 25d | 1 | 0.35mi |
| 332 Caribbean Dr Davenport, FL | 2.0 | 2.0 | 1200 | $1,650 | $1.38 | 25d | 1 | 0.35mi |
| 161 Coco Plum Dr Davenport, FL | 3.0 | 3.0 | 1364 | $1,850 | $1.36 | 25d | 1 | 0.36mi |
| 352 Caribbean Dr Unit MAIN Davenport, FL | 2.0 | 2.0 | 1000 | $1,750 | $1.75 | 25d | 1 | 0.36mi |
| 222 Bexley Dr Davenport, FL | 2.0 | 2.5 | 1313 | $2,000 | $1.52 | 25d | 1 | 0.37mi |
| 271 Caribbean Dr Unit Main Unit Davenport, FL | 3.0 | 2.0 | 1298 | $1,750 | $1.35 | 25d | 1 | 0.37mi |
| 405 Caribbean Dr Unit Main Davenport, FL | 2.0 | 2.0 | 1200 | $1,750 | $1.46 | 25d | 1 | 0.39mi |
| 774 Chelsea Dr Davenport, FL | 2.0 | 2.5 | 988 | $1,750 | $1.77 | 25d | 1 | 0.39mi |
| 183 Ashbourne Way Davenport, FL | 1.0–3.0 | 1.0–2.0 | 1039 | $2,200 | $2.12 | 5d | 35 | 0.42mi |
| 1301 Tuscan Hills Blvd Unit 9406 1 Davenport, FL | 2.0 | 2.0 | 1134 | $2,200 | $1.94 | 25d | 1 | 0.48mi |
| 2010 Limetta DR Davenport, FL | 1.0–3.0 | 1.0–2.0 | 1178 | $2,429 | $2.06 | 5d | 15 | 0.85mi |
| 515 Corso Ln Davenport, FL | 2.0–3.0 | 2.5 | 1402 | $2,495 | $1.78 | 5d | 13 | 0.95mi |
| 226 Hillcrest Dr Davenport, FL | 4.0 | 2.0 | 1488 | $2,500 | $1.68 | 25d | 1 | 0.97mi |
| 3010 Swinley BLVD Davenport, FL | 1.0–3.0 | 1.0–2.0 | 1178 | $2,230 | $1.89 | 4d | 30 | 0.98mi |
| 50989 Highway 27 #108 Davenport, FL | 2.0 | 1.0 | 800 | $1,500 | $1.88 | 23d | 1 | 1.08mi |
| 309 Catfish Dr E Davenport, FL | 3.0 | 2.0 | 1454 | $1,895 | $1.30 | 25d | 1 | 1.11mi |
| 304 New Providence Promenade Unit 304 Davenport, FL | 3.0 | 2.0 | 1227 | $1,495 | $1.22 | 25d | 1 | 1.11mi |
| 603 New Providence Promenade #603 Davenport, FL | 3.0 | 2.0 | 1227 | $1,550 | $1.26 | 25d | 1 | 1.18mi |
| 631 Washington Palm Loop Davenport, FL | 3.0 | 2.0 | 1387 | $1,450 | $1.05 | 25d | 1 | 1.21mi |
| 2929 Fan Palm Dr Davenport, FL | 3.0 | 3.0 | 1090 | $1,600 | $1.47 | 16d | 1 | 1.30mi |
| 2929 Fan Palm Dr Unit 1 Davenport, FL | 3.0 | 2.5 | 1090 | $1,600 | $1.47 | 16d | 1 | 1.30mi |
| 2918 Fan Palm Dr Unit Main Davenport, FL | 3.0 | 2.0 | 1400 | $1,800 | $1.29 | 25d | 1 | 1.31mi |
| 217 Australian Way Unit A Davenport, FL | 3.0 | 2.0 | 1211 | $1,750 | $1.45 | 4d | 1 | 1.32mi |
| 400 Australian Way Unit A Davenport, FL | 3.0 | 2.0 | 1350 | $1,600 | $1.19 | 16d | 1 | 1.36mi |
| 315 Allison Ave Davenport, FL | 3.0 | 2.0 | 1180 | $2,400 | $2.03 | 25d | 1 | 1.38mi |
HOA detail
- Monthly dues
- $46 · $552/yr
- Likely covers
- pool
Listing history 6 events
-
2026-05-07status Pending
-
2026-04-27price $264,900
-
2026-03-24$274,900 Active
-
2004-05-18soldstatus $137,000
-
1999-05-04soldstatus $100,000
-
1999-05-04soldstatus $100,000
ⓘ Source: listings_history table (triggers on properties + properties_extension) + one-shot
backfill from property_details.listing_events for pre-trigger history.
Tax reassessment forecast FL · Resets to sale price
- Current annual tax
- $1,318 · $110/mo
- Projected year-2 tax
- $2,199 · $183/mo
- Expected delta
- +$881/yr (+$73/mo · 66.8%)
ⓘ Screening estimate from a state-policy table — verify with the county assessor before closing.
Climate risk First Street
- Flood 1/10 Low FEMA zone X (unshaded) · 0% chance over 30 yrs
- Wildfire 5/10 Major
- Heat 8/10 Severe 7 d/yr ≥107°F today · 24 d/yr by 30 yrs out
- Wind 9/10 Extreme 99% chance of damaging wind over 30 yrs
- Air quality 1/10 Low 0 unhealthy d/yr today · 0 by 30 yrs out
Nearby sold comps map
Loading sold comps map…
Walkable amenities ~0.75 mi
Loading nearby amenities…
Taxation est. · year 1
- Rental income
- $24,388
- − Mortgage interest
- −$14,839
- − Property taxes
- −$1,318
- − Insurance
- −$1,324
- − Repairs & maintenance
- −$1,951
- − Management
- −$1,951
- − HOA
- −$552
- − Depreciation
- −$7,706
- Taxable loss
- −$5,253
- Est. tax savings @ 24.0%
- +$1,261
- After-tax cash flow
- $663/yr
For passive investors: Depreciation is non-cash, so a rental often shows a tax loss while cash-flowing — sheltering income. Rental losses are passive: they offset passive income freely, and up to $25,000/yr can offset ordinary (W-2) income if you actively participate and your MAGI is under $100k (phasing out to $0 by $150k); unused losses carry forward. On sale, claimed depreciation is recaptured at up to 25%, and gains may owe capital-gains tax (a 1031 exchange can defer both). Figures are a year-1 estimate at your 24.0% rate — not tax advice; consult a CPA.
Schools (NCES district)
- District
- Polk
- NCES district ID
- 1201590
- Math proficiency
- 39% ▼ -11.00%
- Reading proficiency
- 43% ▼ -4.00%
- Median HH income
- $43,979
- Composite
- 34.74/100
- National rank
- #5132
- State rank
- #62 of 73 in FL
Livability — Four Corners
- Score
- 69/100
- State rank
- #453
- US rank
- #8218
Category grades
Schools grade is shown separately in the Schools card above.
Census & demographics
- County
- Polk County · 740,051 people
- City population
- 27,422
- Metro
- Lakeland-Winter Haven, FL
- Population (ZIP)
- 30,159
- Household income
- $70,982
- Rent vs Own
- Severe rent burden
- 926.0
Population outlook (Polk County) Hauer SSP2
- Today (2025)
- 752,975 people
- By 2030
- 804,621 · +6.9%
- By 2040
- 906,117 · +20.3%
- By 2050
- 1,000,476 · +32.9%
- By 2075
- 1,197,520 · +59.0%
- By 2100
- 1,271,518 · +68.9%
Race, ethnicity, and origin ACS 2023
- Neighborhood character
- Diverse neighborhood (Simpson 0.61)
- Race & ethnicity
- White 45% Hispanic / Latino 43% Two or more races 12% Black 5% Asian 2%
- Hispanic origin (detail)
- Mexican 2% Puerto Rican 21% Cuban 2% Dominican 2%
- Common ancestry
- Romanian 2% Lithuanian 2% Serbian 1%
- Foreign-born
- 16% · Canada, Jamaica, China
- Languages at home
- 61% English-only · Spanish 34% Other Indo-European 1% French/Haitian/Cajun 1%
Political lean MEDSL · Polk
- 2024 margin
- Strong R (+20.7) · D 39.2% · R 59.9%
- 2008→2024 swing
- -14.6pp toward R · 2008: -6.1pp · 2024: -20.7pp
- All cycles
- 2024: R+20.7 2020: R+14.4 2016: R+14.1 2012: R+6.8 2008: R+6.1
Not yet ingested
- Civics
- —
Market trends
- HPI YoY
- ▼ -0.61%
- Current HPI
- 236.2905
- Rent YoY
- ▼ -2.69%
- Metro
- Lakeland-Winter Haven, FL
- State GDP YoY
- ▲ 3.28%
- F500 in state
- 36
Industry mix (Fortune 500 HQ in FL)
| Industry | F500 HQs | Revenue |
|---|---|---|
| Industrial Technology | 2 | $29B |
|
||
| Insurance | 2 | $17B |
|
||
| Retail | 1 | $60B |
|
||
| Technology Distribution | 1 | $58B |
|
||
| Homebuilding | 1 | $35B |
|
||
| Technology Manufacturing | 1 | $35B |
|
||
Price history
+164.9% since first listed6 events — show timeline
- 2026-05-07 Pending — Stellar MLS as Distributed by MLS Grid
- 2026-04-27 Price Changed $264,900 Stellar MLS as Distributed by MLS Grid
- 2026-03-24 Listed $274,900 Stellar MLS as Distributed by MLS Grid
- 2004-05-18 Sold (Public Records) $137,000 Public Records
- 1999-05-04 Sold (Public Records) $100,000 Public Records
- 1999-05-04 Sold (Public Records) $100,000 Public Records
Property tax history
+7.8%/yrLatest (2025): $1,318 · +12.7% YoY. Source: county tax records.
Cash-flow waterfall
monthlySold comps — $/sqft
last 12 mo · ≤1 miLoading sold comps…