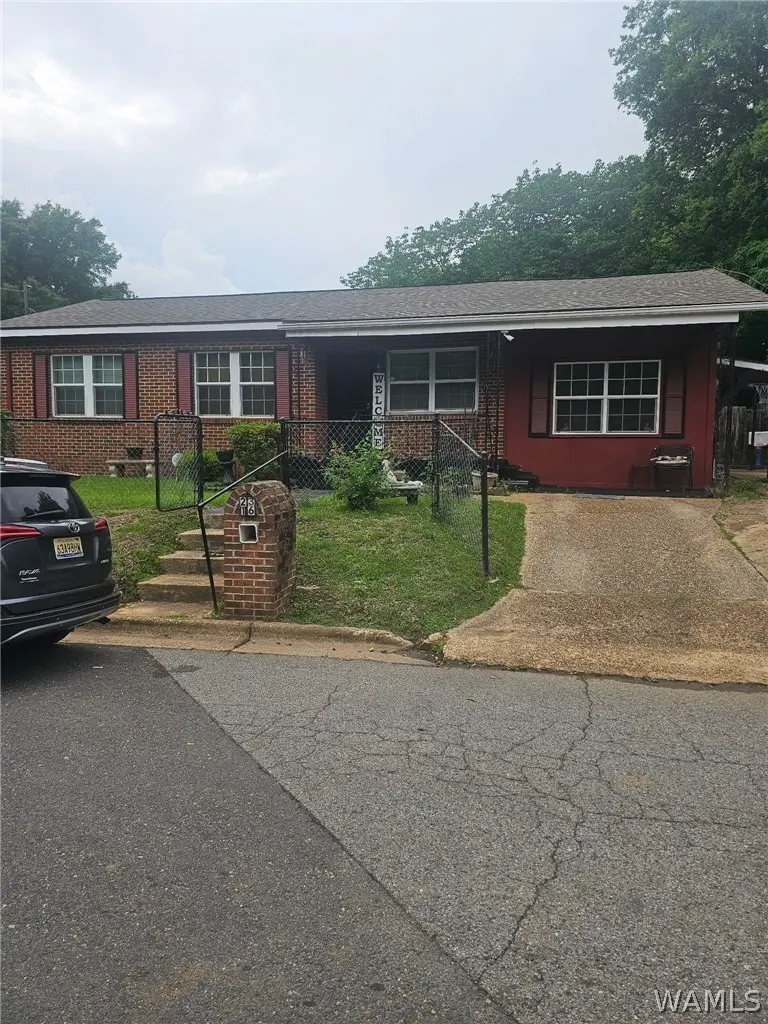
2316 TY Rogers JR Blvd Ave · Tuscaloosa, AL
Flood risk 1/10 · Minimal
- FEMA flood zone
- X (unshaded)
- Chance of flooding over 30 yrs
- 0.0%
- Est. flood insurance / yr
- $507 – $1,088
Fire risk 3/10 · Minor
- Est. fire insurance / yr
- $916 – $1,700
Heat risk 7/10 · Major
- Hot days now (above 109°F)
- 7 days/yr
- Hot days in 30 yrs
- 20 days/yr
Wind risk 6/10 · Moderate
- Chance of severe wind over 30 yrs
- 59.0%
Air-quality risk 1/10 · Minimal
- Unhealthy air days now
- 0 days/yr
- Unhealthy air days in 30 yrs
- 0 days/yr
Risk factors via First Street. Map © Google.
Why this score? — see what drove the B+ grade
The composite is a weighted blend of 9 inputs, each scored 0–100. Each bar is that input's sub-score; the figure is the points it added to the 100-point composite (weight × sub-score).
- Cash flow +29.6/30.0
- ARV discount +15.0/15.0
- DSCR +10.0/10.0
- 1% rule +8.3/10.0
- Rent growth +4.1/5.0
- Livability +3.9/5.0
- Schools +2.5/10.0
- Condition / age +2.5/5.0
- Appreciation +0.0/10.0
$95,000
🖨 Deal sheet 📄 Offer letter ✓ Due diligence
Listing remarks
1ST TIME HOMEBUYERS, DON'T MISS THIS CHANCE TO OWN THIS CHARMING, ALL BRICK HOME. NEW WINDOWS, 3 BEDROOMS, 1 BATH, LIVING ROOM, BREAKFAST NOOK, AND DEN. CORNER LOT, PLENTY OF SHADE TREES, AND FRUIT TREES. DETACHED CARPORT. THIS HOME IS TOTALLY ELECTRIC. TERMITE BOND. ROOF LESS THAN 10 YEARS, HEATING AND COOLING UNIT LESS THAN 5 YEARS OLD.
Key facts
- Detached carport
- All brick home
- Fruit trees
Tags
Property features AI
Exterior
- Parking: Concrete driveway
- Utilities: Public water; Cable available; Sewer connected
- Home design: Single family residence; One story
- Construction: Brick veneer construction; Composition shingle roof; Crawl space foundation; Built in — (year not provided)
- Exterior features: Shed(s)
Interior
- Kitchen: Electric oven; Electric range; Refrigerator
- Bathrooms: 1 full bathroom
- Heating & cooling: Central electric heating; Electric cooling; Ceiling fan(s)
- Interior features: Ceiling fan(s)
- Laundry & utility: Laundry room; Electric water heater; Water heater
Neighborhood map
What this means for you Summary
Snapshot
- This is a 3-bed/1.0-bath single-family listed at $95k.
Deal economics
- At list price, monthly cash flow is $342 ($4k/yr) — positive.
- The deal already cash-flows at list — no discount required.
- Meets the 1% rule at list price ($1k rent vs $95k).
- Recommended offer: $92k (3.0% below list) — sets the bar for market timing.
- Cap rate 10.6% vs local median 3.4% in Tuscaloosa — top-decile yield for the area; either an underpriced asset or a hidden risk that comps aren't pricing in. Stress-test before assuming the spread holds.
Location & tenants
- Location reads 77/100 on livability (#9 in AL, #2,909 nationally) — a middle-class / working-renter tenant base. Strengths: amenities A+, health & safety A+, cost of living A; Watch: crime F, employment D-.
- Tuscaloosa City (urban): math 19% / reading 40% proficiency, ranked #74 of 129 in AL (top 57%) — low school quality limits family demand, transient renter base, plan for 1-2y turnover.
- Zoned schools: Westlawn Middle School (math 0% / reading 18%, grade F, #235 of 257 statewide, top 93%, 534 students, 93% FRL); Central High School (math 12% / reading 17%, grade F, #220 of 305 statewide, top 77%, 783 students, 84% FRL) — zoned schools average 88% FRL vs 59% district-wide (29 pts higher); higher-poverty schools than district average — tighter screening recommended.
- Zoned-school proficiency averages 12% at this address vs 30% district-wide (-18 pts) — the specific schools serving this property underperform the Tuscaloosa City average; the district grade overstates school quality for this exact location.
- Market conditions: Rents rising fast (+6.3%/yr); 306 active listings in the ZIP; 22 comparable units currently listed for rent nearby; rentals lingering (median 44d on market — plan ~5-8 weeks vacancy on turnover, expect pricing pressure); 64% of comp listings sitting > 30 days — soft ceiling on asking rent; lower-income renter base — watch delinquency; 622 units permitted in Tuscaloosa County in 2024 (69 in 5+ unit buildings).
- At $1,264/mo this rent would consume 52% of the median local household income ($29k/yr) (locally 3997% of renters already pay >50% of income on rent) — very limited rent-growth headroom before tenants either downsize or default.
Forward outlook
- Local home prices are declining (-3.0%/yr); year-one equity from $657 of loan paydown is wiped out by about $3k of value loss. Plan a longer hold.
- Tuscaloosa County population projected at +26% by 2050 — long-run rental-demand tailwind backs the buy-and-hold thesis.
- At projected returns (-3.0% appreciation + 6.3% rent growth), your $27k cash investment doubles in ~7 years — after that, you're playing with house money.
Negotiation context
- It's been on market 48 days — a 3% lower offer ($92k) is reasonable based on typical stale-listing flexibility.
Risks & watch-outs
- Climate carrying-cost: major wind risk, 59% chance of damaging wind over 30y; extreme-heat days projected 7→20/yr by 2055 (HVAC capex compounding) — expect insurance premiums to compound above CPI over the hold.
Questions for the listing agent
- It's been on market 48 days. Have you received any prior offers? Is the seller open to a 3% concession, seller financing, or rate buy-down credit?
- Built in 1964 — when were the roof, HVAC, electrical panel, plumbing, and water heater last replaced?
- Is there a deadline driving the sale (1031 exchange, divorce, estate, relocation)? That informs how much negotiation room exists.
- Crime grade is F in this area — have there been break-ins, vandalism, or insurance claims at this property in the last 3 years? What carrier currently insures it and at what premium?
- What's the average days-on-market for RENTAL listings here right now (not sales)? A rising rental-DOM trend means longer vacancies and softer asking-rent achievability than the comps imply.
- What's the recent tenant-quality profile in this submarket — average credit score on applications, eviction rate, late-payment / NSF rate, and stable-employment percentage? A property-management company in the area should have these aggregated.
- How much new for-sale + rental construction is in the pipeline within 1–3 miles? Heavy new supply typically softens prices + rents 12–24 months out; constrained supply supports both.
Investment metrics
- 1% rule
- 1.33% ✓
- Cap rate
- 10.62%
- Cash-on-cash
- 15.45%
- DSCR
- 1.69
- GRM
- 6.3
CMA / ARV
- ARV (median comp)
- $131,258
- List price
- $95,000
- Delta
- -27.62%
- Verdict
- UNDERPRICED
- Comps
- 20 within 1.0 mi
Show comp detail 12 sales within ~0.75 mi
| Address | Dist | Beds/Ba | Sqft | Sold | Price | $/sf | Match |
|---|---|---|---|---|---|---|---|
| 2717 23rd St | 0.05mi | 4/2.5 (+1) | 1,288 (+8%) | 1mo | $135,000 | $105 | 72 |
| 2816 26th St | 0.15mi | 3/2.0 | 1,297 (+9%) | 3mo | $182,000 | $140 | 71 |
| 2687 23rd St | 0.07mi | 3/2.0 | 1,271 (+7%) | 14mo | $135,900 | $107 | 70 |
| 2832 26th St | 0.19mi | 3/1.0 | 1,120 (-6%) | 16mo | $125,900 | $112 | 68 |
| 3009 Short 19th | 0.39mi | 3/1.5 | 1,145 (-4%) | 8mo | $66,122 | $58 | 67 |
| 2622 20th St | 0.36mi | 2/2.0 (-1) | 1,164 (-2%) | 8mo | $40,900 | $35 | 64 |
| 2409 Ty Rogers Jr Ave | 0.05mi | 3/1.0 | 1,050 (-12%) | 18mo | $110,000 | $105 | 63 |
| 2816 21st St | 0.23mi | 3/1.0 | 1,288 (+8%) | 18mo | $110,000 | $85 | 60 |
| 1707 28th Ave | 0.45mi | 4/2.0 (+1) | 1,260 (+6%) | 9mo | $189,900 | $151 | 52 |
| 3018 20th St | 0.39mi | 2/1.0 (-1) | 1,062 (-10%) | 10mo | $60,000 | $56 | 51 |
| 1211 Ty Rogers Jr Ave Ave | 0.74mi | 3/2.5 | 1,326 (+12%) | 4mo | $112,300 | $85 | 37 |
| 3207 16th St | 0.74mi | 3/2.0 | 1,316 (+11%) | 16mo | $120,000 | $91 | 30 |
Match score weights: distance 35% · size 25% · config 20% · recency 20%. Top-matched comps best support the ARV.
Projected returns pro-forma
-3.0% appreciation · 6.29% rent growth · sell at horizon
- IRR
- 9.9%
- Equity multiple
- 1.40×
- Total profit
- $10,756
- Equity at exit
- $14,165
- IRR
- 21.6%
- Equity multiple
- 3.12×
- Total profit
- $56,508
- Equity at exit
- $8,214
Cash invested: $26,600 (down + closing). Projections, not guarantees.
Landlord ↔ Tenant lean methodology
- Overall (STATE)
- 90 Strongly Landlord-Friendly
- State Alabama
- 90 Strongly Landlord-Friendly · R+15
- County
- — inherits STATE
- City
- — inherits STATE
ZIP-level market 35401
- Rents YoY
- 6.3%
- Active inventory
- 306
- Price-to-rent
- 6.3×
Monthly cashflow live
- Estimated rent
- $1,264 high interval (Pro) →
- Mortgage (P&I)
- −$498
- Tax est. 1.5%
- −$119 /mo · $1,425/yr
- Insurance
- −$40
- HOA
- −$0
- Vacancy / Maint / Mgmt
- −$266
- Net cashflow
- $342
Break-even live
UW: 25.0% down · 7.5% · 30yr · 1.5% tax · 5.0% vac · 8.0% maint · 8.0% mgmt
Financing live
Cash to close
- Down payment
- $23,750
- Closing costs
- $2,850
- Reserves months
- —
- Total cash needed
- —
Loan-product check · same deal, 3 products live
Conventional
25% down · 7.5% · 30yr
- Down + closing
- —
- Monthly P&I
- —
- Monthly cashflow
- —
- DSCR
- —
- Eligible?
- —
Personal DTI + credit; lowest rate.
DSCR
20% down · 8.5% · 30yr
- Down + closing
- —
- Monthly P&I
- —
- Monthly cashflow
- —
- DSCR
- —
- Eligible?
- —
No personal income docs; deal must DSCR.
Hard money
10% down · 12.0% · 12mo
- Down + closing
- —
- Monthly P&I
- —
- Monthly cashflow
- —
- DSCR
- —
- Eligible?
- —
Short-term bridge; refi at stabilization.
Rent comps 22 comps
| Address | Beds | Baths | Sqft | Rent | $/sqft | DOM | Units | Dist |
|---|---|---|---|---|---|---|---|---|
| 2712 22nd St Tuscaloosa, AL | 4.0 | 2.0 | 1008 | $1,000 | $0.99 | 44d | 1 | 0.11mi |
| 2683 21st St Tuscaloosa, AL | 3.0 | 1.0 | 1324 | $895 | $0.68 | 21d | 1 | 0.16mi |
| 2825 25th St Tuscaloosa, AL | 2.0 | 1.0 | 708 | $835 | $1.18 | 44d | 1 | 0.16mi |
| 2720 21st St Tuscaloosa, AL | 4.0 | 1.0 | 1148 | $1,100 | $0.96 | 21d | 1 | 0.19mi |
| 3524 20th St Tuscaloosa, AL | 3.0 | 1.0 | 1050 | $1,100 | $1.05 | 44d | 1 | 0.76mi |
| 3560 21st St Tuscaloosa, AL | 3.0 | 2.0 | 1230 | $1,570 | $1.28 | 21d | 1 | 0.77mi |
| 1505 18th St Tuscaloosa, AL | 2.0 | 2.0 | 700 | $1,000 | $1.43 | 44d | 1 | 0.79mi |
| 2405 Herman Ave Tuscaloosa, AL | 4.0 | 1.0 | 971 | $1,100 | $1.13 | 44d | 1 | 0.80mi |
| 3316 16th St Tuscaloosa, AL | 3.0 | 1.0 | 1120 | $1,100 | $0.98 | 13d | 1 | 0.85mi |
| 13 Meadowlawn Tuscaloosa, AL | 3.0 | 1.5 | 1260 | $1,100 | $0.87 | 44d | 1 | 0.96mi |
| 3416 36th Ct Tuscaloosa, AL | 3.0 | 2.0 | 1206 | $1,395 | $1.16 | 44d | 1 | 1.06mi |
| 3008 7th St Tuscaloosa, AL | 2.0 | 1.0 | 840 | $900 | $1.07 | 44d | 1 | 1.07mi |
| 2209 9th St #401 Tuscaloosa, AL | 2.0 | 2.0 | 1304 | $1,650 | $1.27 | 44d | 1 | 1.09mi |
| 711 36th Ave Tuscaloosa, AL | 2.0 | 1.0 | 920 | $900 | $0.98 | 13d | 1 | 1.18mi |
| 900 Hargrove Rd Tuscaloosa, AL | 1.0–2.0 | 1.0–2.0 | 836 | $1,089 | $1.30 | 44d | 1 | 1.20mi |
| 1805 8th Ave Tuscaloosa, AL | 1.0–2.0 | 1.0–2.0 | 1175 | $1,380 | $1.17 | 44d | 1 | 1.36mi |
| 1925 8th Ave Tuscaloosa, AL | 1.0–2.0 | 1.0 | 794 | $1,054 | $1.33 | 13d | 1 | 1.36mi |
| 1510 9th St #113 Tuscaloosa, AL | 2.0 | 2.0 | 1025 | $1,625 | $1.59 | 21d | 1 | 1.38mi |
| 917 Homewood Dr Tuscaloosa, AL | 3.0 | 3.0 | 1500 | $3,600 | $2.40 | 44d | 1 | 1.39mi |
| 3809 Millcreek Ln Tuscaloosa, AL | 3.0 | 1.5 | 1289 | $1,395 | $1.08 | 44d | 1 | 1.41mi |
| 4342 Tari St Tuscaloosa, AL | 3.0 | 2.0 | 1340 | $1,750 | $1.31 | 44d | 1 | 1.47mi |
| 1915 6th Ave Tuscaloosa, AL | 2.0 | 2.5 | 1290 | $1,195 | $0.93 | 21d | 1 | 1.49mi |
Listing history 17 events
-
2026-06-18days on market $95,000 Active 48 DOM
-
2026-06-17days on market $95,000 Active 47 DOM
-
2026-06-16pricedays on market $95,000 Active 46 DOM
-
2026-06-15days on market $104,000 Active 45 DOM
-
2026-06-14days on market $104,000 Active 43 DOM
-
2026-06-13days on market $104,000 Active 42 DOM
-
2026-06-10days on market $104,000 Active 40 DOM
-
2026-06-09days on market $104,000 Active 39 DOM
-
2026-06-08days on market $104,000 Active 38 DOM
-
2026-06-07days on market $104,000 Active 37 DOM
-
2026-06-05days on market $104,000 Active 34 DOM
-
2026-06-03days on market $104,000 Active 33 DOM
-
2026-06-02days on market $104,000 Active 32 DOM
-
2026-06-01days on market $104,000 Active 31 DOM
-
2026-05-31days on market $104,000 Active 30 DOM
-
2026-05-30pricedays on market $104,000 Active 29 DOM
-
2026-05-01$109,000 Active 341-char remark
ⓘ Source: listings_history table (triggers on properties + properties_extension) + one-shot
backfill from property_details.listing_events for pre-trigger history.
Climate risk First Street
- Flood 1/10 Low FEMA zone X (unshaded) · 0% chance over 30 yrs
- Wildfire 3/10 Moderate
- Heat 7/10 Severe 7 d/yr ≥109°F today · 20 d/yr by 30 yrs out
- Wind 6/10 Major 59% chance of damaging wind over 30 yrs
- Air quality 1/10 Low 0 unhealthy d/yr today · 0 by 30 yrs out
Nearby sold comps map
Loading sold comps map…
Walkable amenities ~0.75 mi
Loading nearby amenities…
Taxation est. · year 1
- Rental income
- $15,173
- − Mortgage interest
- −$5,321
- − Property taxes
- −$1,425
- − Insurance
- −$475
- − Repairs & maintenance
- −$1,214
- − Management
- −$1,214
- − Depreciation
- −$2,764
- Taxable income
- $2,761
- Est. tax owed @ 24.0%
- −$663
- After-tax cash flow
- $3,446/yr
For passive investors: Depreciation is non-cash, so a rental often shows a tax loss while cash-flowing — sheltering income. Rental losses are passive: they offset passive income freely, and up to $25,000/yr can offset ordinary (W-2) income if you actively participate and your MAGI is under $100k (phasing out to $0 by $150k); unused losses carry forward. On sale, claimed depreciation is recaptured at up to 25%, and gains may owe capital-gains tax (a 1031 exchange can defer both). Figures are a year-1 estimate at your 24.0% rate — not tax advice; consult a CPA.
Schools (NCES district)
- District
- Tuscaloosa City
- NCES district ID
- 0103360
- Math proficiency
- 19% ▼ -24.00%
- Reading proficiency
- 40% ▼ -1.00%
- Median HH income
- $37,474
- Composite
- 24.51/100
- National rank
- #7647
- State rank
- #74 of 129 in AL
Livability — Tuscaloosa
- Score
- 77/100
- State rank
- #9
- US rank
- #2909
Category grades
Schools grade is shown separately in the Schools card above.
Census & demographics
- Census place
- Tuscaloosa, AL
- County
- Tuscaloosa County · 206,491 people
- City population
- 134,228
- Metro
- Tuscaloosa, AL
- Population (ZIP)
- 43,459
- Household income
- $29,152
- Rent vs Own
- Severe rent burden
- 3997.0
Population outlook (Tuscaloosa County) Hauer SSP2
- Today (2025)
- 228,293 people
- By 2030
- 240,551 · +5.4%
- By 2040
- 263,856 · +15.6%
- By 2050
- 286,491 · +25.5%
- By 2075
- 335,783 · +47.1%
- By 2100
- 370,520 · +62.3%
Race, ethnicity, and origin ACS 2023
- Neighborhood character
- Diverse neighborhood (Simpson 0.58)
- Race & ethnicity
- Black 47% White 44% Hispanic / Latino 5% Two or more races 4% Asian 2%
- Common ancestry
- Slovak 2% Italian 1% Romanian 1%
- Foreign-born
- 3% · Canada, China
- Languages at home
- 96% English-only · Spanish 2% Other Indo-European 1% Chinese 1%
Political lean MEDSL · Tuscaloosa
- 2024 margin
- Strong R (+20.4) · D 39.4% · R 59.8%
- 2008→2024 swing
- -4.4pp toward R · 2008: -16.0pp · 2024: -20.4pp
- All cycles
- 2024: R+20.4 2020: R+14.8 2016: R+19.5 2012: R+17.4 2008: R+16.0
Not yet ingested
- Civics
- —
Market trends
- HPI YoY
- ▼ -191.40%
- Current HPI
- 179.8335
- Rent YoY
- ▲ 6.29%
- Metro
- Tuscaloosa, AL
- State GDP YoY
- ▲ 2.94%
- F500 in state
- 4
Industry mix (Fortune 500 HQ in AL)
| Industry | F500 HQs | Revenue |
|---|---|---|
| Financial Services | 1 | $8B |
|
||
| Healthcare | 1 | $5B |
|
||
Price history
-12.8% since first listed3 events — show timeline
- 2026-06-16 Price Changed $95,000 WAMLS
- 2026-05-30 Price Changed $104,000 WAMLS
- 2026-05-01 Listed $109,000 WAMLS
Property tax history
-1.5%/yrLatest (2018): $161 · -5.4% YoY. Source: county tax records.
Cash-flow waterfall
monthlySold comps — $/sqft
last 12 mo · ≤1 miLoading sold comps…