 Multi-family
121464 U.s. 101 None · Orick, CA
Flood risk No data
- FEMA flood zone
- —
- Chance of flooding over 30 yrs
- —
- Est. flood insurance / yr
- —
Fire risk No data
- Est. fire insurance / yr
- —
Heat risk No data
- Hot days now (above threshold)
- —
- Hot days in 30 yrs
- —
Wind risk No data
- Chance of severe wind over 30 yrs
- —
Air-quality risk No data
- Unhealthy air days now
- —
- Unhealthy air days in 30 yrs
- —
Risk factors via First Street. Map © Google.
Why this score? — see what drove the B- grade
The composite is a weighted blend of 9 inputs, each scored 0–100. Each bar is that input's sub-score; the figure is the points it added to the 100-point composite (weight × sub-score).
- Cash flow +30.0/30.0
- 1% rule +10.0/10.0
- DSCR +10.0/10.0
- ARV discount +7.5/15.0
- Appreciation +5.0/10.0
- Livability +2.6/5.0
- Rent growth +2.5/5.0
- Condition / age +1.0/5.0
- Schools +0.4/10.0
$210,000
🖨 Deal sheet (PDF) 📄 Offer letter ✓ Due diligence
Multi-family units
County records classify this as Multi-Family (5+ Unit). Listing-text estimate: 1 unit. estimate disagrees with records
5+ unit building — per-unit beds/baths from public records are typically unavailable; the breakdown below (if shown) is an estimate from the listing text.
Listing remarks
Income potential! The house is a 3 bedroom, 1 1/2 bath with a good size kitchen and living room. The commercial building is configured to be a five unit apartment building and has a roof that is only 4 years old. The potential is here for a steady cash flow.
Key facts
- Good size kitchen
- 0.23 acre lot
- Built 1952
Tags
Property features AI
Finance
- Other: Zoning listed as commercial
Exterior
- Utilities: Public water; Private sewer
- Home design: Single-family residence; One level
- Construction: Frame construction; Block foundation; Shingle roof; Built on approximately 0.23-acre irregular lot
- Exterior features: Partial fencing; Gravel road access
Interior
- Heating & cooling: Baseboard heating
- Interior features: Total of 5 rooms; Baseboard heating
Neighborhood map
What this means for you Summary
Snapshot
- This is a 3-bed/?-bath multifamily listed at $210k. Condition is rated poor.
Deal economics
- At list price, monthly cash flow is $3k ($35k/yr) — positive.
- The deal already cash-flows at list — no discount required.
- Meets the 1% rule at list price ($6k rent vs $210k).
- Recommended offer: $207k (1.5% below list) — sets the bar for market timing.
Location & tenants
- Location reads 52/100 on livability (#1,002 in CA) — a working-class tenant base; expect higher turnover. Watch: cost of living C-, health & safety C-, crime F.
- Orick Elementary (rural): math 0% / reading 0% proficiency, ranked #1,389 of 1,400 in CA (top 99%) — low school quality limits family demand, transient renter base, plan for 1-2y turnover; 78% free/reduced lunch — lower-income household profile, screen leases tightly.
- Zoned schools: Orick Elementary (math 10% / reading 50%, 10 students, 100% FRL); Mckinleyville High (math 10% / reading 50%, grade F, #723 of 1,170 statewide, top 64%, 556 students, 51% FRL) — zoned schools at 75% FRL track the district average.
- Zoned-school proficiency averages 30% at this address vs 0% district-wide (+30 pts) — the actual schools serving this property are materially stronger than the Orick Elementary average implies; a family-tenant draw the district grade alone would hide.
- Market conditions: 4 active listings in the ZIP; 188 units permitted in Humboldt County in 2024 (17 in 5+ unit buildings).
Forward outlook
- In year one you build about $8k of equity ($1k loan paydown + $6k appreciation (3.0% local appreciation)).
- Humboldt County population projected to shrink 4% by 2050 — rents likely to lag national; underwrite the cash flow, not the appreciation.
- At projected returns (3.0% appreciation + 3.0% rent growth), your $59k cash investment doubles in ~2 years — after that, you're playing with house money.
- By year 5, paydown + projected appreciation supports a ~$34k cash-out refi (75% LTV) — recoverable capital for the next deal without selling this one.
Negotiation context
- It's been on market 21 days — a 2% lower offer ($207k) is reasonable based on typical stale-listing flexibility.
Risks & watch-outs
- Watch-outs: built in 1952 — expect roof / HVAC / electrical / plumbing capex.
Questions for the listing agent
- Have any recent inspections been done? Can we get a copy of the seller's disclosures and any deferred-maintenance estimates?
- Built in 1952 — when were the roof, HVAC, electrical panel, plumbing, and water heater last replaced?
- Is there a deadline driving the sale (1031 exchange, divorce, estate, relocation)? That informs how much negotiation room exists.
- Schools are D-rated, which usually means shorter tenancies and higher turnover. Who's the typical renter profile here, and what's been the actual vacancy rate?
- Crime grade is F in this area — have there been break-ins, vandalism, or insurance claims at this property in the last 3 years? What carrier currently insures it and at what premium?
- What's the average days-on-market for RENTAL listings here right now (not sales)? A rising rental-DOM trend means longer vacancies and softer asking-rent achievability than the comps imply.
- What's the recent tenant-quality profile in this submarket — average credit score on applications, eviction rate, late-payment / NSF rate, and stable-employment percentage? A property-management company in the area should have these aggregated.
- How much new apartment / multifamily construction is in the pipeline within 1–3 miles? Heavy new supply (>2% of stock underway) typically softens rents 12–24 months out; light construction supports rent growth.
Investment metrics
- 1% rule
- 2.64% ✓
- Cap rate
- 23.01%
- Cash-on-cash
- 59.72%
- DSCR
- 3.66
- GRM
- 3.2
CMA / ARV
No comps found within radius.
Projected returns pro-forma
3.0% appreciation · 3.0% rent growth · sell at horizon
- IRR
- 64.6%
- Equity multiple
- 4.60×
- Total profit
- $211,748
- Equity at exit
- $94,425
- IRR
- 64.1%
- Equity multiple
- 9.38×
- Total profit
- $492,764
- Equity at exit
- $145,520
Cash invested: $58,800 (down + closing). Projections, not guarantees.
Landlord ↔ Tenant lean methodology
- Overall (STATE)
- 18 Strongly Tenant-Friendly
- State California
- 18 Strongly Tenant-Friendly · D+13
- County
- — inherits STATE
- City
- — inherits STATE
ZIP-level market 95555
- Active inventory
- 4
- Price-to-rent
- 15.8×
Monthly cashflow live
- Estimated rent
- $5,541 medium interval (Pro) →
- Mortgage (P&I)
- −$1,101
- Tax est. 1.5%
- −$262 /mo · $3,150/yr
- Insurance
- −$88
- HOA
- −$0
- Lot rent
- −$0
- Vacancy / Maint / Mgmt
- −$1,164
- Net cashflow
- $2,926
Break-even live
Sensitivity live
| Price | -10% $3,071 | -5% $2,999 | +0% $2,926 | +5% $2,854 | +10% $2,781 |
|---|---|---|---|---|---|
| Rent | -10% $2,488 | -5% $2,707 | +0% $2,926 | +5% $3,145 | +10% $3,364 |
| Rate | -1.0pp $3,032 | -0.5pp $2,980 | base $2,926 | +0.5pp $2,872 | +1.0pp $2,816 |
5-unit breakdown (identical units grouped — click to expand)
| Units | Beds | Baths | Est. rent |
|---|---|---|---|
| 5× units | 3 | 1.5 | $5,540 |
| #1 | 3 | 1.5 | $1,108 |
| #2 | 3 | 1.5 | $1,108 |
| #3 | 3 | 1.5 | $1,108 |
| #4 | 3 | 1.5 | $1,108 |
| #5 | 3 | 1.5 | $1,108 |
| Total (5 units) | $5,541 | ||
UW: 25.0% down · 7.5% · 30yr · 1.5% tax · 5.0% vac · 8.0% maint · 8.0% mgmt
Financing live
Cash to close
- Down payment
- $52,500
- Closing costs
- $6,300
- Reserves months
- —
- Total cash needed
- —
Loan-product check · same deal, 3 products live
Conventional
25% down · 7.5% · 30yr
- Down + closing
- —
- Monthly P&I
- —
- Monthly cashflow
- —
- DSCR
- —
- Eligible?
- —
Personal DTI + credit; lowest rate.
DSCR
20% down · 8.5% · 30yr
- Down + closing
- —
- Monthly P&I
- —
- Monthly cashflow
- —
- DSCR
- —
- Eligible?
- —
No personal income docs; deal must DSCR.
Hard money
10% down · 12.0% · 12mo
- Down + closing
- —
- Monthly P&I
- —
- Monthly cashflow
- —
- DSCR
- —
- Eligible?
- —
Short-term bridge; refi at stabilization.
Listing history 18 events
-
2026-06-22days on market $210,000 Active 21 DOM
-
2026-06-21days on market $210,000 Active 20 DOM
-
2026-06-19days on market $210,000 Active 18 DOM
-
2026-06-18days on market $210,000 Active 17 DOM
-
2026-06-17days on market $210,000 Active 16 DOM
-
2026-06-16days on market $210,000 Active 15 DOM
-
2026-06-15days on market $210,000 Active 14 DOM
-
2026-06-14days on market $210,000 Active 12 DOM
-
2026-06-12days on market $210,000 Active 11 DOM
-
2026-06-10days on market $210,000 Active 9 DOM
-
2026-06-09days on market $210,000 Active 8 DOM
-
2026-06-08days on market $210,000 Active 7 DOM
-
2026-06-07days on market $210,000 Active 6 DOM
-
2026-06-05days on market $210,000 Active 4 DOM
-
2026-06-05days on market $210,000 Active 3 DOM
-
2026-06-03days on market $210,000 Active 2 DOM
-
2026-06-01remarks 259-char remark
-
2026-06-01$210,000 Active 1 DOM
ⓘ Source: listings_history table (triggers on properties + properties_extension) + one-shot
backfill from property_details.listing_events for pre-trigger history.
Nearby sold comps map
Loading sold comps map…
Walkable amenities ~0.75 mi
Loading nearby amenities…
Taxation est. · year 1
- Rental income
- $66,492
- − Mortgage interest
- −$11,763
- − Property taxes
- −$3,150
- − Insurance
- −$1,050
- − Repairs & maintenance
- −$5,319
- − Management
- −$5,319
- − Depreciation
- −$6,109
- Taxable income
- $33,781
- Est. tax owed @ 24.0%
- −$8,107
- After-tax cash flow
- $27,006/yr
For passive investors: Depreciation is non-cash, so a rental often shows a tax loss while cash-flowing — sheltering income. Rental losses are passive: they offset passive income freely, and up to $25,000/yr can offset ordinary (W-2) income if you actively participate and your MAGI is under $100k (phasing out to $0 by $150k); unused losses carry forward. On sale, claimed depreciation is recaptured at up to 25%, and gains may owe capital-gains tax (a 1031 exchange can defer both). Figures are a year-1 estimate at your 24.0% rate — not tax advice; consult a CPA.
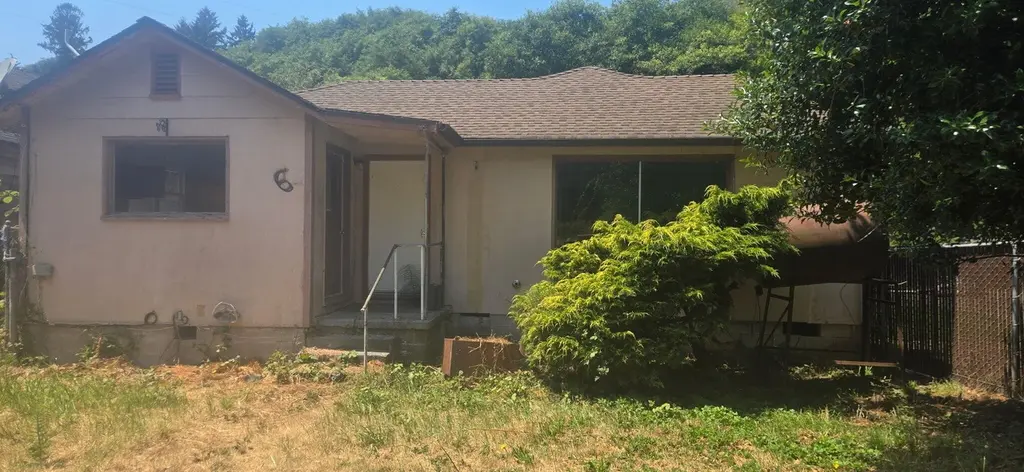
Condition & rehab AI · 1 photo
This property requires extensive repairs and maintenance, including landscaping and exterior updates, to improve its resale and rental value.
Repairs flagged
- Major landscaping — Overgrown vegetation and unkempt lawn
- Major exterior siding — General lack of maintenance and overgrown vegetation
- Major interior walls and paint — No visible condition
Value-add opportunities
- Both Landscaping and exterior maintenance — Improves curb appeal and rental potential
- Both Interior painting and updates — Enhances interior aesthetics and rental appeal
Renovation cost estimate screening
| Repair item | Severity | Est. cost |
|---|---|---|
| landscaping · Overgrown vegetation and unkempt lawn | Major | $15,000–50,000 |
| exterior siding · General lack of maintenance and overgrown vegetation | Major | $15,000–50,000 |
| interior walls and paint · No visible condition | Major | $15,000–50,000 |
| Total estimated repair cost · 3 items | $45,000–150,000 |
Value-add ROI direction
- Both Landscaping and exterior maintenance — Improves curb appeal and rental potential ↑
- Both Interior painting and updates — Enhances interior aesthetics and rental appeal ↑
ⓘ Cost ranges are severity-bucket heuristics (US national rule-of-thumb). Get contractor quotes + a written scope before underwriting a rehab budget.
Schools (NCES district)
- District
- Orick Elementary
- NCES district ID
- 0628830
- Math proficiency
- 0% ▬ 0.00%
- Reading proficiency
- 0% ▬ 0.00%
- Median HH income
- $38,017
- Composite
- 4.25/100
- National rank
- #15032
- State rank
- #1389 of 1400 in CA
Livability — Orick
- Score
- 52/100
- State rank
- #1002
- US rank
- #24838
Category grades
Schools grade is shown separately in the Schools card above.
Census & demographics
- Census place
- Orick, CA
- Population (ZIP)
- 349
Population outlook (Humboldt County) Hauer SSP2
- Today (2025)
- 135,550 people
- By 2030
- 134,798 · -0.6%
- By 2040
- 132,222 · -2.5%
- By 2050
- 130,850 · -3.5%
- By 2075
- 128,656 · -5.1%
- By 2100
- 120,238 · -11.3%
Race, ethnicity, and origin ACS 2023
- Neighborhood character
- Diverse neighborhood (Simpson 0.66)
- Race & ethnicity
- White 58% Two or more races 29% Hispanic / Latino 8% Native American 7%
- Hispanic origin (detail)
- Mexican 8%
- Common ancestry
- Slovak 13% Portuguese 5% Lithuanian 5%
- Foreign-born
- 3% · Canada
- Languages at home
- 92% English-only · Spanish 6% Other Indo-European 2%
Political lean MEDSL · Humboldt
- 2024 margin
- Strong D (+28.4) · D 62.0% · R 33.6% · Other 4.5%
- 2008→2024 swing
- +0.2pp no change · 2008: 28.2pp · 2024: 28.4pp
- All cycles
- 2024: D+28.4 2020: D+33.4 2016: D+25.9 2012: D+26.2 2008: D+28.2
Not yet ingested
- Civics
- —
Market trends
- HPI YoY
- —
- Current HPI
- —
- Rent YoY
- —
- Metro
- —
- State GDP YoY
- ▲ 3.21%
- F500 in state
- 116
Industry mix (Fortune 500 HQ in CA)
| Industry | F500 HQs | Revenue |
|---|---|---|
| Technology | 27 | $1,492B |
|
||
| Financial Services | 3 | $174B |
|
||
| Retail | 3 | $44B |
|
||
| Insurance | 3 | $26B |
|
||
| Media / Entertainment | 2 | $115B |
|
||
| Pharmaceuticals / Biotech | 2 | $62B |
|
||
Price history
1 event — show timeline
- 2026-06-01 Listed $210,000 HAR
Cash-flow waterfall
monthlySold comps — $/sqft
last 12 mo · ≤1 miLoading sold comps…