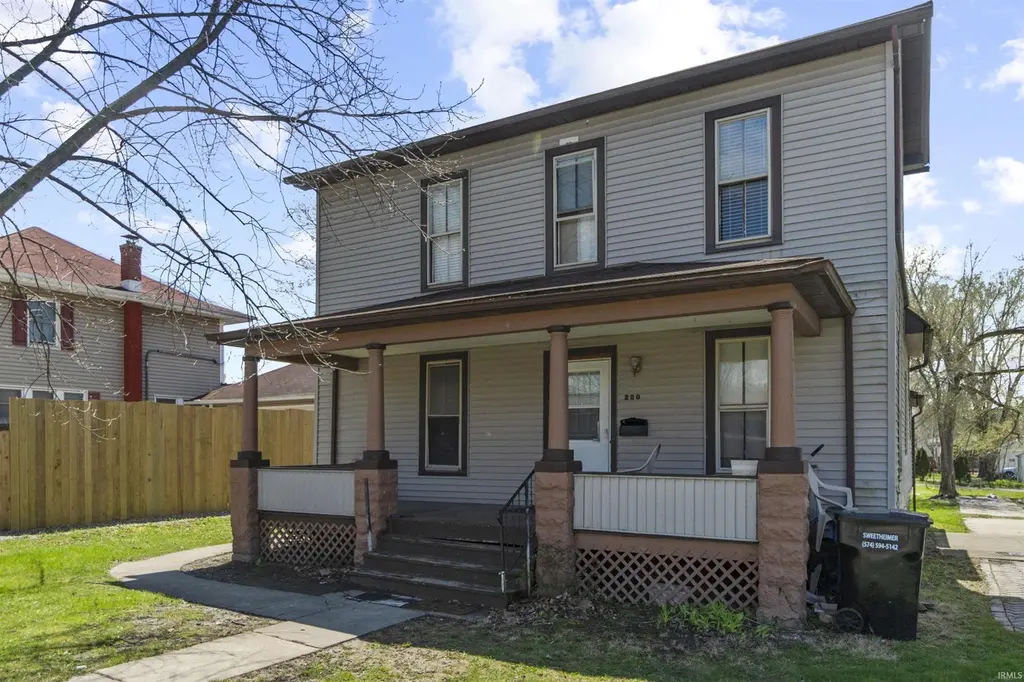
220 E Van Buren St · Columbia City, IN
Flood risk 1/10 · Minimal
- FEMA flood zone
- X (unshaded)
- Chance of flooding over 30 yrs
- 0.0%
- Est. flood insurance / yr
- $473 – $860
Fire risk 1/10 · Minimal
- Est. fire insurance / yr
- $717 – $1,331
Heat risk 3/10 · Minor
- Hot days now (above 99°F)
- 7 days/yr
- Hot days in 30 yrs
- 17 days/yr
Wind risk 2/10 · Minimal
- Chance of severe wind over 30 yrs
- —
Air-quality risk 2/10 · Minimal
- Unhealthy air days now
- 1 days/yr
- Unhealthy air days in 30 yrs
- 1 days/yr
Risk factors via First Street. Map © Google.
Why this score? — see what drove the F grade
The composite is a weighted blend of 9 inputs, each scored 0–100. Each bar is that input's sub-score; the figure is the points it added to the 100-point composite (weight × sub-score).
- Cash flow +9.5/30.0
- ARV discount +7.5/15.0
- Livability +3.7/5.0
- Schools +3.4/10.0
- 1% rule +2.8/10.0
- DSCR +2.7/10.0
- Rent growth +2.5/5.0
- Condition / age +2.5/5.0
- Appreciation +0.0/10.0
$137,500
🖨 Deal sheet (PDF) 📄 Offer letter ✓ Due diligence
Listing remarks
* * * * TWO TRIPLEX'S for $275,000 * * * See agent remarks. Seller has newer investment opportunity and wants to sell these asap!. .. Do they need work. . YES but. . opportunity awaits with this Triplex, a lucrative deal for a savvy investors. Boasting three well-appointed units in a strategic location, this property ensures a strong rental history and tons of potential! This triplex offers three 1 bed/1 bath units.
Key facts
- 6,407 sq ft lot
- 3 parking spots
- Built 1942
Neighborhood map
What this means for you Summary
Snapshot
- This is a 1-bed/3.0-bath single-family listed at $138k.
Deal economics
- At list price, monthly cash flow is $-96 ($-1k/yr) — negative.
- To cash-flow at today's rent, offer at most $121k (12.3% below list).
- To meet the 1% rule (rent ≥ 1% of price), the offer needs to be $108k (21.8% below list).
- Recommended offer: $108k (21.8% below list) — sets the bar for 1% rule.
- Cap rate 5.5% vs local median 3.6% in Columbia City — top-decile yield for the area; either an underpriced asset or a hidden risk that comps aren't pricing in. Stress-test before assuming the spread holds.
Location & tenants
- Location reads 74/100 on livability (#73 in IN, #4,647 nationally) — a middle-class / working-renter tenant base. Strengths: crime A+, cost of living A+, housing A+; Watch: employment D+, amenities D, commute F.
- Whitley County Consolidated Schools (rural): math 36% / reading 43% proficiency, ranked #140 of 301 in IN (top 46%) — families likely to look elsewhere, expect single-tenant / working-renter base with shorter leases.
- Zoned schools: Mary Raber Elementary School (math 32% / reading 32%, grade F, #652 of 994 statewide, top 68%, 251 students, 51% FRL); Indian Springs Middle School (math 28% / reading 40%, grade F, #173 of 330 statewide, top 53%, 834 students, 33% FRL); Columbia City High School (math 36% / reading 69%, grade C-, #102 of 369 statewide, top 28%, 1,147 students, 27% FRL).
- Market conditions: 113 active listings in the ZIP; 98 units permitted in Whitley County in 2024 (22 in 5+ unit buildings).
Forward outlook
- Local home prices are declining (-3.0%/yr); year-one equity from $951 of loan paydown is wiped out by about $4k of value loss. Plan a longer hold.
- Whitley County population projected at -10% by 2050 — secular population decline; favor cash flow + early exit over multi-decade hold.
Negotiation context
- Only 0 days on market — expect competitive offers; lowballing is unlikely to land.
- 3 sale attempts since 3y ago; this cycle's ask has dropped $12k (8%) from the opening price — seller is motivated, your offer sets the floor, not the list.
Risks & watch-outs
- Watch-outs: built in 1942 — expect roof / HVAC / electrical / plumbing capex.
Questions for the listing agent
- What do current leases actually rent for vs. the listed asking? Can we see a recent rent roll and the last 12 months of T-12 income?
- Built in 1942 — when were the roof, HVAC, electrical panel, plumbing, and water heater last replaced?
- Is there a deadline driving the sale (1031 exchange, divorce, estate, relocation)? That informs how much negotiation room exists.
- Schools are D-rated, which usually means shorter tenancies and higher turnover. Who's the typical renter profile here, and what's been the actual vacancy rate?
- The area grade is low — what's the realistic commute time and amenity access for the typical tenant pool here? Any planned neighborhood developments (good or bad) we should know about?
- What's the average days-on-market for RENTAL listings here right now (not sales)? A rising rental-DOM trend means longer vacancies and softer asking-rent achievability than the comps imply.
- What's the recent tenant-quality profile in this submarket — average credit score on applications, eviction rate, late-payment / NSF rate, and stable-employment percentage? A property-management company in the area should have these aggregated.
- How much new for-sale + rental construction is in the pipeline within 1–3 miles? Heavy new supply typically softens prices + rents 12–24 months out; constrained supply supports both.
Investment metrics
- 1% rule
- 0.78% ✗
- Cap rate
- 5.46%
- Cash-on-cash
- -2.98%
- DSCR
- 0.87
- GRM
- 10.7
CMA / ARV
No comps found within radius.
Projected returns pro-forma
-3.0% appreciation · 3.0% rent growth · sell at horizon
- IRR
- -21.3%
- Equity multiple
- 0.26×
- Total profit
- $-28,366
- Equity at exit
- $20,502
- IRR
- -14.8%
- Equity multiple
- 0.16×
- Total profit
- $-32,500
- Equity at exit
- $11,888
Cash invested: $38,500 (down + closing). Projections, not guarantees.
Landlord ↔ Tenant lean methodology
- Overall (STATE)
- 90 Strongly Landlord-Friendly
- State Indiana
- 90 Strongly Landlord-Friendly · R+11
- County
- — inherits STATE
- City
- — inherits STATE
ZIP-level market 46725
- Home prices YoY
- -21.5%
- Active inventory
- 113
- Price-to-rent
- 10.7×
Monthly cashflow live
- Estimated rent
- $1,075 medium interval (Pro) →
- Mortgage (P&I)
- −$721
- Tax from tax record
- −$167 /mo · $2,000/yr
- Insurance
- −$57
- HOA
- −$0
- Vacancy / Maint / Mgmt
- −$226
- Net cashflow
- $-96
Break-even live
Sensitivity live
| Price | -10% $-18 | -5% $-57 | +0% $-96 | +5% $-135 | +10% $-174 |
|---|---|---|---|---|---|
| Rent | -10% $-181 | -5% $-138 | +0% $-96 | +5% $-53 | +10% $-11 |
| Rate | -1.0pp $-27 | -0.5pp $-61 | base $-96 | +0.5pp $-131 | +1.0pp $-168 |
UW: 25.0% down · 7.5% · 30yr · 1.5% tax · 5.0% vac · 8.0% maint · 8.0% mgmt
Financing live
Cash to close
- Down payment
- $34,375
- Closing costs
- $4,125
- Reserves months
- —
- Total cash needed
- —
Loan-product check · same deal, 3 products live
Conventional
25% down · 7.5% · 30yr
- Down + closing
- —
- Monthly P&I
- —
- Monthly cashflow
- —
- DSCR
- —
- Eligible?
- —
Personal DTI + credit; lowest rate.
DSCR
20% down · 8.5% · 30yr
- Down + closing
- —
- Monthly P&I
- —
- Monthly cashflow
- —
- DSCR
- —
- Eligible?
- —
No personal income docs; deal must DSCR.
Hard money
10% down · 12.0% · 12mo
- Down + closing
- —
- Monthly P&I
- —
- Monthly cashflow
- —
- DSCR
- —
- Eligible?
- —
Short-term bridge; refi at stabilization.
Listing history 5 events
-
2025-12-03price $137,500
-
2025-10-07$149,000 Active
-
2023-12-28status Active
-
2023-12-15status Pending
-
2023-12-06$157,000 Active
ⓘ Source: listings_history table (triggers on properties + properties_extension) + one-shot
backfill from property_details.listing_events for pre-trigger history.
Tax reassessment forecast IN · Partial reset (capped growth)
- Current annual tax
- $2,000 · $167/mo
- Projected year-2 tax
- $2,000 · $167/mo
- Expected delta
- $0/yr ($0/mo · 0.0%)
ⓘ Screening estimate from a state-policy table — verify with the county assessor before closing.
Climate risk First Street
- Flood 1/10 Low FEMA zone X (unshaded) · 0% chance over 30 yrs
- Wildfire 1/10 Low
- Heat 3/10 Moderate 7 d/yr ≥99°F today · 17 d/yr by 30 yrs out
- Wind 2/10 Low
- Air quality 2/10 Low 1 unhealthy d/yr today · 1 by 30 yrs out
Nearby sold comps map
Loading sold comps map…
Walkable amenities ~0.75 mi
Loading nearby amenities…
Taxation est. · year 1
- Rental income
- $12,901
- − Mortgage interest
- −$7,702
- − Property taxes
- −$2,000
- − Insurance
- −$688
- − Repairs & maintenance
- −$1,032
- − Management
- −$1,032
- − Depreciation
- −$4,000
- Taxable loss
- −$3,553
- Est. tax savings @ 24.0%
- +$853
- After-tax cash flow
- $-296/yr
For passive investors: Depreciation is non-cash, so a rental often shows a tax loss while cash-flowing — sheltering income. Rental losses are passive: they offset passive income freely, and up to $25,000/yr can offset ordinary (W-2) income if you actively participate and your MAGI is under $100k (phasing out to $0 by $150k); unused losses carry forward. On sale, claimed depreciation is recaptured at up to 25%, and gains may owe capital-gains tax (a 1031 exchange can defer both). Figures are a year-1 estimate at your 24.0% rate — not tax advice; consult a CPA.
Schools (NCES district)
- District
- Whitley County Consolidated Schools
- NCES district ID
- 1802280
- Math proficiency
- 36% ▼ -6.00%
- Reading proficiency
- 43% ▼ -6.00%
- Median HH income
- $54,445
- Composite
- 34.48/100
- National rank
- #5184
- State rank
- #140 of 301 in IN
Livability — Columbia City
- Score
- 74/100
- State rank
- #73
- US rank
- #4647
Category grades
Schools grade is shown separately in the Schools card above.
Census & demographics
- Census place
- Columbia City, IN
- City population
- 22,941
- Population (ZIP)
- 22,941
Population outlook (Whitley County) Hauer SSP2
- Today (2025)
- 33,363 people
- By 2030
- 32,930 · -1.3%
- By 2040
- 31,598 · -5.3%
- By 2050
- 29,902 · -10.4%
- By 2075
- 25,785 · -22.7%
- By 2100
- 20,729 · -37.9%
Race, ethnicity, and origin ACS 2023
- Neighborhood character
- Predominantly White (92%)
- Race & ethnicity
- White 92% Two or more races 5% Hispanic / Latino 3%
- Common ancestry
- Italian 7% Lithuanian 3% Slovak 2%
- Foreign-born
- 1% · Canada
- Languages at home
- 98% English-only · Spanish 1%
Political lean MEDSL · Whitley
- 2024 margin
- Solid R (+49.9) · D 24.1% · R 74.0% · Other 1.9%
- 2008→2024 swing
- -28.4pp toward R · 2008: -21.5pp · 2024: -49.9pp
- All cycles
- 2024: R+49.9 2020: R+49.1 2016: R+51.4 2012: R+38.9 2008: R+21.5
Not yet ingested
- Civics
- —
Market trends
- HPI YoY
- ▼ -59.71%
- Current HPI
- 217.5929
- Rent YoY
- —
- Metro
- —
- State GDP YoY
- ▲ 2.90%
- F500 in state
- 18
Industry mix (Fortune 500 HQ in IN)
| Industry | F500 HQs | Revenue |
|---|---|---|
| Industrial Machinery | 2 | $37B |
|
||
| Healthcare | 1 | $177B |
|
||
| Pharmaceuticals | 1 | $45B |
|
||
| Metals / Steel | 1 | $18B |
|
||
| Agriculture | 1 | $17B |
|
||
| Packaging | 1 | $12B |
|
||
Price history
-12.4% since first listed5 events — show timeline
- 2025-12-03 Price Changed $137,500 IRMLS
- 2025-10-07 Listed $149,000 IRMLS
- 2023-12-28 Relisted — IRMLS
- 2023-12-15 Pending — IRMLS
- 2023-12-06 Listed $157,000 IRMLS
Property tax history
+5.6%/yrLatest (2024): $2,000 · +6.6% YoY. Source: county tax records.
Cash-flow waterfall
monthlySold comps — $/sqft
last 12 mo · ≤1 miLoading sold comps…